

The DOI matches its Crossref record; 30 of the 31 references it cites were found in a registry or an index.
Different scaling of white matter volume, cortical connectivity, and gyrification across rodent and primate brains
Open accessAbstract
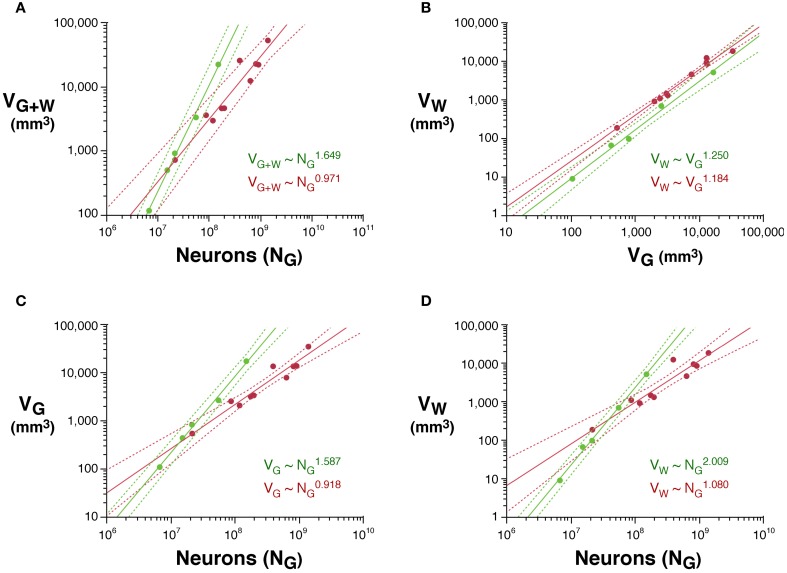
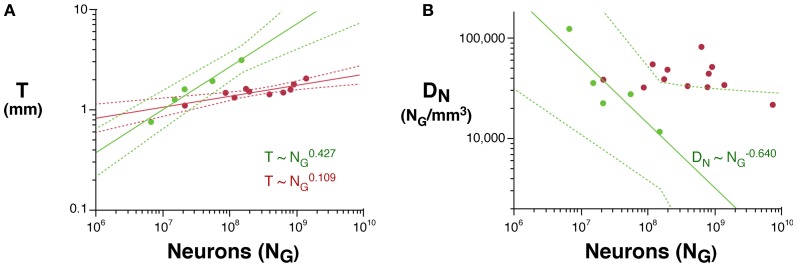
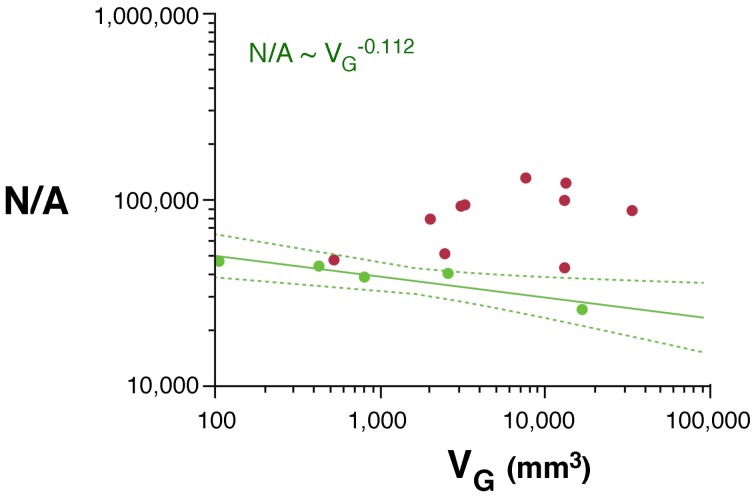
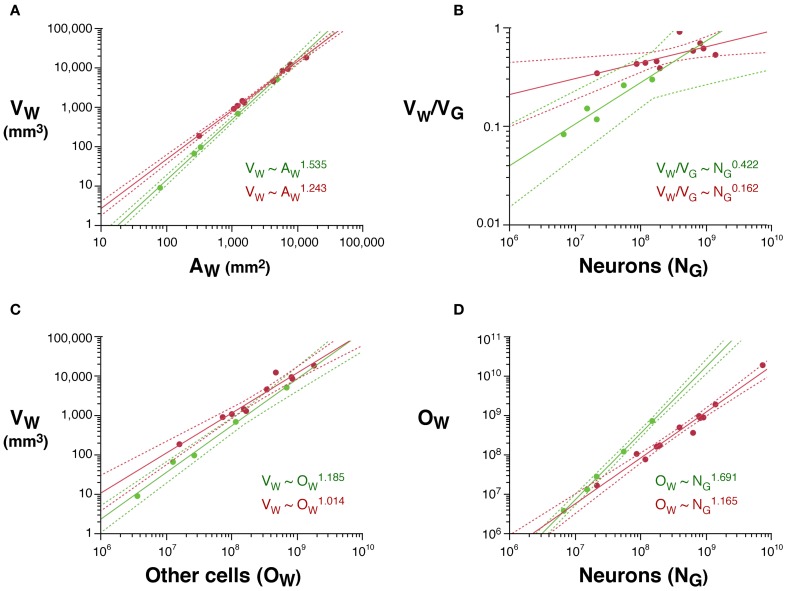
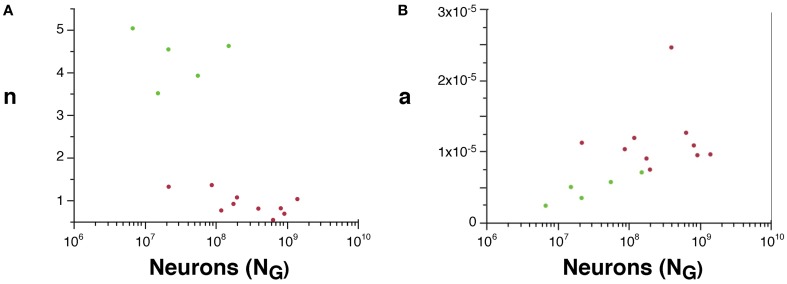
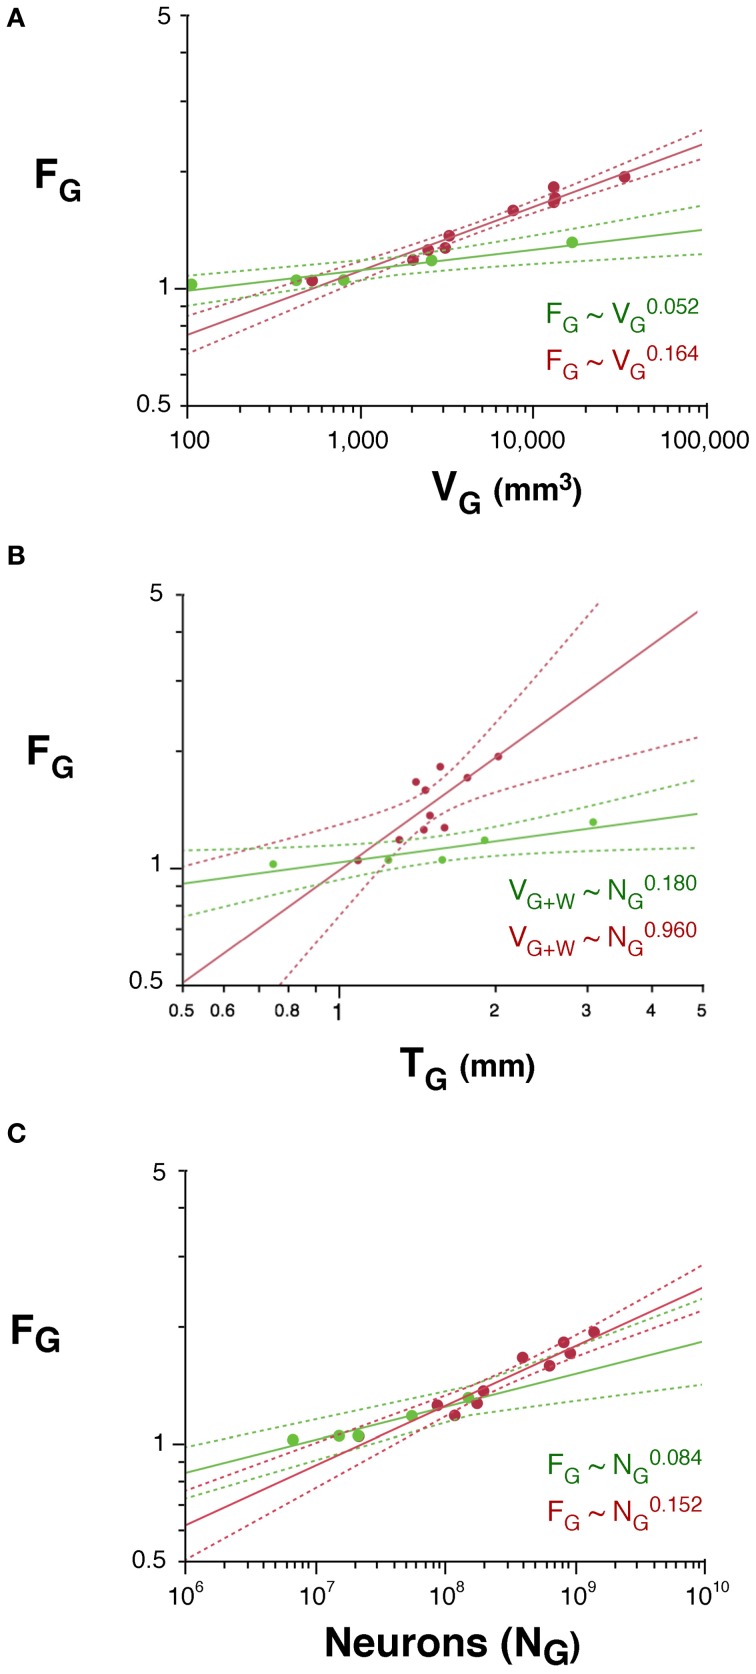
Expansion of the cortical gray matter in evolution has been accompanied by an even faster expansion of the subcortical white matter volume and by folding of the gray matter surface, events traditionally considered to occur homogeneously across mammalian species. Here we investigate how white matter expansion and cortical folding scale across species of rodents and primates as the gray matter gains neurons. We find very different scaling rules of white matter expansion across the two orders, favoring volume conservation and smaller propagation times in primates. For a similar number of cortical neurons, primates have a smaller connectivity fraction and less white matter volume than rodents; moreover, as the cortex gains neurons, there is a much faster increase in white matter volume and in its ratio to gray matter volume in rodents than in primates. Order-specific scaling of the white matter can be attributed to different scaling of average fiber caliber and neuronal connectivity in rodents and primates. Finally, cortical folding increases as different functions of the number of cortical neurons in rodents and primates, scaling faster in the latter than in the former. While the neuronal rules that govern gray and white matter scaling are different across rodents and primates, we find that they can be explained by the same unifying model, with order-specific exponents. The different scaling of the white matter has implications for the scaling of propagation time and computational capacity in evolution, and calls for a reappraisal of developmental models of cortical expansion in evolution.
Overview
The claims and statistics of this paper haven’t been checked yet.
Run the check — free, no account needed. It reads the open-access text and checks the sources it cites.
Integrity signals
Registry
Cites
Statistics
Figures
Verification
Claims the paper makes
The claims and statistics of this paper haven’t been checked yet.
Run the check — free, no account needed. It reads the open-access text and checks the sources it cites.
Claims other papers make about this one
Each is checked against this paper’s own text: does it say what the citing paper says it does?
The source backs part of the claim, not all of it — or backs it for a different population, condition or comparison.
In the citing paper
“The field has typically relied on mouse models to gain understanding of the impact of T21, but differences in cortical development between mice and humans — including the complexity of progenitor types or the formation of a lissencephalic rather than gyrencephalic brain153–155 — limit their ability to define mechanisms relevant to the human phenotype.”
From Consequences of trisomy 21 for brain development in Down syndrome (2024) · cites this paper as [155]
Experimental — accuracy not yet measured
Self-check
Percentages, sums and reported differences re-computed from the paper’s own numbers.
The self-check needs the paper’s full text.
Citations
Cites
Collective dynamics of ‘small-world’ networks
Watts, D. J., & Strogatz, S. H. (1998) · Nature · doi:10.1038/30918 · Cited by 43,060
Azevedo, F. A. C., Carvalho, L. R. B., Grinberg, L. T., Farfel, J. M., Ferretti, R. E. L., Leite, R. E. P., Filho, W. J., Lent, R., & Herculano‐Houzel, S. (2009) · Journal of Comparative Neurology · doi:10.1002/cne.21974 · Cited by 2,337
Self-citationThe human brain in numbers: a linearly scaled-up primate brain
Herculano-Houzel, S. (2009) · Frontiers in Human Neuroscience · doi:10.3389/neuro.09.031.2009 · Cited by 1,778 · cited 1×
“…have more folded cerebral cortices primates with similarly sized brains (Pillay and Manger, 2007), they probably have not more but rather far fewer cortical neurons than primates, due to much lower neuronal densities (Tower, 1954; Herculano-Houzel, 2009; and our unpublished observations).”
BackgroundSelf-citationThe Small World of the Cerebral Cortex
Sporns, O., & Zwi, J. D. (2004) · Neuroinformatics · doi:10.1385/ni:2:2:145 · Cited by 1,378
Collective dynamics of 'small-world' networks
Watts, D. J., & Strogatz, S. H. (2011) · Princeton University Press eBooks · doi:10.1515/9781400841356.301 · Cited by 1,087
THE BASIC UNIFORMITY IN STRUCTURE OF THE NEOCORTEX
Röckel, A., Hiorns, R. W., & Powell, T. P. S. (1980) · Brain · doi:10.1093/brain/103.2.221 · Cited by 890
Sporns, O., & Kötter, R. (2004) · PLoS Biology · doi:10.1371/journal.pbio.0020369 · Cited by 812
A universal scaling law between gray matter and white matter of cerebral cortex
Zhang, K., & Sejnowski, T. J. (2000) · Proceedings of the National Academy of Sciences · doi:10.1073/pnas.090504197 · Cited by 723
: Cellular scaling rules for rodent brains.
Herculano-Houzel, S., Mota, B., & Lent, R. (2006) · Proceedings of the National Academy of Sciences · doi:10.1073/pnas.0604911103 · Cited by 579
Self-citationHerculano-Houzel, S., & Lent, R. (2005) · The Journal of Neuroscience · doi:10.1523/jneurosci.4526-04.2005 · Cited by 551
Self-citation
Research works printed but not linked: 2
- Le Gros Clark W. (1945). Deformation patterns on the cerebral cortex, in Essays on Growth and Form, eds Le Gros Clark W. E. Medawar P. B. (Oxford: Oxford University Press), 1– 23
- Welker W. (1990). Why does cerebral cortex fissure and fold? A review of determinants of gyri and sulci, in Cerebral Cortex, Comparative structure and evolution of cerebral cortex, part II, Vol. 8B, eds Jones E. G. Peters A. (New York, NY: Plenum Press), 3– 136
Cited by
Sorted by citations
Phillips, K. A., Bales, K. L., Capitanio, J. P., Conley, A. J., Czoty, P. W., Hart, B. A. ‘., Hopkins, W. D., Hu, S., Miller, L. A., Nader, M. A., et al. (2014) · American Journal of Primatology · doi:10.1002/ajp.22281 · Cited by 649
Cortical folding scales universally with surface area and thickness, not number of neurons
Mota, B., & Herculano‐Houzel, S. (2015) · Science · doi:10.1126/science.aaa9101 · Cited by 286
Self-citation(2014) · doi:10.3389/fnana.2014.00077 · Cited by 206
Self-citationGămănuț, R., Kennedy, H., Toroczkai, Z., Ercsey-Ravasz, M., Essen, D. C. V., Knoblauch, K., & Burkhalter, A. (2018) · Neuron · doi:10.1016/j.neuron.2017.12.037 · Cited by 215
Herculano-Houzel, S., Avelino-de-Souza, K., Neves, K., PorfÃrio, J., Messeder, D., Mattos Feijó, L., Maldonado, J., & Manger, P. R. (2014) · Frontiers in Neuroanatomy · doi:10.3389/fnana.2014.00046 · Cited by 153
Self-citationOpportunities and challenges in modeling human brain disorders in transgenic primates
Jennings, C. G. B., Landman, R., Zhou, Y., Sharma, J., Hyman, J. B., Movshon, J. A., Qiu, Z., Roberts, A., Roe, A. W., Wang, X., et al. (2016) · Nature Neuroscience · doi:10.1038/nn.4362 · Cited by 145
Canonical computations of cerebral cortex
Miller, K. D. (2016) · Current Opinion in Neurobiology · doi:10.1016/j.conb.2016.01.008 · Cited by 136
Brain evolution and development: adaptation, allometry and constraint
Montgomery, S. H., Mundy, N. I., & Barton, R. A. (2016) · Proceedings of the Royal Society B Biological Sciences · doi:10.1098/rspb.2016.0433 · Cited by 124
Beyond brain size: Uncovering the neural correlates of behavioral and cognitive specialization
Logan, C., Avin, S., Boogert, N. J., Buskell, A., Cross, F. R., Currie, A., Jelbert, S. A., Lukas, D., Marés, R., Navarrete, A. F., et al. (2018) · Comparative Cognition & Behavior Reviews · doi:10.3819/ccbr.2018.130008 · Cited by 125
Mychasiuk, R., Hehar, H., Candy, S., Ma, I., & Esser, M. J. (2016) · Journal of Neuroscience Methods · doi:10.1016/j.jneumeth.2015.10.002 · Cited by 118
Whole-brain comparison of rodent and human brains using spatial transcriptomics
Beauchamp, A., Yee, Y., Darwin, B. C., Raznahan, A., Mars, R. B., & Lerch, J. P. (2022) · eLife · doi:10.7554/elife.79418 · Cited by 122
Functional Connectivity of the Brain Across Rodents and Humans
Xu, N., LaGrow, T. J., Anumba, N., Lee, A., Zhang, X., Yousefi, B., Bassil, Y., Clavijo, P. G., Sharghi, V. K., Maltbie, E. A., et al. (2022) · Frontiers in Neuroscience · doi:10.3389/fnins.2022.816331 · Cited by 100
Neural maps versus salt-and-pepper organization in visual cortex
Kaschube, M. (2013) · Current Opinion in Neurobiology · doi:10.1016/j.conb.2013.08.017 · Cited by 93
A structural transition in physical networks
Dehmamy, N., Milanlouei, S., & Barabási, A.-Ĺ. (2018) · Nature · doi:10.1038/s41586-018-0726-6 · Cited by 79
Reimann, H. M., & Niendorf, T. (2020) · Frontiers in Systems Neuroscience · doi:10.3389/fnsys.2020.00008 · Cited by 75
Fogarty, M. J., Mu, E. W. H., Noakes, P. G., Lavidis, N. A., & Bellingham, M. C. (2016) · Acta Neuropathologica Communications · doi:10.1186/s40478-016-0347-y · Cited by 76
A Whole-Cortex Probabilistic Diffusion Tractography Connectome
Rosen, B. Q., & Halgren, E. (2021) · eNeuro · doi:10.1523/eneuro.0416-20.2020 · Cited by 82
Mota, B., Santos, S. E. D., Ventura‐Antunes, L., Jardim-Messeder, D., Neves, K., Kazu, R. S., Noctor, S. C., Lambert, K. G., Bertelsen, M. F., Manger, P. R., et al. (2019) · Proceedings of the National Academy of Sciences · doi:10.1073/pnas.1716956116 · Cited by 71
Self-citationAssociative white matter connecting the dorsal and ventral posterior human cortex
Bullock, D. N., Takemura, H., Caiafa, C. F., Kitchell, L. M., McPherson, B., Caron, B. A., & Pestilli, F. (2019) · Brain Structure and Function · doi:10.1007/s00429-019-01907-8 · Cited by 72
Li, W., Chen, G., Liu, M., Zheng, J., Xu, Y., & He, Q. (2019) · Neural Regeneration Research · doi:10.4103/1673-5374.265185 · Cited by 72
Neanderthal-Derived Genetic Variation Shapes Modern Human Cranium and Brain
Gregory, M. D., Kippenhan, J. S., Eisenberg, D. P., Kohn, P. D., Dickinson, D., Mattay, V. S., Chen, Q., Weinberger, D. R., Saad, Z. S., & Berman, K. F. (2017) · Scientific Reports · doi:10.1038/s41598-017-06587-0 · Cited by 69
(2014) · doi:10.3389/fnana.2014.00128 · Cited by 61
Self-citationMontgomery, S. H., & Merrill, R. M. (2016) · Journal of Evolutionary Biology · doi:10.1111/jeb.13027 · Cited by 58
Visual cortical areas of the mouse: comparison of parcellation and network structure with primates
Laramée, M., & Boire, D. (2015) · Frontiers in Neural Circuits · doi:10.3389/fncir.2014.00149 · Cited by 61
Targeting human oligodendrocyte progenitors for myelin repair
Dietz, K. C., Polanco, J. J., Pol, S. U., & Sim, F. J. (2016) · Experimental Neurology · doi:10.1016/j.expneurol.2016.03.017 · Cited by 56
Herculano‐Houzel, S. (2015) · Proceedings of the Royal Society B Biological Sciences · doi:10.1098/rspb.2015.1853 · Cited by 54
Self-citationAtkinson, E. G., Rogers, J., Mahaney, M. C., Cox, L. A., & Cheverud, J. M. (2015) · Genetics · doi:10.1534/genetics.114.173443 · Cited by 52
Neural cognitive signals during spontaneous movements in the macaque
Tremblay, S., Testard, C., DiTullio, R. W., Inchauspé, J., & Petrides, M. (2022) · Nature Neuroscience · doi:10.1038/s41593-022-01220-4 · Cited by 41
Makris, N., Tsintou, M., & Dalamagkas, K. (2019) · Neural Regeneration Research · doi:10.4103/1673-5374.266048 · Cited by 42
The Pig as a Translational Animal Model for Biobehavioral and Neurotrauma Research
Netzley, A. H., & Pelled, G. (2023) · Biomedicines · doi:10.3390/biomedicines11082165 · Cited by 42
(2014) · doi:10.3389/fnana.2014.00005 · Cited by 41
Self-citationLin, J.-P., Brake, A., Donadieu, M., Lee, A., Smith, G., Hu, K., Nair, G., Kawaguchi, R., Sati, P., Geschwind, D. H., et al. (2025) · Science · doi:10.1126/science.adp6325 · Cited by 35
Estimating Brain Connectivity With Diffusion-Weighted Magnetic Resonance Imaging: Promise and Peril
Grier, M. D., Zimmermann, J., & Heilbronner, S. R. (2020) · Biological Psychiatry Cognitive Neuroscience and Neuroimaging · doi:10.1016/j.bpsc.2020.04.009 · Cited by 32
del Rey, N. L., & García‐Cabezas, M. Á. (2022) · Neurobiology of Disease · doi:10.1016/j.nbd.2022.105945 · Cited by 31
Modelling behaviors relevant to brain disorders in the nonhuman primate: Are we there yet?
Scott, J. T., & Bourne, J. A. (2021) · Progress in Neurobiology · doi:10.1016/j.pneurobio.2021.102183 · Cited by 31
Early Influences of Microbiota on White Matter Development in Germ-Free Piglets
Ahmed, S. A., Travis, S. D., Díaz-Bahamonde, F. V., Porter, D. D. L., Henry, S. N., Mykins, J., Ravipati, A., Booker, A., Ju, J., Ding, H., et al. (2021) · Frontiers in Cellular Neuroscience · doi:10.3389/fncel.2021.807170 · Cited by 31
CHD8 mutations increase gliogenesis to enlarge brain size in the nonhuman primate
Li, B., Zhao, H., Tu, Z., Yang, W., Han, R., Wang, L., Luo, X., Pan, M., Chen, X., Zhang, J., et al. (2023) · Cell Discovery · doi:10.1038/s41421-023-00525-3 · Cited by 31
Consequences of trisomy 21 for brain development in Down syndrome
Russo, M. L., Sousa, A. M. M., & Bhattacharyya, A. (2024) · Nature Reviews Neuroscience · doi:10.1038/s41583-024-00866-2 · Cited by 28
“…understanding of the impact of T21, but differences in cortical development between mice and humans — including the complexity of progenitor types or the formation of a lissencephalic rather than gyrencephalic brain 153–155 — limit their ability to define mechanisms relevant to the human phenotype.”
Song, X., Guo, Y., Li, H., Chen, C., Lee, J. H., Zhang, Y., Schmidt, Z., & Wang, X. (2022) · Nature Communications · doi:10.1038/s41467-022-29864-7 · Cited by 26
Mitchell, A. S., Hartig, R., Basso, M. A., Jarrett, W., Kästner, S., & Poirier, C. (2021) · NeuroImage · doi:10.1016/j.neuroimage.2020.117700 · Cited by 28
A systematic review of large animal models of combined traumatic brain injury and hemorrhagic shock
Mayer, A. R., Dodd, A. B., Vermillion, M. S., Stephenson, D. D., Chaudry, I. H., Bragin, D. E., Gigliotti, A. P., Dodd, R. J., Wasserott, B. C., Shukla, P., et al. (2019) · Neuroscience & Biobehavioral Reviews · doi:10.1016/j.neubiorev.2019.06.024 · Cited by 23
Neuroprotectants attenuate hypobaric hypoxia-induced brain injuries in cynomolgus monkeys
Pei, Z., Chen, J.-S., Li, Q., Sheng, L., Yi-Xing, G., Lu, B., Zhu, W., Xiao-Yu, Z., Yuan, L., Yuan, Z.-B., et al. (2020) · 动物学研究 · doi:10.24272/j.issn.2095-8137.2020.012 · Cited by 24
Microglia in animal models of autism spectrum disorders
Andoh, M., Ikegaya, Y., & Koyama, R. (2020) · Progress in molecular biology and translational science · doi:10.1016/bs.pmbts.2020.04.012 · Cited by 25
Hutchinson, E. B., Schwerin, S. C., Radomski, K. L., Sadeghi, N., Komlosh, M. E., Irfanoglu, M. O., Juliano, S. L., & Pierpaoli, C. M. (2018) · Frontiers in Neuroscience · doi:10.3389/fnins.2018.00573 · Cited by 22
Malignant infarction of the middle cerebral artery in a porcine model. A pilot study
Arikán, F., Martínez-Valverde, T., Sánchez-Guerrero, Á., Campos‐Martorell, M., Esteves, M., Gándara, D., Torné, R., Castro, L., Dalmau, A., Tibau, J., et al. (2017) · PLoS ONE · doi:10.1371/journal.pone.0172637 · Cited by 22
Roumazeilles, L., Lange, F., Benn, R. A., Andersson, J., Bertelsen, M. F., Manger, P. R., Flach, E. J., Khrapitchev, A. A., Bryant, K., Sallet, J., et al. (2021) · Cerebral Cortex · doi:10.1093/cercor/bhab285 · Cited by 21
Fonville, L., Drakesmith, M., Zammit, S., Lewis, G., Jones, D. K., & David, A. S. (2017) · Schizophrenia Bulletin · doi:10.1093/schbul/sbx195 · Cited by 21
Sex differences in cortical and subcortical human brain anatomy
Herron, T. J., Kang, X., & Woods, D. L. (2015) · F1000Research · doi:10.12688/f1000research.6210.1 · Cited by 20
Brain asymmetry in the white matter making and globularity
Theofanopoulou, C. (2015) · Frontiers in Psychology · doi:10.3389/fpsyg.2015.01355 · Cited by 20
Connectivity Matrices and Brain Graphs
(2016) · Elsevier eBooks · doi:10.1016/b978-0-12-407908-3.00003-0 · Cited by 21
Transcriptomic architecture of nuclei in the marmoset CNS
Lin, J., Kelly, H. M., Song, Y., Kawaguchi, R., Geschwind, D. H., Jacobson, S., & Reich, D. S. (2022) · Nature Communications · doi:10.1038/s41467-022-33140-z · Cited by 16
Cottam, N. C., Bamfo, T., Harrington, M. A., Charvet, C. J., Hekmatyar, K., Tulin, N., & Sun, J. (2023) · Brain Pathology · doi:10.1111/bpa.13162 · Cited by 15
Evaluation of focused ultrasound modulation of the blood-brain barrier in gray and white matter
Maio, A. D., Huang, Y., Lin, F., Stefanovic, B., Stanisz, G. J., & O’Reilly, M. A. (2025) · Journal of Controlled Release · doi:10.1016/j.jconrel.2025.113631 · Cited by 15
Schmidt, K. E., & Wolf, F. (2021) · Current Opinion in Neurobiology · doi:10.1016/j.conb.2021.10.007 · Cited by 20
Constant neuropilar ratio in the insect brain
Polilov, A. A., & Makarova, A. A. (2020) · Scientific Reports · doi:10.1038/s41598-020-78599-2 · Cited by 14
New Animal Models for Understanding FMRP Functions and FXS Pathology
Curnow, E. C., & Wang, Y. (2022) · Cells · doi:10.3390/cells11101628 · Cited by 14
What Makes the Human Brain Special: Key Features of Brain and Neocortex
Kaas, J., & Herculano-Houzel, S. (2017) · Springer series in cognitive and neural systems · doi:10.1007/978-3-319-29674-6_1 · Cited by 12
Self-citationLuo, F., Zhang, Z., Barnett, A., Bellinger, T. J., Turcato, F. C., Schmidt, K., & Luo, Y. (2020) · Experimental Neurology · doi:10.1016/j.expneurol.2019.113168 · Cited by 12
Piekarski, D. J., Zahr, N. M., Zhao, Q., Ferizi, U., Pohl, K. M., Sullivan, E. V., & Adolf Pfefferbaum, A. (2023) · Neuroimage Reports · doi:10.1016/j.ynirp.2023.100179 · Cited by 14
Jelescu, I., Grussu, F., Ianuș, A., Hansen, B., Barrett, R. L. C., Aggarwal, M., Michielse, S., Nasrallah, F. A., Syeda, W. T., Wang, N., et al. (2025) · Magnetic Resonance in Medicine · doi:10.1002/mrm.30429 · Cited by 21
Postupna, N. O., Latimer, C. S., Larson, E. B., Sherfield, E., Paladin, J., Shively, C. A., Jorgensen, M. J., Andrews, R. N., Kaplan, J. R., Crane, P. K., et al. (2017) · American Journal Of Pathology · doi:10.1016/j.ajpath.2016.12.010 · Cited by 12
Tang, T. T., Zawaski, J. A., Kesler, S. R., Beamish, C. A., Inoue, T., Perez, E. C., Bronk, L. F., Poenisch, F., Briere, T. M., Sabek, O. M., et al. (2021) · International Journal of Radiation Oncology*Biology*Physics · doi:10.1016/j.ijrobp.2021.09.005 · Cited by 12
Frigon, É., Gérin‐Lajoie, A., Dadar, M., Boire, D., & Maranzano, J. (2024) · Frontiers in Neuroanatomy · doi:10.3389/fnana.2024.1372953 · Cited by 12
Nonhuman Primate Models of Huntington’s Disease and Their Application in Translational Research
Badin, R. A. (2018) · Methods in molecular biology · doi:10.1007/978-1-4939-7825-0_14 · Cited by 12
Sleep-slow oscillation-spindle coupling precedes spindle-ripple coupling during development
Fechner, J., Contreras, M. P., Zorzo, C., Xia, S., Jan Born, A., & Inostroza, M. (2024) · SLEEP · doi:10.1093/sleep/zsae061 · Cited by 14
The structure of the perivascular compartment in the old canine brain: a case study
Criswell, T. P., Sharp, M. M., Dobson, H., Finucane, C. M., Weller, R. O., Verma, A., & Carare, R. O. (2017) · Clinical Science · doi:10.1042/cs20171278 · Cited by 11
Neuroglia and the microbiota-gut-brain axis
Blair, H., Morales, L., Cryan, J. F., & Aburto, M. R. (2025) · Handbook of clinical neurology · doi:10.1016/b978-0-443-19104-6.00001-2 · Cited by 12
Jyothilakshmi, T. K., Gurovich, Y., & Ashwell, K. W. S. (2020) · Zoology · doi:10.1016/j.zool.2020.125845 · Cited by 10
Oligodendrocyte progenitor cells the ever mitotic cells of the CNS
Kazanis, I. (2016) · Frontiers in Bioscience-Scholar · doi:10.2741/s444 · Cited by 10
Sphingosine 1-phosphate receptor subtype 1 (S1P1) activity in the course of Alzheimer's disease
Martínez‐Gardeazabal, J., Pereira‐Castelo, G., Moreno‐Rodríguez, M., Llorente‐Ovejero, A., Fernández, M., Fernández‐Vega, I., Manuel, I., & Rodríguez‐Puertas, R. (2024) · Neurobiology of Disease · doi:10.1016/j.nbd.2024.106713 · Cited by 9
Different ways of evolving tool-using brains in teleosts and amniotes
Estienne, P., Simion, M., Hagio, H., Yamamoto, N., Jenett, A., & Yamamoto, K. (2024) · Communications Biology · doi:10.1038/s42003-023-05663-8 · Cited by 9
Phase transitions of brain evolution that produced human language and beyond
Bretas, R. V., Yamazaki, Y., & Iriki, A. (2019) · Neuroscience Research · doi:10.1016/j.neures.2019.11.010 · Cited by 10
Regulatory and coding sequences of TRNP1 co-evolve with brain size and cortical folding in mammals
Kliesmete, Z., Wange, L. E., Vieth, B., Esgleas, M., Radmer, J., Hülsmann, M., Geuder, J., Richter, D., Ohnuki, M., Götz, M., et al. (2023) · eLife · doi:10.7554/elife.83593 · Cited by 9
Autio, J. A., Uematsu, A., Ikeda, T., Ose, T., Hou, Y., Magrou, L., Kimura, I., Ohno, M., Murata, K., Coalson, T., et al. (2025) · Proceedings on CD-ROM - International Society for Magnetic Resonance in Medicine. Scientific Meeting and Exhibition/Proceedings of the International Society for Magnetic Resonance in Medicine, Scientific Meeting and Exhibition · doi:10.58530/2025/4869 · Cited by 10
Mota, B., & Herculano‐Houzel, S. (2016) · Science · doi:10.1126/science.aad2346 · Cited by 8
Self-citationTsukada, N., Katsumata, M., Oki, K., Minami, K., Abe, T., Takahashi, S., Itoh, Y., & Suzuki, N. (2017) · Brain Research · doi:10.1016/j.brainres.2017.11.028 · Cited by 8
Evolution of Large Brain and Body Size in Mammals
Montgomery, S. H. (2016) · Elsevier eBooks · doi:10.1016/b978-0-12-804042-3.00034-8 · Cited by 7
Bhagwandin, A., Debipersadh, U., Kaswera‐Kyamakya, C., Gilissen, E., Rockland, K. S., Molnár, Z., & Manger, P. R. (2020) · The Journal of Comparative Neurology · doi:10.1002/cne.24894 · Cited by 9
Blast Scaling Parameters: Transitioning from Lung to Skull Base Metrics.
Lucke-Wold, B. P., Turner, R. C., Logsdon, A. F., Rosen, C. L., & Qaiser, R. A. (2017) · PubMed · Cited by 6
Mouhi, S., Pio, T., & Andersen, J. (2025) · Trends in Cell Biology · doi:10.1016/j.tcb.2025.11.003 · Cited by 7
What we have learned from non-human primates as animal models of epilepsy
Sanabria, V., Romariz, S. A. A., Braga, M., Pires, J. M., Naffah‐Mazzacoratti, M. D. G., Mello, L. E., Longo, B. M., & Foresti, M. L. (2024) · Epilepsy & Behavior · doi:10.1016/j.yebeh.2024.109706 · Cited by 5
Han, S., Wu, G., Wei, X., Meng, X., Zang, F., Shen, L., Dai, H., Wang, L., & Li, Y. (2022) · Brain Sciences · doi:10.3390/brainsci12081029 · Cited by 5
Herculano‐Houzel, S. (2016) · Evolution of Nervous Systems · doi:10.1016/b978-0-12-804042-3.00036-1 · Cited by 5
Self-citationAdvances in tissue optical clearing for 3D imaging in large animal
Deng, Y., Xu, J., Yu, T., & Zhu, D. Y. (2025) · Frontiers of Optoelectronics · doi:10.1007/s12200-025-00162-6 · Cited by 6
Reconstructing the human brain’s wiring diagram from axons up
Heilbronner, S. R., Reid, R. C., Casta, T. K., & Pestilli, F. (2025) · Trends in Neurosciences · doi:10.1016/j.tins.2025.11.001 · Cited by 4
Neves, K. (2016) · Elsevier eBooks · doi:10.1016/b978-0-12-804042-3.00047-6 · Cited by 4
Pérez-Santos, I., García‐Cabezas, M. Á., & Cavada, C. (2023) · Brain Structure and Function · doi:10.1007/s00429-023-02619-w · Cited by 5
Murata, K., Nozawa, K., Matsushita, M., Yamashita, A., Fujii, R., Awaga, Y., Hama, A. T., Natsume, T., Yoshida, G., Matsuyama, Y., et al. (2023) · Neural Regeneration Research · doi:10.4103/1673-5374.371382 · Cited by 4
Kariyappa, J. T., Zanoni, S., Bongers, A., Tong, L. J., & Ashwell, K. W. S. (2022) · The Journal of Comparative Neurology · doi:10.1002/cne.25328 · Cited by 3
Correlated Somatosensory Input in Parvalbumin/Pyramidal Cells in Mouse Motor Cortex
Goz, R. U., & Hooks, B. M. (2022) · eNeuro · doi:10.1523/eneuro.0488-22.2023 · Cited by 4
Brunaud, C., Valable, S., Ropars, G., Dwiri, F.-A., Naveau, M., Toutain, J., Bernaudin, M., Fréret, T., Léger, M., Touzani, O., et al. (2024) · Cancer Imaging · doi:10.1186/s40644-024-00736-1 · Cited by 3
Is Cetacean Intelligence Special? New Perspectives on the Debate
Chinea, A. (2017) · Entropy · doi:10.3390/e19100543 · Cited by 4
Shen, Y., Wang, X., Guo, S.-Y., Qiu, M.-S., Hou, G.-L., & Tan, Z. (2019) · Neuroscience Letters · doi:10.1016/j.neulet.2019.134600 · Cited by 3
Mitelman, S. A., Buchsbaum, M. S., Christian, B. T., Merrill, B., Adineh, M., DeCastro, A., Buchsbaum, B. R., & Lehrer, D. S. (2020) · Psychiatry Research Neuroimaging · doi:10.1016/j.pscychresns.2020.111060 · Cited by 3
Muñoz, D. G., & Weishaupt, N. (2017) · Elsevier eBooks · doi:10.1016/b978-0-12-801942-9.00005-7 · Cited by 3
A neuroprotective tetrapeptide for treatment of acute traumatic brain injury
Mann, A. P., Hussain, S., Scodeller, P., Moore, H. N. B., Sherazee, E. A., Russo, R. M., & Ruoslahti, E. (2025) · EMBO Molecular Medicine · doi:10.1038/s44321-025-00312-5 · Cited by 2
Luo, K., Liu, Y., Zhuang, K., & Wang, Z. (2025) · The FASEB Journal · doi:10.1096/fj.202502844r · Cited by 2
Coarse-graining model reveals universal exponential scaling in axonal length distributions
Józsa, M., Ercsey-Ravasz, M., & Lázár, Z. I. (2024) · Journal of Physics Complexity · doi:10.1088/2632-072x/ad66a6 · Cited by 2
Herculano-Houzel, S. (2020) · Elsevier eBooks · doi:10.1016/b978-0-12-820584-6.00014-3 · Cited by 2
Self-citationPhillips, J. C. (2014) · arXiv (Cornell University) · doi:10.48550/arxiv.1410.1419 · Cited by 2
Metadata
- Authors
- Ventura-Antunes, L., Mota, B., & Herculano-Houzel, S.
- Affiliations
- Universidade Federal do Rio de Janeiro (BR)
- ORCID
- Mota, Bruno
- Venue
- Frontiers in Neuroanatomy
- Publisher
- Frontiers Media SA
- Published
- 2013
- Volume
- 7
- Pages
- 3-3
- ISSN
- 1662-5129 (ISSN-L)
- PMC
- PMC3620553
- OpenAlex
- W2044032178
- Cited by
- 129
- References
- 31
- Citations by year
- 2026: 8 · 2025: 12 · 2024: 13 · 2023: 7 · 2022: 13 · 2021: 8 · 2020: 12 · 2019: 7 · 2018: 6 · 2017: 12 · 2016: 15 · 2015: 8 · 2014: 6 · 2013: 2
- FWCI
- 8.02
- Type
- journal article
- Language
- en
- Open access
- gold
- doi.org
- Licence
- cc-by
- Locations
- Frontiers in Neuroanatomy (publishedVersion, cc-by)
- Europe PMC (PubMed Central) (publishedVersion, cc-by)
- PubMed Central (publishedVersion, cc-by)
- PubMed (publishedVersion)
- DOAJ (DOAJ: Directory of Open Access Journals) (submittedVersion, cc-by-sa)
- Funders
- James S. McDonnell Foundation
- Coordenação de Aperfeiçoamento de Pessoal de Nível Superior
- Conselho Nacional de Desenvolvimento Científico e Tecnológico
- Fundação Carlos Chagas Filho de Amparo à Pesquisa do Estado do Rio de Janeiro
- Topics
- Health Sciences › Medicine › Radiology, Nuclear Medicine and Imaging › Advanced Neuroimaging Techniques and Applications
- Life Sciences › Agricultural and Biological Sciences › Ecology, Evolution, Behavior and Systematics › Primate Behavior and Ecology
- Life Sciences › Neuroscience › Developmental Neuroscience › Neurogenesis and neuroplasticity mechanisms
- Keywords
- white matter volume, cortical folding, cortical connectivity, primate brain evolution, propagation time, cortical expansion, scaling exponents, brain evolution
About these checks
Registry, retraction, Cites and statistics results are computed, not judged, with one exception: a printed reference that no index lists is read once by a model before it counts as a citation error. Claims are extracted by a model and kept only when their quote appears verbatim in the text; each cited source is then checked, with a model’s help, for whether it says what the claim relies on. Those verdicts can be wrong — read the claim’s quote and the cited source before relying on one.
Statistics and arithmetic are recomputed, not judged.
Confidence bands are shown only for fields calibrated on our annotated test set. None is calibrated yet, so no band is shown.
What counts as a claim ›How we measure confidence ›How we check this ›
Are you an author, or do you see a problem with this page? Request a review
