Cited by 161

The DOI matches its Crossref record; 8 of the 8 references it cites were found in a registry or an index.

Biodistribution of adeno-associated virus serotype 9 (AAV9) vector after intrathecal and intravenous delivery in mouse

Schuster, Daniel J., Dykstra, Jaclyn A., Riedl, Maureen S., Kitto, Kelley F., Belur, Lalitha R., McIvor, R. Scott, Elde, Robert P., Fairbanks, Carolyn A., Vulchanova, Lucy·2014·Frontiers in Neuroanatomy

Overview

The claims and statistics of this paper haven’t been checked yet.

Run the check — free, no account needed. It reads the open-access text and checks the sources it cites.

A few free checks a day · papers already verified open instantly · results are public

Integrity signals

Registry

Crossref · 10.3389/fnana.2014.00042

Cites

8 of 8 references verified0 citation errors · 0 not checkable

Statistics

Figures

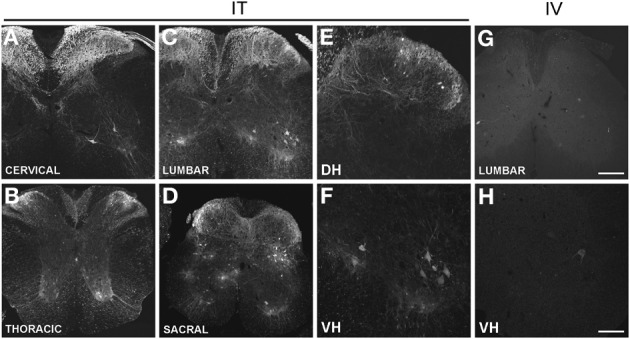
Figure 1 (A–H) Localization of GFP-ir in the spinal cord 3 weeks after i.t. (IT) or i.v. (IV) delivery of AAV9-GFP without mannitol. (A–D), GFP-ir in cervical (A), thoracic (B), lumbar (C), and sacral (D) spinal cord after i.t. delivery. (E,F) GFP-ir in dorsal (DH, E) and ventral (VH, F) horn of lumbar spinal cord after i.t. delivery. (G,H) GFP-ir in lumbar spinal cord (G) and ventral horn (VH, H) after i.v. delivery. Scale bars: 200 μm in (A–D), and (G); 100 μm in (E,F,H).
Figure 1 (A–H) Localization of GFP-ir in the spinal cord 3 weeks after i.t. (IT) or i.v. (IV) delivery of AAV9-GFP without mannitol. (A–D), GFP-ir in cervical (A), thoracic (B), lumbar (C), and sacral (D) spinal cord after i.t. delivery. (E,F) GFP-ir in dorsal (DH, E) and ventral (VH, F) horn of lumbar spinal cord after i.t. delivery. (G,H) GFP-ir in lumbar spinal cord (G) and ventral horn (VH, H) after i.v. delivery. Scale bars: 200 μm in (A–D), and (G); 100 μm in (E,F,H).CC BY · PubMed Central
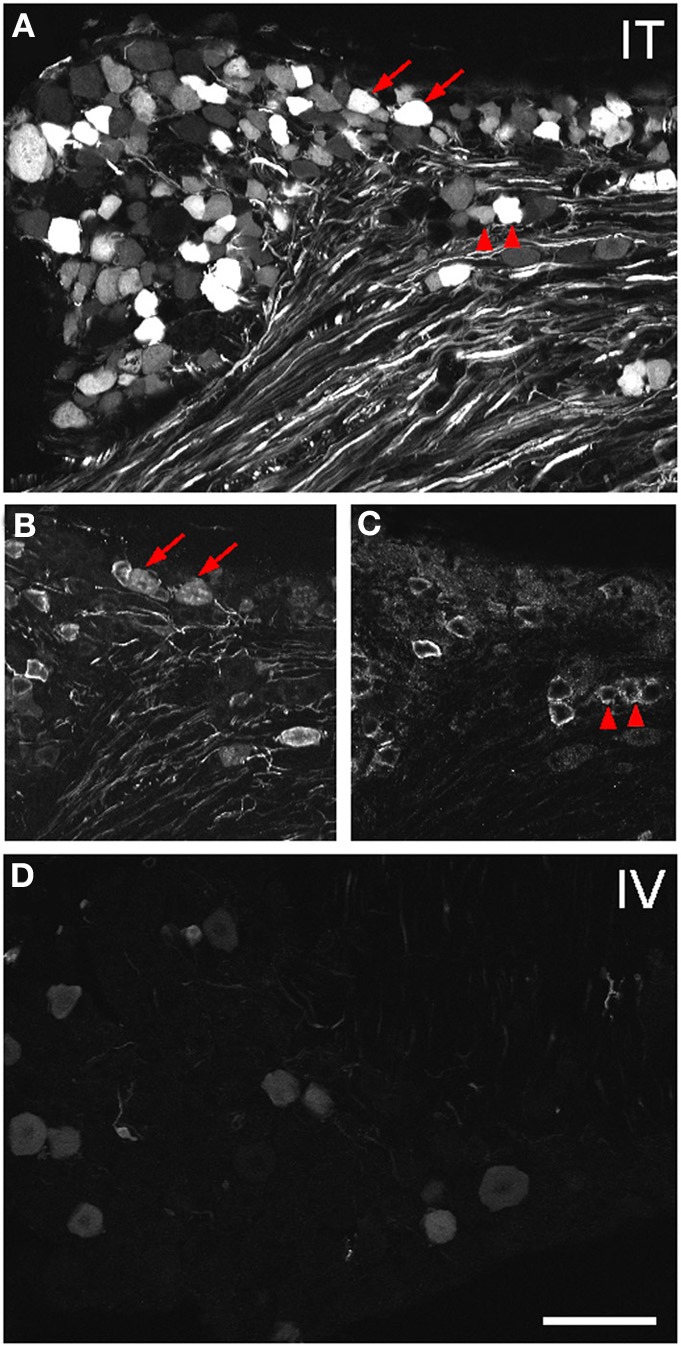
Figure 2 Localization of GFP-ir in lumbar DRG 3 weeks after i.t. or i.v. delivery of AAV9-GFP without mannitol. (A–C) GFP-ir in L4 DRG after i.t. delivery and its relationship to CGRP- (B) and P2X3-ir (C) Arrows and arrowheads indicate colocalization of GFP- and CGRP-ir and GFP- and P2X3-ir, respectively. (D) GFP-ir in L4 DRG after i.v. delivery. Scale bar: 100 μm.
Figure 2 Localization of GFP-ir in lumbar DRG 3 weeks after i.t. or i.v. delivery of AAV9-GFP without mannitol. (A–C) GFP-ir in L4 DRG after i.t. delivery and its relationship to CGRP- (B) and P2X3-ir (C) Arrows and arrowheads indicate colocalization of GFP- and CGRP-ir and GFP- and P2X3-ir, respectively. (D) GFP-ir in L4 DRG after i.v. delivery. Scale bar: 100 μm.CC BY · PubMed Central
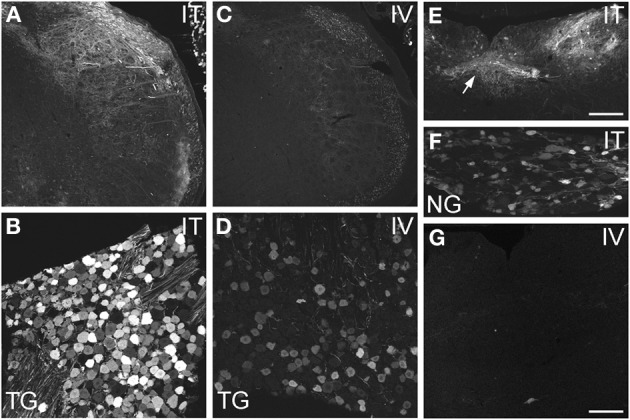
Figure 3 Localization of GFP-ir in spinal trigeminal nucleus and nucleus of the solitary tract (NTS) and their corresponding sensory ganglia. (A–D) GFP-ir in the spinal trigeminal nucleus (A,C) and trigeminal ganglion neurons (B,D) after i.t. (A,B) or i.v. (C,D) delivery. (E–G) Localization of GFP-ir in NTS (arrows, E) and the nodose ganglion (F) after i.t. delivery, and in NTS after i.v. delivery (G). Detection of labeling in G required higher magnification and laser power than in E. Scale bars: 200 μm in (A,C,E); 100 μmin (B,D,F,G).
Figure 3 Localization of GFP-ir in spinal trigeminal nucleus and nucleus of the solitary tract (NTS) and their corresponding sensory ganglia. (A–D) GFP-ir in the spinal trigeminal nucleus (A,C) and trigeminal ganglion neurons (B,D) after i.t. (A,B) or i.v. (C,D) delivery. (E–G) Localization of GFP-ir in NTS (arrows, E) and the nodose ganglion (F) after i.t. delivery, and in NTS after i.v. delivery (G). Detection of labeling in G required higher magnification and laser power than in E. Scale bars: 200 μm in (A,C,E); 100 μmin (B,D,F,G).CC BY · PubMed Central
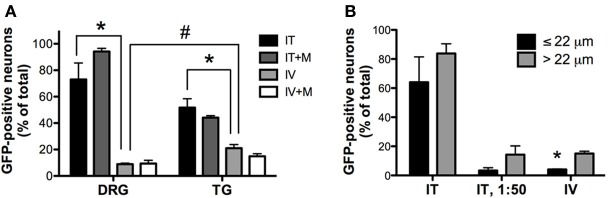
Figure 4 Quantitative image analysis of the transduction of sensory neurons. (A) Analysis of the proportions of GFP-positive DRG and trigeminal ganglion (TG) neurons [n = 4 for i.t. (IT) and i.v. (IV) groups; n = 2 for i.t. and i.v. groups with mannitol pretreatment (IT+M and IV+M, respectively)]. *, indicates significant difference between i.t. and i.v. treatment groups in DRG and TG (p < 0.005; One-Way ANOVA for each type of ganglia followed by Bonferroni post-hoc test). #, indicates significant difference between DRG and TG in the i.v. treatment group (p < 0.01; t-test). (B) Analysis of the proportions of small-diameter (≤22 um) and large-diameter (>22 um) GFP-positive DRG neurons. *, indicates significant difference between small- and large-diameter DRG neurons in the i.v. treatment group (p < 0.005; paired t-test).
Figure 4 Quantitative image analysis of the transduction of sensory neurons. (A) Analysis of the proportions of GFP-positive DRG and trigeminal ganglion (TG) neurons [n = 4 for i.t. (IT) and i.v. (IV) groups; n = 2 for i.t. and i.v. groups with mannitol pretreatment (IT+M and IV+M, respectively)]. *, indicates significant difference between i.t. and i.v. treatment groups in DRG and TG (p < 0.005; One-Way ANOVA for each type of ganglia followed by Bonferroni post-hoc test). #, indicates significant difference between DRG and TG in the i.v. treatment group (p < 0.01; t-test). (B) Analysis of the proportions of small-diameter (≤22 um) and large-diameter (>22 um) GFP-positive DRG neurons. *, indicates significant difference between small- and large-diameter DRG neurons in the i.v. treatment group (p < 0.005; paired t-test).CC BY · PubMed Central
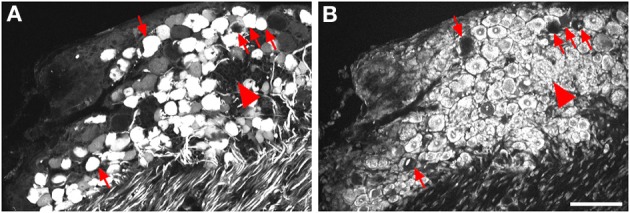
Figure 5 Labeling for GFP (A) and NeuroTrace (B) shows GFP-positive neurons devoid of NeuroTrace staining (arrows) and clusters of satellite cell nuclei (arrowhead) indicative of gliosis. Scale bar: 100 μm.
Figure 5 Labeling for GFP (A) and NeuroTrace (B) shows GFP-positive neurons devoid of NeuroTrace staining (arrows) and clusters of satellite cell nuclei (arrowhead) indicative of gliosis. Scale bar: 100 μm.CC BY · PubMed Central
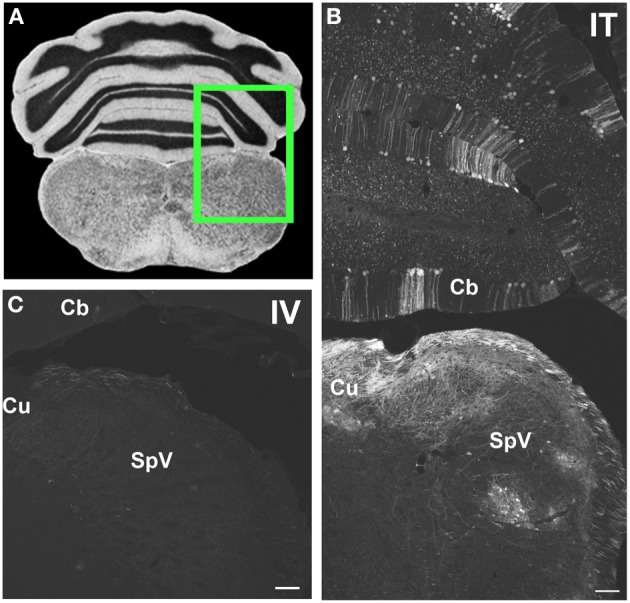
Figure 6 Representative images of GFP-ir in medulla and cerebellum 3 weeks after i.t. (IT) or intravenous i.v. (IV) AAV9-GFP delivery. (A) Coronal section labeled with cresyl violet was selected from the Mouse Brain Library (Rosen et al., 2000) C57BL/6 mouse brain atlas. Inset indicates approximate relative location of images shown in (B,C). (B) GFP-ir associated with cuneate nucleus (Cu), spinal nucleus of V (SpV), and cerebellar cortex (Cb) after i.t. delivery. (C) Limited GFP-ir in cuneate and spinal trigeminal nucleus after i.v. delivery. Scale bar: 100 μm.
Figure 6 Representative images of GFP-ir in medulla and cerebellum 3 weeks after i.t. (IT) or intravenous i.v. (IV) AAV9-GFP delivery. (A) Coronal section labeled with cresyl violet was selected from the Mouse Brain Library (Rosen et al., 2000) C57BL/6 mouse brain atlas. Inset indicates approximate relative location of images shown in (B,C). (B) GFP-ir associated with cuneate nucleus (Cu), spinal nucleus of V (SpV), and cerebellar cortex (Cb) after i.t. delivery. (C) Limited GFP-ir in cuneate and spinal trigeminal nucleus after i.v. delivery. Scale bar: 100 μm.CC BY · PubMed Central
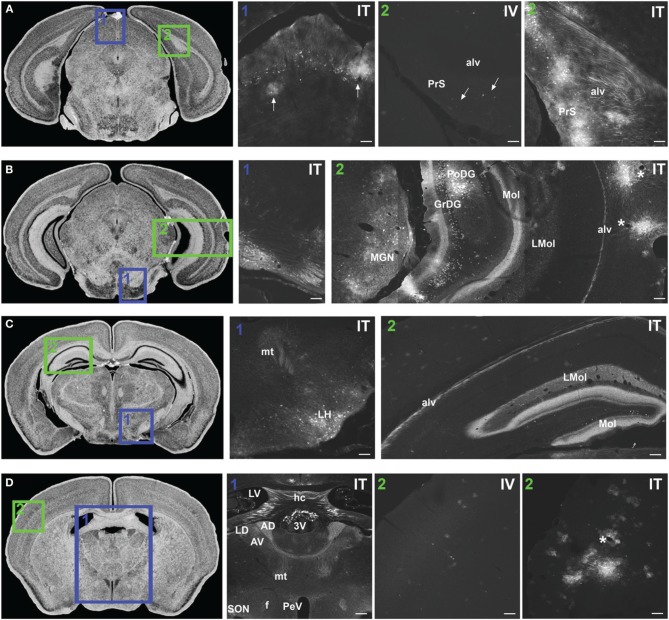
Figure 7 Representative images of GFP-ir in midbrain and diencephalon. Coronal sections labeled with cresyl violet were selected from the Mouse Brain Library (Rosen et al., 2000) C57BL/6 mouse brain atlas. Insets indicate approximate relative location of images shown in the associated panels. (A) Panel A1: GFP-ir in superior colliculus. Neuronal cell bodies appear as a band of puncta in the internal gray layer of the superior colliculus. Arrows indicate clusters of astrocytes associated with blood vessels. Panel A2: Intense GFP-ir is present in presubiculum (PrS) and alveus (alv) of the hippocampal formation after i.t. delivery, whereas after i.v. delivery labeling is limited to isolated cells (arrows). (B) Panel B1: GFP-ir in pontine nuclei and transverse pontine fibers. Panel B2: GFP-ir in the medial geniculate nucleus (MGN) of the thalamus, hippocampal formation, and temporal cortex. GFP-ir is present in many neurons of the polymorph (PoDG) and granular layers (GrDG) of the dentate gyrus as well as in nerve fibers of the molecular layer of dentate gyrus (Mol), stratum lacunosum-moleculare (LMol), and alveus (alv). Asterisks indicate blood vessels in proximity to clusters of labeled cells in cortex. (C) Panel C1: GFP-ir in lateral hypothalamus (LH) and mammilothalamic tract (mt). Panel C2: GFP-ir in the rostral-dorsal hippocampal formation. The molecular layer of the dentate gyrus (Mol), stratum lacunosum-moleculare (LMol), and alveus (alv) are highlighted by GFP-ir. (D) Panel D1: GFP-ir in the lateral dorsal nucleus (LD) of thalamus and in axons from the mammillo-thalamic tract (mt) entering portions of the anterior nuclear complex (AD and AV). Labeling is also present in the fornix (f), paraventricular (PeV), and supraoptic (SON) nuclei of hypothalamus, the hippocampal commissure (hc), and choroid plexus of the third (3V) and lateral ventricles (LV). Panels D2 IV and ITillustrate the difference in cortical expression between delivery routes. Asterisk indicates a blood vessel surrounded by GFP-ir cells. Scale bars: 100 μm in all panels except Panel D1, for which the scale bar is 250 μm.
Figure 7 Representative images of GFP-ir in midbrain and diencephalon. Coronal sections labeled with cresyl violet were selected from the Mouse Brain Library (Rosen et al., 2000) C57BL/6 mouse brain atlas. Insets indicate approximate relative location of images shown in the associated panels. (A) Panel A1: GFP-ir in superior colliculus. Neuronal cell bodies appear as a band of puncta in the internal gray layer of the superior colliculus. Arrows indicate clusters of astrocytes associated with blood vessels. Panel A2: Intense GFP-ir is present in presubiculum (PrS) and alveus (alv) of the hippocampal formation after i.t. delivery, whereas after i.v. delivery labeling is limited to isolated cells (arrows). (B) Panel B1: GFP-ir in pontine nuclei and transverse pontine fibers. Panel B2: GFP-ir in the medial geniculate nucleus (MGN) of the thalamus, hippocampal formation, and temporal cortex. GFP-ir is present in many neurons of the polymorph (PoDG) and granular layers (GrDG) of the dentate gyrus as well as in nerve fibers of the molecular layer of dentate gyrus (Mol), stratum lacunosum-moleculare (LMol), and alveus (alv). Asterisks indicate blood vessels in proximity to clusters of labeled cells in cortex. (C) Panel C1: GFP-ir in lateral hypothalamus (LH) and mammilothalamic tract (mt). Panel C2: GFP-ir in the rostral-dorsal hippocampal formation. The molecular layer of the dentate gyrus (Mol), stratum lacunosum-moleculare (LMol), and alveus (alv) are highlighted by GFP-ir. (D) Panel D1: GFP-ir in the lateral dorsal nucleus (LD) of thalamus and in axons from the mammillo-thalamic tract (mt) entering portions of the anterior nuclear complex (AD and AV). Labeling is also present in the fornix (f), paraventricular (PeV), and supraoptic (SON) nuclei of hypothalamus, the hippocampal commissure (hc), and choroid plexus of the third (3V) and lateral ventricles (LV). Panels D2 IV and ITillustrate the difference in cortical expression between delivery routes. Asterisk indicates a blood vessel surrounded by GFP-ir cells. Scale bars: 100 μm in all panels except Panel D1, for which the scale bar is 250 μm.CC BY · PubMed Central
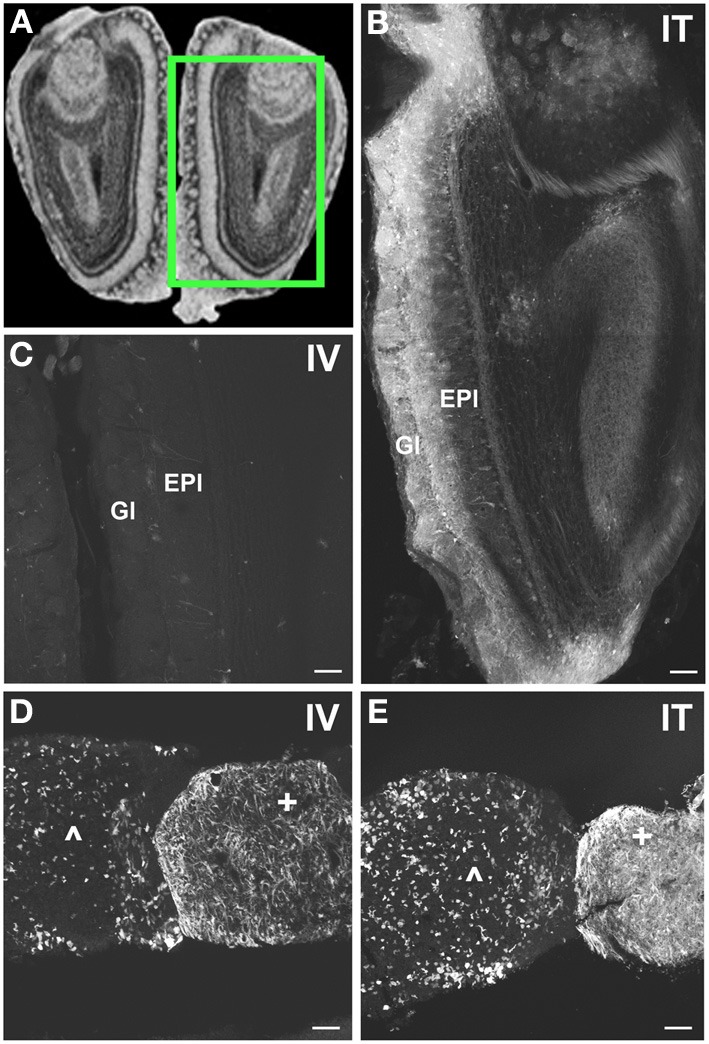
Figure 8 Localization of GFP-ir in olfactory bulb and pituitary gland. (A) Coronal section labeled with cresyl violet was selected from the Mouse Brain Library (Rosen et al., 2000) C57BL/6 mouse brain atlas. Inset indicates approximate relative location of images shown in (B,C). (B) After i.t. delivery, GFP-ir was found throughout the olfactory bulb, but was most intense in the glomerular (Gl) and external plexiform (EPl) layers. (C) Limited GFP-ir in olfactory bulb after i.v. delivery. (D,E) Localization of GFP-ir in pituitary. Labeling in anterior pituitary (∧) was comparable between delivery routes; however, labeling in posterior pituitary (+) appeared more intense after i.t. (D) delivery compared to i.v. (E). Scale bars: 100 μm.
Figure 8 Localization of GFP-ir in olfactory bulb and pituitary gland. (A) Coronal section labeled with cresyl violet was selected from the Mouse Brain Library (Rosen et al., 2000) C57BL/6 mouse brain atlas. Inset indicates approximate relative location of images shown in (B,C). (B) After i.t. delivery, GFP-ir was found throughout the olfactory bulb, but was most intense in the glomerular (Gl) and external plexiform (EPl) layers. (C) Limited GFP-ir in olfactory bulb after i.v. delivery. (D,E) Localization of GFP-ir in pituitary. Labeling in anterior pituitary (∧) was comparable between delivery routes; however, labeling in posterior pituitary (+) appeared more intense after i.t. (D) delivery compared to i.v. (E). Scale bars: 100 μm.CC BY · PubMed Central
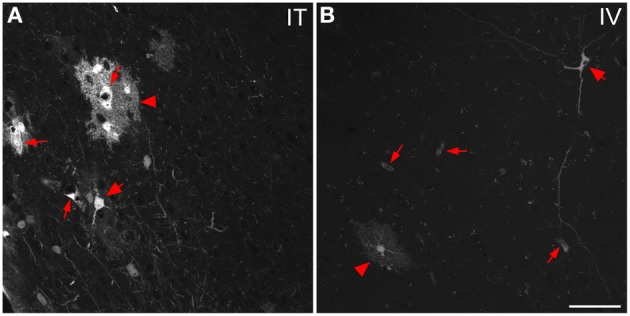
Figure 9 Representative images of GFP-ir cells in cortex. (A) After i.t. administration, intensely labeled clusters of cells were observed in close proximity to blood vessels, which are indicated by small arrows. The morphology of labeled cells was consistent with astrocytes (arrowheads) and neurons (large arrows). (B) After i.v. delivery, GFP-labeling was associated with blood vessels (small arrows) as well as isolated neurons (large arrow) and astrocytes (arrowhead). Scale bar: 50 μm.
Figure 9 Representative images of GFP-ir cells in cortex. (A) After i.t. administration, intensely labeled clusters of cells were observed in close proximity to blood vessels, which are indicated by small arrows. The morphology of labeled cells was consistent with astrocytes (arrowheads) and neurons (large arrows). (B) After i.v. delivery, GFP-labeling was associated with blood vessels (small arrows) as well as isolated neurons (large arrow) and astrocytes (arrowhead). Scale bar: 50 μm.CC BY · PubMed Central
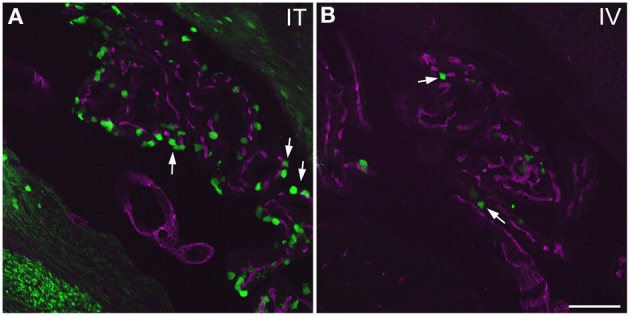
Figure 10 GFP-ir in choroid plexus of the fourth ventricle. GFP-ir (green) is present in many epithelial cells (examples indicated by arrows) after i.t. delivery (A) whereas labeling after i.v. delivery is limited (B). Blood vessels within the choroid plexus are visualized using CD31 (purple). Scale bar: 100 μm.
Figure 10 GFP-ir in choroid plexus of the fourth ventricle. GFP-ir (green) is present in many epithelial cells (examples indicated by arrows) after i.t. delivery (A) whereas labeling after i.v. delivery is limited (B). Blood vessels within the choroid plexus are visualized using CD31 (purple). Scale bar: 100 μm.CC BY · PubMed Central
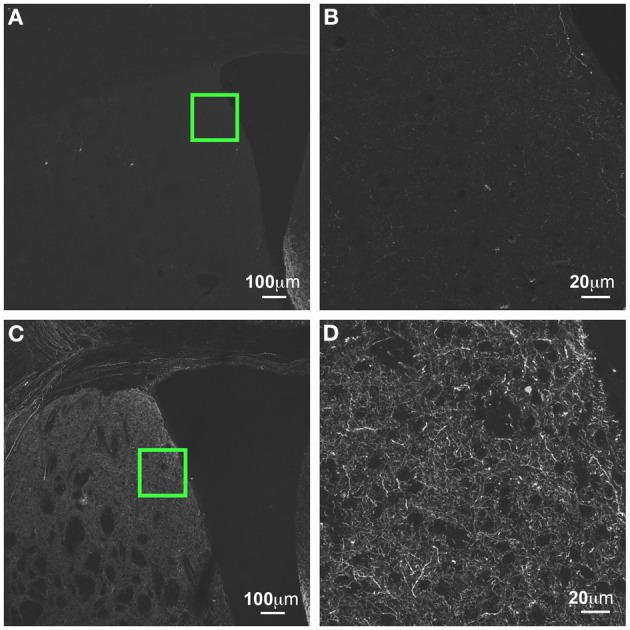
Figure 11 GFP-ir in striatum at 3 weeks compared to 6 weeks after i.t. delivery. (A,B) GFP-ir in striatum (CPu), 3 weeks after intrathecal delivery of AAV9-GFP. (C,D) GFP expression in striatum 3 weeks after intrathecal delivery of AAV9-GFP. Green insets in (A,C) are shown at higher magnification in (B,D) respectively.
Figure 11 GFP-ir in striatum at 3 weeks compared to 6 weeks after i.t. delivery. (A,B) GFP-ir in striatum (CPu), 3 weeks after intrathecal delivery of AAV9-GFP. (C,D) GFP expression in striatum 3 weeks after intrathecal delivery of AAV9-GFP. Green insets in (A,C) are shown at higher magnification in (B,D) respectively.CC BY · PubMed Central
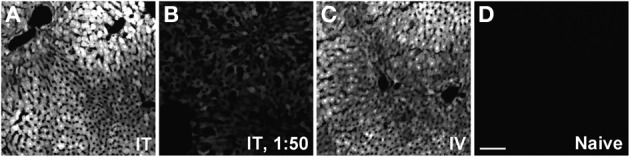
Figure 12 Representative images of GFP-ir in liver 3 weeks after AAV9-GFP administration. (A) i.t. treatment; (B) low-dose i.t. treatment; (C) i.v. treatment; (D) naïve. Scale bar: 100 μm.
Figure 12 Representative images of GFP-ir in liver 3 weeks after AAV9-GFP administration. (A) i.t. treatment; (B) low-dose i.t. treatment; (C) i.v. treatment; (D) naïve. Scale bar: 100 μm.CC BY · PubMed Central
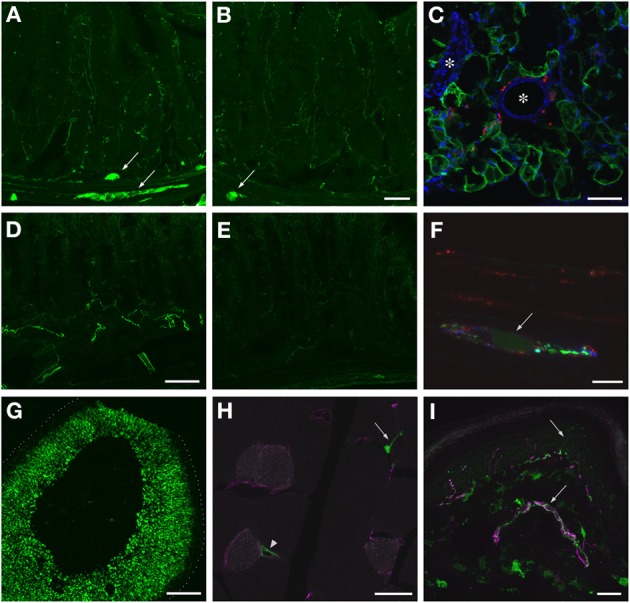
Figure 13 Localization of GFP-ir in peripheral tissues after i.t. or i.v. delivery of AAV9-GFP without mannitol pretreatment. (A,B) GFP-ir in ileum after i.t. (A) or i.v. (B) delivery. Arrows indicate enteric ganglia. Scale bar: 50 μm. (C) GFP-ir (green) in adipocytes associated with ileac mesentery. DAPI (blue) labeling of nuclei outlines blood vessels (*). CGRP-ir nerve fibers in the mesentery are shown in red. Scale bar: 100 μm. (D,E) GFP-ir in colon after i.t. (D) or i.v. (E) delivery. Scale bar: 50 μm. (F) GFP-ir (green, arrow) neuron within a myenteric ganglion in colon. GFP-, SP- (red), and CGRP-ir (blue) nerve fibers are seen within the ganglion. Scale bar: 10 μm. (G) GFP-ir in adrenal cortex. Dotted line indicates the edge of the tissue. Scale bar: 200 μm. (H) GFP-ir in nerve endings (arrow) and blood vessel (arrowhead) in thigh skeletal muscle. CD31 labeling of endothelial cells is shown in purple. Scale bar: 25 μm. (I) GFP- and CGRP-ir (purple) in skin. Arrows indicate a nerve bundle in dermis and an epidermal nerve fiber. Scale bar: 25 μm. (C,F–I) Show labeling in tissues from i.t. treated mice. The pattern of labeling in the same tissues of i.v. treated mice was similar.
Figure 13 Localization of GFP-ir in peripheral tissues after i.t. or i.v. delivery of AAV9-GFP without mannitol pretreatment. (A,B) GFP-ir in ileum after i.t. (A) or i.v. (B) delivery. Arrows indicate enteric ganglia. Scale bar: 50 μm. (C) GFP-ir (green) in adipocytes associated with ileac mesentery. DAPI (blue) labeling of nuclei outlines blood vessels (*). CGRP-ir nerve fibers in the mesentery are shown in red. Scale bar: 100 μm. (D,E) GFP-ir in colon after i.t. (D) or i.v. (E) delivery. Scale bar: 50 μm. (F) GFP-ir (green, arrow) neuron within a myenteric ganglion in colon. GFP-, SP- (red), and CGRP-ir (blue) nerve fibers are seen within the ganglion. Scale bar: 10 μm. (G) GFP-ir in adrenal cortex. Dotted line indicates the edge of the tissue. Scale bar: 200 μm. (H) GFP-ir in nerve endings (arrow) and blood vessel (arrowhead) in thigh skeletal muscle. CD31 labeling of endothelial cells is shown in purple. Scale bar: 25 μm. (I) GFP- and CGRP-ir (purple) in skin. Arrows indicate a nerve bundle in dermis and an epidermal nerve fiber. Scale bar: 25 μm. (C,F–I) Show labeling in tissues from i.t. treated mice. The pattern of labeling in the same tissues of i.v. treated mice was similar.CC BY · PubMed Central

Verification

Claims the paper makes

The claims and statistics of this paper haven’t been checked yet.

Run the check — free, no account needed. It reads the open-access text and checks the sources it cites.

A few free checks a day · papers already verified open instantly · results are public

Claims other papers make about this one

Each is checked against this paper’s own text: does it say what the citing paper says it does?

Self-check

Percentages, sums and reported differences re-computed from the paper’s own numbers.

The self-check needs the paper’s full text.

Citations

Cites

Research works printed but not linked: 21

  1. Benkhelifa-Ziyyat, 2013, Intramuscular scAAV9-SMN injection mediates widespread gene delivery to the spinal cord and decreases disease severity in SMA mice, Mol. Ther, 21, 282, 10.1038/mt.2012.261 · DOI
  2. Ciesielska, 2013, Cerebral infusion of AAV9 vector-encoding non-self proteins can elicit cell-mediated immune responses, Mol. Ther, 21, 158, 10.1038/mt.2012.167 · DOI · Paper page
  3. Dirren, 2014, Intracerebroventricular Injection of adeno-associated virus 6 and 9 vectors for cell type-specific transgene expression in the spinal cord, Hum. Gene. Ther, 25, 109, 10.1089/hum.2013.021 · DOI
  4. Elmallah, 2014, Sustained correction of motoneuron histopathology following intramuscular delivery of AAV in pompe mice, Mol. Ther, 22, 702, 10.1038/mt.2013.282 · DOI
  5. Fairbanks, 2003, Spinal delivery of analgesics in experimental models of pain and analgesia, Adv. Drug Deliv. Rev, 55, 1007, 10.1016/S0169-409X(03)00101-7 · DOI
  6. Federici, 2012, Robust spinal motor neuron transduction following intrathecal delivery of AAV9 in pigs, Gene Ther, 19, 852, 10.1038/gt.2011.130 · DOI
  7. Fu, 2011, Correction of neurological disease of mucopolysaccharidosis IIIB in adult mice by rAAV9 trans-blood-brain barrier gene delivery, Mol. Ther, 19, 1025, 10.1038/mt.2011.34 · DOI
  8. Fu, 2003, Self-complementary adeno-associated virus serotype 2 vector: global distribution and broad dispersion of AAV-mediated transgene expression in mouse brain, Mol. Ther, 8, 911, 10.1016/j.ymthe.2003.08.021 · DOI
  9. Garg, 2013, Systemic delivery of MeCP2 rescues behavioral and cellular deficits in female mouse models of Rett syndrome, J. Neurosci, 33, 13612, 10.1523/JNEUROSCI.1854-13.2013 · DOI
  10. Gautron, 2011, Genetic tracing of Nav1.8-expressing vagal afferents in the mouse, J. Comp. Neurol, 519, 3085, 10.1002/cne.22667 · DOI
  11. Haurigot, 2013, Whole body correction of mucopolysaccharidosis IIIA by intracerebrospinal fluid gene therapy, J. Clin. Invest, 10.1172/JCI66778 · DOI · Paper page
  12. Hirai, 2014, Intrathecal AAV serotype 9-mediated delivery of shRNA against TRPV1 attenuates thermal hyperalgesia in a mouse model of peripheral nerve injury, Mol. Ther, 22, 409, 10.1038/mt.2013.247 · DOI
  13. Hirai, 2012, Intrathecal shRNA-AAV9 inhibits target protein expression in the spinal cord and dorsal root ganglia of adult mice, Hum. Gene. Ther. Methods, 23, 119, 10.1089/hgtb.2012.035 · DOI
  14. Hylden, 1981, Intrathecal substance P elicits a caudally-directed biting and scratching behavior in mice, Brain Res, 217, 212, 10.1016/0006-8993(81)90203-1 · DOI
  15. Jacques, 2012, AAV8(gfp) preferentially targets large diameter dorsal root ganglion neurones after both intra-dorsal root ganglion and intrathecal injection, Mol. Cell. Neurosci, 49, 464, 10.1016/j.mcn.2012.03.002 · DOI
  16. Johanson, 2008, Multiplicity of cerebrospinal fluid functions: New challenges in health and disease, Cerebrospinal Fluid Res, 5, 10, 10.1186/1743-8454-5-10 · DOI · Paper page
  17. Kollarik, 2010, Transgene expression and effective gene silencing in vagal afferent neurons in vivo using recombinant adeno-associated virus vectors, J. Physiol, 588, 4303, 10.1113/jphysiol.2010.192971 · DOI
  18. Mason, 2010, Comparison of AAV serotypes for gene delivery to dorsal root ganglion neurons, Mol. Ther, 18, 715, 10.1038/mt.2010.19 · DOI
  19. Mastakov, 2002, Immunological aspects of recombinant adeno-associated virus delivery to the mammalian brain, J. Virol, 76, 8446, 10.1128/JVI.76.16.8446-8454.2002 · DOI · Paper page
  20. Paxinos, 2001, The Mouse Brain in Stereotaxic Coordinates
  21. Riedl, 2009, Coexpression of alpha 2A-adrenergic and delta-opioid receptors in substance P-containing terminals in rat dorsal horn, J. Comp. Neurol, 513, 385, 10.1002/cne.21982 · DOI

Cited by

Sorted by citations

See all 161

Metadata

Authors
Schuster, D. J., Dykstra, J. A., Riedl, M. S., Kitto, K. F., Belur, L. R., McIvor, R. S., Elde, R. P., Fairbanks, C. A., & Vulchanova, L.
Venue
Frontiers in Neuroanatomy
Published
2014-06-10
Volume
8
ISSN
1662-5129
Cited by
161
References
8

About these checks

Registry, retraction, Cites and statistics results are computed, not judged, with one exception: a printed reference that no index lists is read once by a model before it counts as a citation error. Claims are extracted by a model and kept only when their quote appears verbatim in the text; each cited source is then checked, with a model’s help, for whether it says what the claim relies on. Those verdicts can be wrong — read the claim’s quote and the cited source before relying on one.

Statistics and arithmetic are recomputed, not judged.

Confidence bands are shown only for fields calibrated on our annotated test set. None is calibrated yet, so no band is shown.

What counts as a claim ›How we measure confidence ›How we check this ›

Are you an author, or do you see a problem with this page? Request a review