

The DOI matches its Crossref record; 61 of the 61 references it cites were found in a registry or an index.
Role of mitochondria ROS generation in ethanol-induced NLRP3 inflammasome activation and cell death in astroglial cells
Open accessAbstract
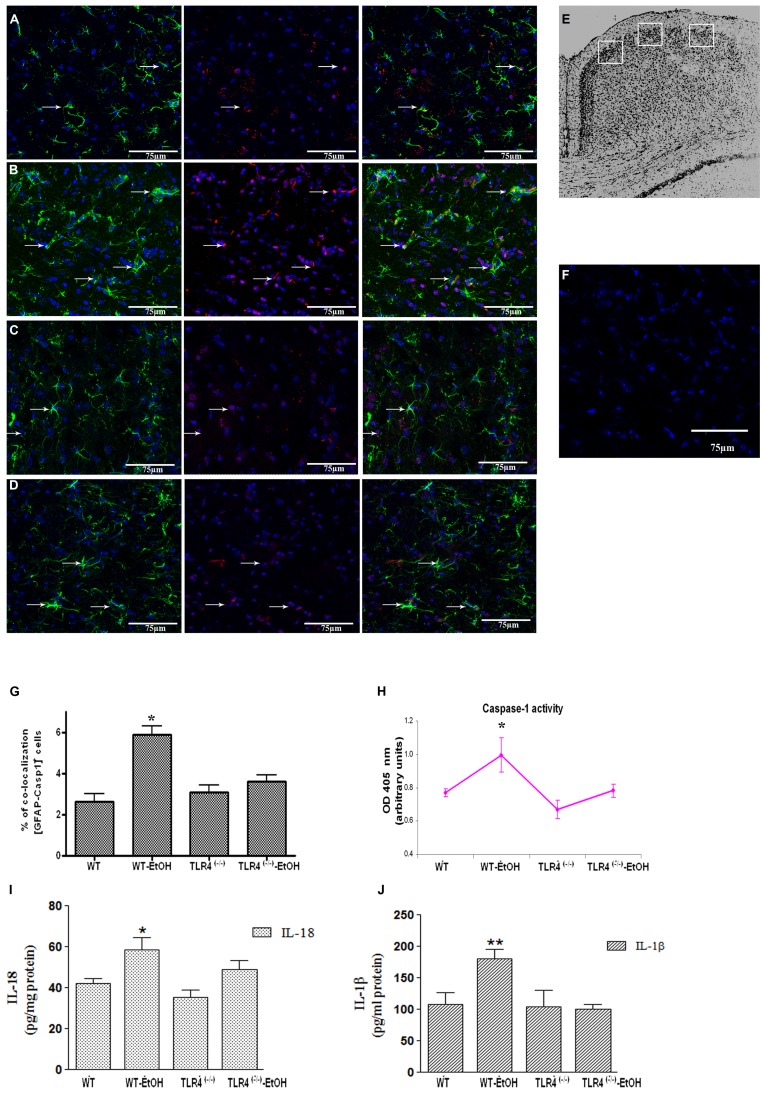
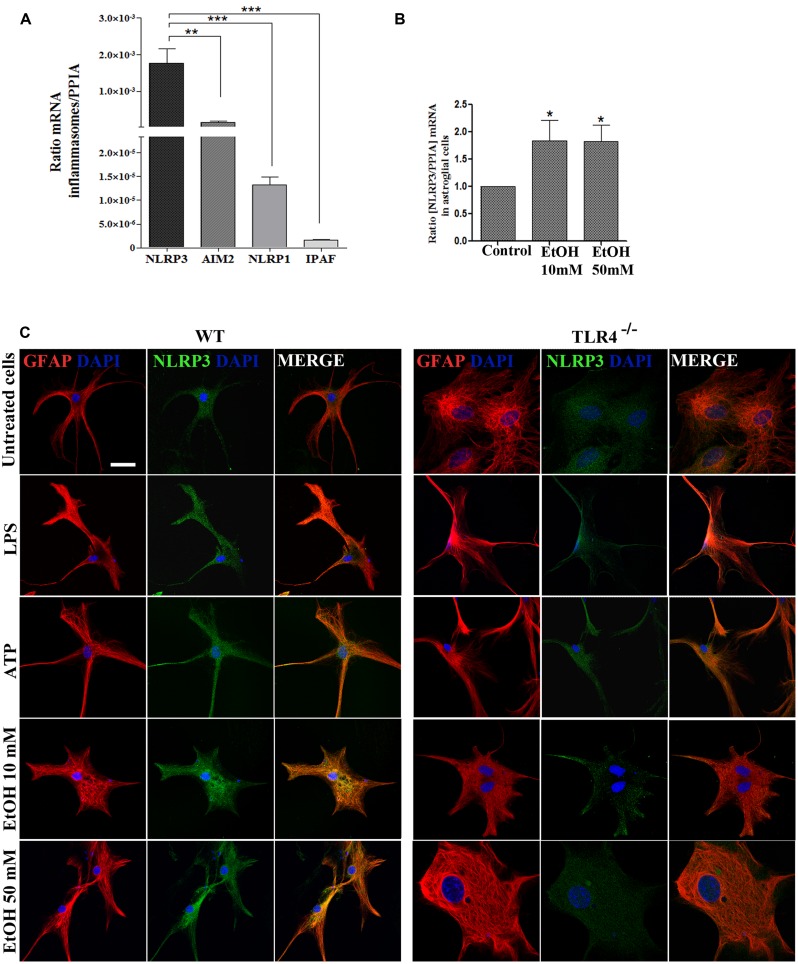
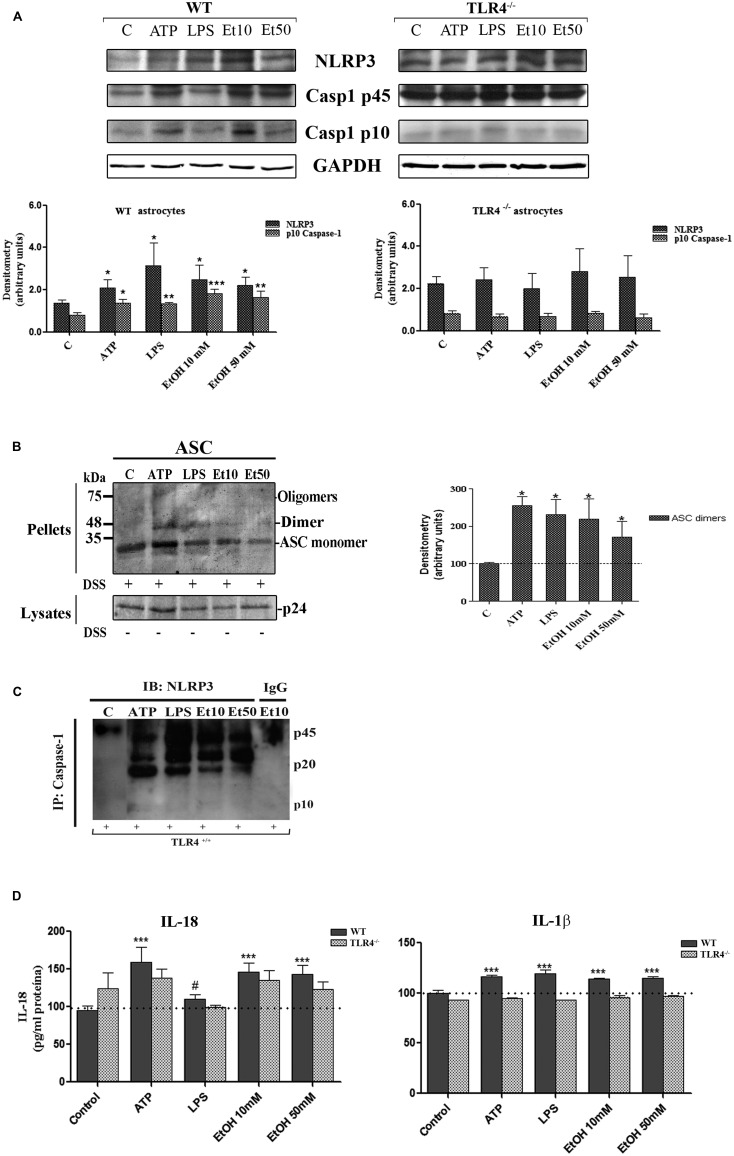
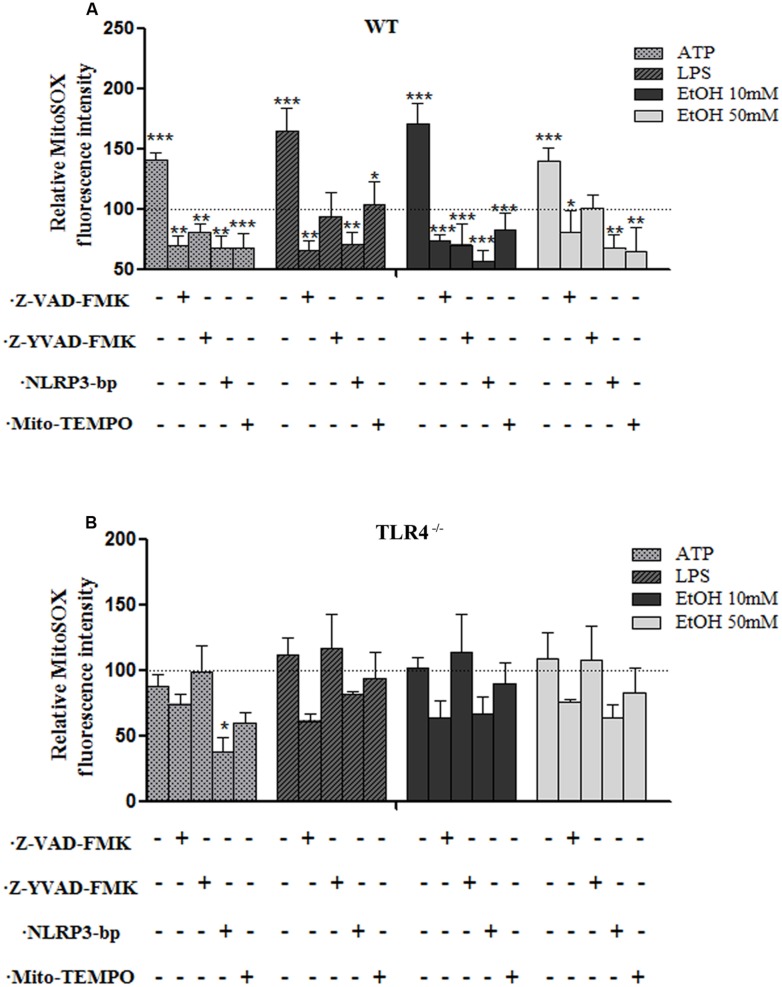
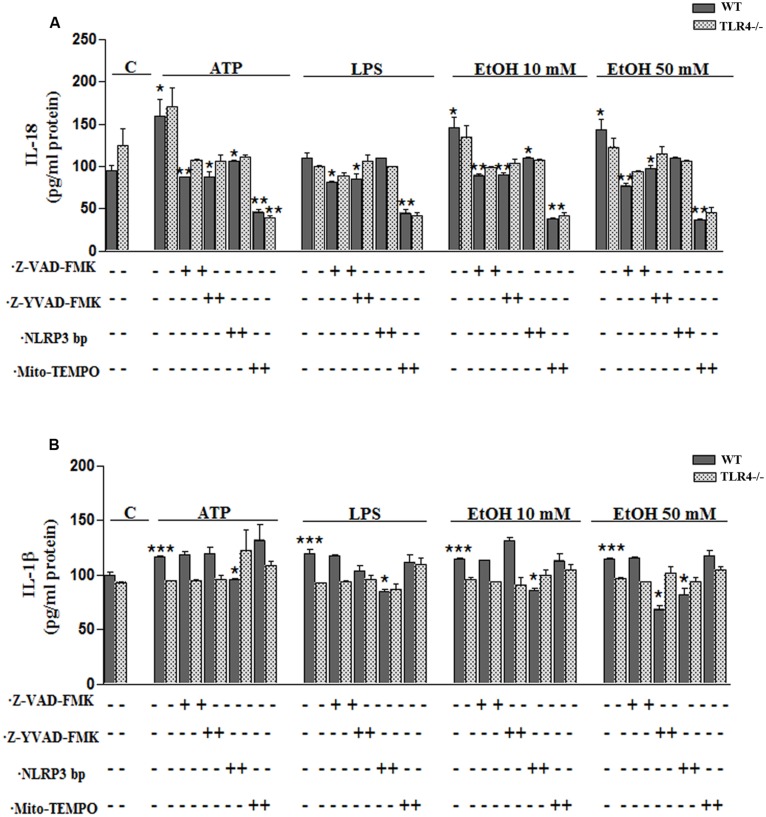
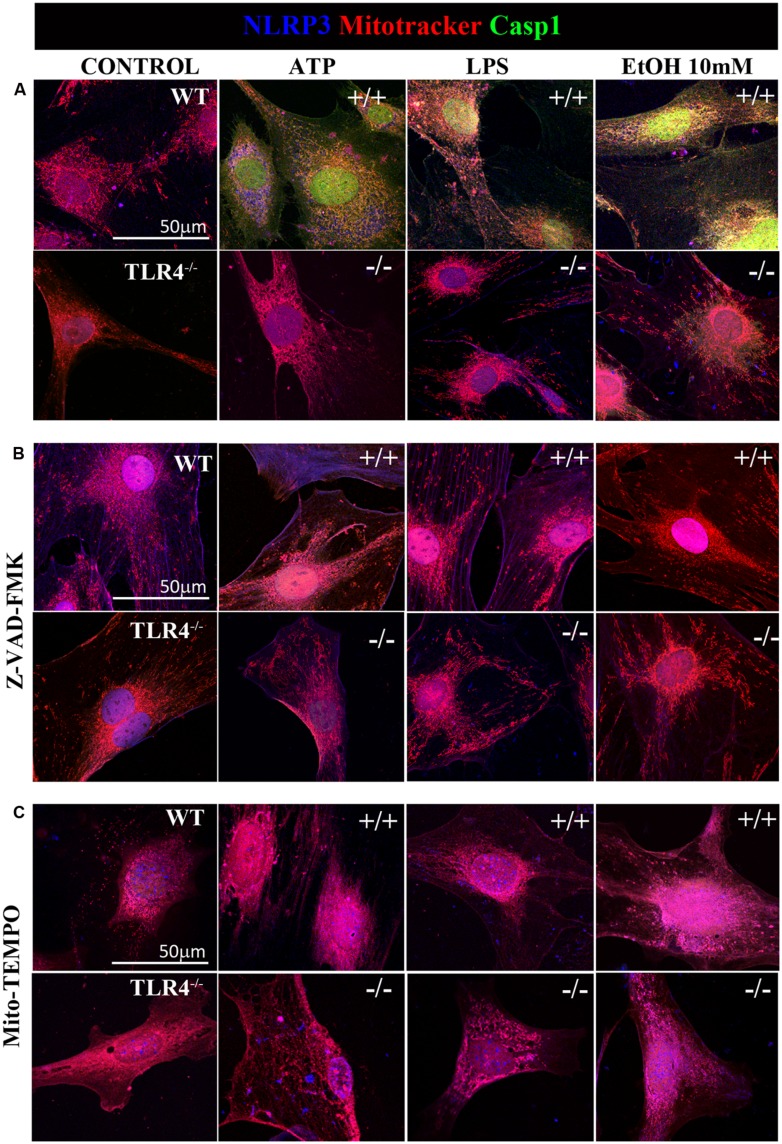
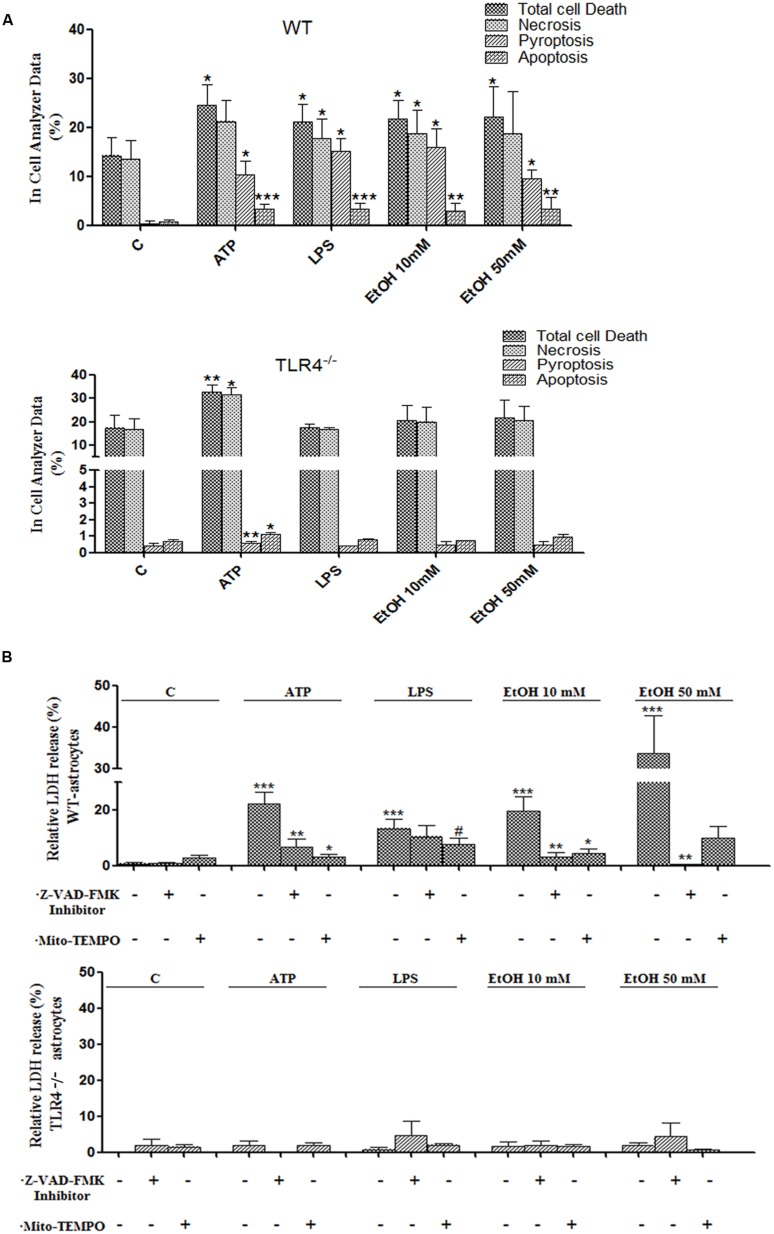
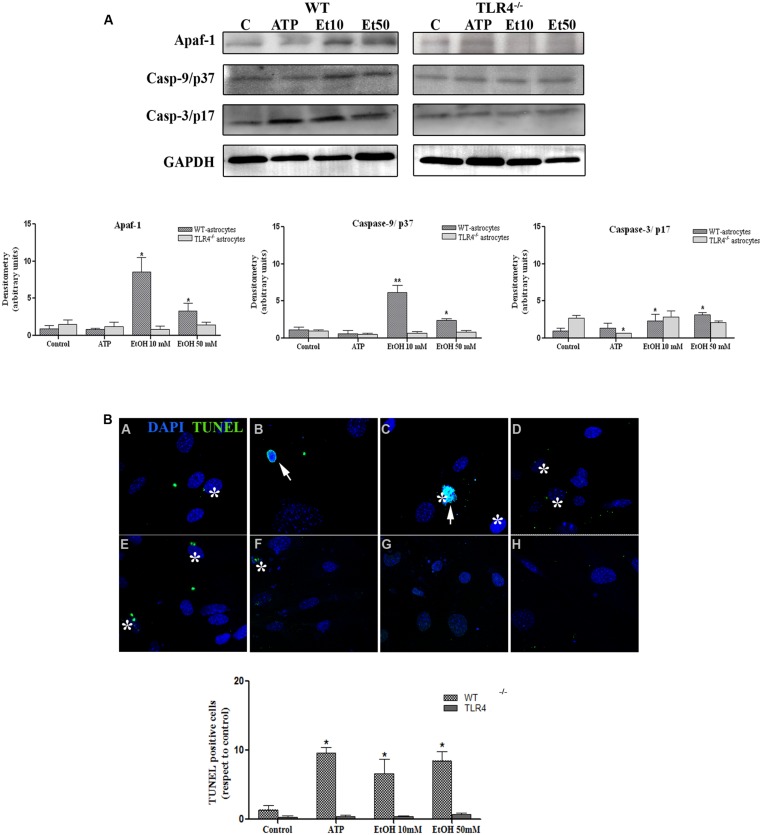
Toll-like receptors (TLRs) and NOD-like receptors (NLRs) are innate immunity sensors that provide an early/effective response to pathogenic or injury conditions. We have reported that ethanol-induced TLR4 activation triggers signaling inflammatory responses in glial cells, causing neuroinflammation and brain damage. However, it is uncertain if ethanol is able to activate NLRs/inflammasome in astroglial cells, which is the mechanism of activation, and whether there is crosstalk between both immune sensors in glial cells. Here we show that chronic ethanol treatment increases the co-localization of caspase-1 with GFAP(+) cells, and up-regulates IL-1β and IL-18 in the frontal medial cortex in WT, but not in TLR4 knockout mice. We further show that cultured cortical astrocytes expressed several inflammasomes (NLRP3, AIM2, NLRP1, and IPAF), although NLRP3 mRNA is the predominant form. Ethanol, as ATP and LPS treatments, up-regulates NLRP3 expression, and causes caspase-1 cleavage and the release of IL-1β and IL-18 in astrocytes supernatant. Ethanol-induced NLRP3/caspase-1 activation is mediated by mitochondrial (m) reactive oxygen species (ROS) generation because when using a specific mitochondria ROS scavenger, the mito-TEMPO (500 μM) or NLRP3 blocking peptide (4 μg/ml) or a specific caspase-1 inhibitor, Z-YVAD-FMK (10 μM), abrogates mROS release and reduces the up-regulation of IL-1β and IL-18 induced by ethanol or LPS or ATP. Confocal microscopy studies further confirm that ethanol, ATP or LPS promotes NLRP3/caspase-1 complex recruitment within the mitochondria to promote cell death by caspase-1-mediated pyroptosis, which accounts for ≈73% of total cell death (≈22%) and the remaining (≈25%) die by caspase-3-dependent apoptosis. Suppression of the TLR4 function abrogates most ethanol effects on NLRP3 activation and reduces cell death. These findings suggest that NLRP3 participates, in ethanol-induced neuroinflammation and highlight the NLRP3/TLR4 crosstalk in ethanol-induced brain injury.
Overview
The claims and statistics of this paper haven’t been checked yet.
Run the check — free, no account needed. It reads the open-access text and checks the sources it cites.
Integrity signals
Registry
Cites
Statistics
Figures
Verification
Claims the paper makes
The claims and statistics of this paper haven’t been checked yet.
Run the check — free, no account needed. It reads the open-access text and checks the sources it cites.
Claims other papers make about this one
Each is checked against this paper’s own text: does it say what the citing paper says it does?
The source backs part of the claim, not all of it — or backs it for a different population, condition or comparison.
In the citing paper
“Following decades of research, the most well‐characterized mechanism underlying activation of the NLRP3 inflammasome is reactive oxygen species (ROS), particularly mitochondrial ROS (mtROS), generation.”
From Trimethylamine‐N‐Oxide Induces Vascular Inflammation by Activating the NLRP3 Inflammasome Through the SIRT3‐SOD2‐mtROS Signaling Pathway (2017) · cites this paper as [15]
Experimental — accuracy not yet measuredIn the citing paper
“The majority of NLRP3 activators increase mtROS levels, and chemical scavengers of mtROS effectively inhibit NLRP3 activation.14, 15”
From Trimethylamine‐N‐Oxide Induces Vascular Inflammation by Activating the NLRP3 Inflammasome Through the SIRT3‐SOD2‐mtROS Signaling Pathway (2017) · cites this paper as [15]
Self-check
Percentages, sums and reported differences re-computed from the paper’s own numbers.
The self-check needs the paper’s full text.
Citations
Cites
A new mathematical model for relative quantification in real-time RT-PCR
Pfaffl, M. W. (2001) · Nucleic Acids Research · doi:10.1093/nar/29.9.e45 · Cited by 34,610
The Mouse Brain in Stereotaxic Coordinates
Paxinos, G. (2001) · Cited by 12,859
A role for mitochondria in nlrp3 inflammasome activation
Zhou, R., Yazdi, A. S., Menu, P., & Tschopp, J. (2011) · Nature · doi:10.1038/nature09663 · Cited by 5,602
Schroder, K., & Tschopp, J. (2010) · Cell · doi:10.1016/j.cell.2010.01.040 · Cited by 5,475
mouse brain in stereotaxic coordinates
Franklin, K. B. J., & Paxinos, G. (1997) · Cited by 3,258
Nakahira, K., Haspel, J. A., Rathinam, V. A. K., Lee, S.-J., Dolinay, T., Lam, H. C., Englert, J. A., Rabinovitch, M., Cernadas, M., Kim, H. P., et al. (2011) · Nature Immunology · doi:10.1038/ni.1980 · Cited by 3,049
NLRP3 is activated in Alzheimer’s disease and contributes to pathology in APP/PS1 mice
Heneka, M. T., Kummer, M. P., Stutz, A., Delekate, A., Schwartz, S., Vieira-Saecker, A., Griep, A., Axt, D., Remus, A., Tzeng, T.-C., et al. (2013) · Nature · doi:10.1038/nature11729 · Cited by 2,898
Activation and regulation of the inflammasomes
Latz, E., Xiao, T. S., & Stutz, A. (2013) · Nature Reviews Immunology · doi:10.1038/nri3452 · Cited by 2,884
Oxidized mitochondrial DNA activates the NLRP3 inflammasome during apoptosis
Shimada, K., Crother, T. R., Karlin, J., Dagvadorj, J., Chiba, N., Chen, S., Ramanujan, V. K., Wolf, A. J., Vergnes, L., Ojcius, D. M., et al. (2012) · Immunity · doi:10.1016/j.immuni.2012.01.009 · Cited by 2,282
NLRP3 inflammasome activation: the convergence of multiple signalling pathways on ROS production?
Tschopp, J., & Schroder, K. (2010) · Nature reviews. Immunology · doi:10.1038/nri2725 · Cited by 1,859
Cited by
Sorted by citations
Items 101–200 of 265
Elamipretide Attenuates Pyroptosis and Perioperative Neurocognitive Disorders in Aged Mice
Zuo, Y., Yin, L., Cheng, X., Li, J., Wu, H., Liu, X., Gu, E., & Wu, J. (2020) · Frontiers in Cellular Neuroscience · doi:10.3389/fncel.2020.00251 · Cited by 46
Zhao, J., Liu, Z., & Chang, Z. (2021) · European Journal of Cell Biology · doi:10.1016/j.ejcb.2021.151164 · Cited by 44
Zhang, D., Yu, W., Liu, J., Kong, L., Zhang, N., Song, Y., Li, X., Fan, Z., Lyu, Y., Li, N., et al. (2023) · Nature Communications · doi:10.1038/s41467-023-36949-4 · Cited by 47
Maysinger, D., Ji, J. X., Hutter, E., & COOPER, E. (2015) · Frontiers in Neuroscience · doi:10.3389/fnins.2015.00480 · Cited by 45
Zhu, J., Wu, S., Hu, S., Li, H., Li, M., Xu, G., & Wang, H. (2019) · Molecular Medicine Reports · doi:10.3892/mmr.2019.10382 · Cited by 45
Imran, M., Shah, F. A., Nadeem, H., Zeb, A., Faheem, M., Naz, S., Bukhari, A., Ali, T., & Li, S. (2021) · ACS Chemical Neuroscience · doi:10.1021/acschemneuro.0c00659 · Cited by 44
Liu, J., Zheng, J., Yang, X., Cao, W., Wang, J., Wang, B., Zhao, L., Zhang, X., & Liao, W. (2021) · Frontiers in Aging Neuroscience · doi:10.3389/fnagi.2021.717644 · Cited by 42
Hashimoto, M., Yamamoto, S., Iwasa, K., Yamashina, K., Ishikawa, M., Maruyama, K., Bosetti, F., & Yoshikawa, K. (2017) · Brain Research Bulletin · doi:10.1016/j.brainresbull.2017.09.007 · Cited by 41
The intrinsic and extrinsic elements regulating inflammation
Mollaei, M., Abbasi, A., Hassan, Z. M., & Pakravan, N. (2020) · Life Sciences · doi:10.1016/j.lfs.2020.118258 · Cited by 43
Immunologic aspects of migraine: A review of literature
Salahi, M., Parsa, S., Nourmohammadi, D., Razmkhah, Z., Salimi, O., Rahmani, M., Zivary, S., Askarzadeh, M., Tapak, M. A., Vaezi, A., et al. (2022) · Frontiers in Neurology · doi:10.3389/fneur.2022.944791 · Cited by 42
Pyroptosis in spinal cord injury
Yin, J., Gong, G., Wan, W., & Liu, X. (2022) · Frontiers in Cellular Neuroscience · doi:10.3389/fncel.2022.949939 · Cited by 40
Li, P., Ji, Y., Li, Y., Yan, Y., & Zhou, Y. (2024) · Cell Communication and Signaling · doi:10.1186/s12964-024-01476-2 · Cited by 40
Pyroptosis, a novel mechanism implicated in cataracts
Jin, X., Jin, H., Shi, Y., Guo, Y., & Zhang, H. (2018) · Molecular Medicine Reports · doi:10.3892/mmr.2018.9188 · Cited by 39
Virulent Mycobacterium bovis Beijing Strain Activates the NLRP7 Inflammasome in THP-1 Macrophages
Zhou, Y., Shah, S. Z. A., Yang, L., Zhang, Z., Zhou, X., & Zhao, D. (2016) · PLoS ONE · doi:10.1371/journal.pone.0152853 · Cited by 38
Filippis, L. D., Halikere, A., McGowan, H., Moore, J. C., Tischfield, J. A., Hart, R. P., & Pang, Z. P. (2016) · Molecular Brain · doi:10.1186/s13041-016-0221-7 · Cited by 38
Ye, C., Li, S., Yao, W., Xu, L., Qiu, Y., Liu, Y., Wu, Z., & Hou, Y. (2016) · Innate Immunity · doi:10.1177/1753425916631032 · Cited by 37
The emerging roles of absent in melanoma 2 (AIM2) inflammasome in central nervous system disorders
Li, Y.-K., Chen, J., & Wang, F. (2021) · Neurochemistry International · doi:10.1016/j.neuint.2021.105122 · Cited by 36
Li, H., Sun, D., Zhao, Z., Fang, J., Li, M., Lv, C., Zhou, W., Li, N., Guo, Y., Cao, Z., et al. (2024) · Journal of Nanobiotechnology · doi:10.1186/s12951-024-02753-5 · Cited by 35
Yu, S., Fu, J., Wang, J., Zhao, Y., Liu, B., Wei, J., Yan, X., & Su, J. (2021) · International Journal of Molecular Sciences · doi:10.3390/ijms23010135 · Cited by 34
Xiong, S., Song, D., Yang, X. D., Li, Y., Zhong, Y., Li, H., Zhang, P., Zhou, W., Zeng, X., & Zhang, X. (2019) · Basic & Clinical Pharmacology & Toxicology · doi:10.1111/bcpt.13306 · Cited by 33
Zheng, T., Zhao, C., Zhao, B., Liu, H., Wang, S., Wang, L., & Liu, P. (2020) · Cell Death Discovery · doi:10.1038/s41420-020-00320-z · Cited by 33
Sun, Y., Rong, X., Li, D., Jiang, Y., Lü, Y., & Ji, Y. (2020) · Biochemical and Biophysical Research Communications · doi:10.1016/j.bbrc.2020.07.028 · Cited by 33
Asatryan, L., Khoja, S., Rodgers, K. E., Alkana, R. L., Tsukamoto, H., & Davies, D. L. (2015) · Journal of Neuroimmunology · doi:10.1016/j.jneuroim.2015.06.007 · Cited by 31
Nebivolol Improves Obesity-Induced Vascular Remodeling by Suppressing NLRP3 Activation
Gao, J., Xie, Q., Wei, T., Huang, C., Zhou, W., & Shen, W. (2019) · Journal of Cardiovascular Pharmacology · doi:10.1097/fjc.0000000000000667 · Cited by 31
Wang, X., Yu, H. Q., Wang, C., Liu, Y., You, J., Wang, P., Xu, G., Shen, H., Yao, H., Lan, X., et al. (2020) · Toxicology · doi:10.1016/j.tox.2020.152625 · Cited by 31
Hypobaric hypoxia triggers pyroptosis in the retina via NLRP3 inflammasome activation
Xin, X., YANG, K. Y., Liu, H., & Li, Y. (2022) · APOPTOSIS · doi:10.1007/s10495-022-01710-7 · Cited by 31
Role of NLRP3 in Parkinson's disease: Specific activation especially in dopaminergic neurons
Yu, J., Zhao, Z., Li, Y., Chen, J., Huang, N., & Luo, Y. (2024) · Heliyon · doi:10.1016/j.heliyon.2024.e28838 · Cited by 32
Chen, H., Li, Y., Gu, J., Yin, L., Bian, F., Su, L., Hong, Y., Deng, Y., & Chi, W. (2018) · Experimental Eye Research · doi:10.1016/j.exer.2018.07.001 · Cited by 30
Fujii, C., Zorumski, C. F., & Izumi, Y. (2021) · Neuroscience & Biobehavioral Reviews · doi:10.1016/j.neubiorev.2021.01.026 · Cited by 31
Li, H., Liu, F., Jiang, W., Wang, K., Cao, X., Zou, J., Zhou, Y., Li, Z., Liu, S., Cui, X., et al. (2022) · Neurotoxicity Research · doi:10.1007/s12640-021-00459-2 · Cited by 29
Ren, L., Li, Q., Li, H., Zhan, X., Yang, R., Li, Z., Fang, Z., Liu, T., Wei, Z., Zhao, J., et al. (2022) · Phytotherapy Research · doi:10.1002/ptr.7514 · Cited by 30
Zhang, Z., Cheng, X., Li, Y., Cui, W., Zhou, W., Gao, J., & Yao, H. (2017) · Journal of Cellular Physiology · doi:10.1002/jcp.25844 · Cited by 30
NLRs as Helpline in the Brain: Mechanisms and Therapeutic Implications
Singh, S., & Jha, S. (2018) · Molecular Neurobiology · doi:10.1007/s12035-018-0957-4 · Cited by 29
Role of Inflammasomes in HIV-1 and Drug Abuse Mediated Neuroinflammaging
Sil, S., Niu, F., Chivero, E. T., Singh, S., Periyasamy, P., & Buch, S. J. (2020) · Cells · doi:10.3390/cells9081857 · Cited by 28
Vujić, T., Schvartz, D., Furlani, I. L., Meister, I., González‐Ruiz, V., Rudaz, S. L., & Sanchez, J. (2022) · Cells · doi:10.3390/cells11233926 · Cited by 28
AIM2 inflammasome: A potential therapeutic target in ischemic stroke
Fu, R., Zhao, L., Guo, Y., Qin, X., Xu, W., Cheng, X., Zhang, Y., & Xu, S. (2023) · Clinical Immunology · doi:10.1016/j.clim.2023.109881 · Cited by 28
Liu, Y., Fu, H., Wu, Y., Nie, B., Liu, F., Wang, T., Xiao, W. L., Yang, S., Kan, M., & Fan, L. (2021) · Frontiers in Aging Neuroscience · doi:10.3389/fnagi.2021.600484 · Cited by 28
Zhang, X.-Y., Han, P.-P., Zhao, Y., Shen, X.-Y., & Bi, X. (2024) · Heliyon · doi:10.1016/j.heliyon.2024.e28959 · Cited by 28
Yao, R., Cao, Y., Wang, C., Xu, L. L., Zhang, X., Deng, Y., Li, F., & Wang, S. (2021) · BMC Complementary Medicine and Therapies · doi:10.1186/s12906-021-03218-0 · Cited by 27
Ding, Y., Ye, B., Sun, Z., Mao, Z., & Wang, W. (2022) · Advanced NanoBiomed Research · doi:10.1002/anbr.202200077 · Cited by 27
An, Z., & Su, J. (2018) · Microbes and Infection · doi:10.1016/j.micinf.2018.10.005 · Cited by 27
Jiang, Z., Chen, J., Chen, J., Lei, Z., Chen, H., Wu, J., Bai, X., Wanyan, P., & Yu, Q. (2021) · Immunopharmacology and Immunotoxicology · doi:10.1080/08923973.2021.1924194 · Cited by 26
Quijano, A., Díaz-Ruiz, C., López-López, A., Villar‐Cheda, B., Muñoz, A., Rodriguez-Perez, A. I., & Labandeira-García, J. L. (2022) · Antioxidants · doi:10.3390/antiox11020329 · Cited by 26
Regulation of oxidative stress and inflammatory responses in human retinal pigment epithelial cells
Bhattarai, N. (2022) · Acta Ophthalmologica · doi:10.1111/aos.15275 · Cited by 31
Chen, Y., Wei, G., Feng, X., Lei, E., & Zhang, L. (2024) · Experimental Neurology · doi:10.1016/j.expneurol.2024.114842 · Cited by 25
The Neuroimmune Transcriptome and Alcohol Dependence: Potential for Targeted Therapies
Warden, A. S., Erickson, E. K., Robinson, G., Harris, R. A., & Mayfield, R. D. (2016) · Pharmacogenomics · doi:10.2217/pgs-2016-0062 · Cited by 29
Mito-Tempo prevents nicotine-induced exacerbation of ischemic brain damage
Li, C., Sun, H., Xu, G., McCarter, K. D., Li, J., & Mayhan, W. G. (2018) · Journal of Applied Physiology · doi:10.1152/japplphysiol.01084.2017 · Cited by 24
Yang, H., Wang, L., Yang, M., Hu, J., Zhang, E., & Peng, L. (2022) · European Journal of Pharmacology · doi:10.1016/j.ejphar.2022.174931 · Cited by 25
Paidlewar, M., Kumari, S., Dhapola, R., Sharma, P., & HariKrishnaReddy, D. (2024) · International Immunopharmacology · doi:10.1016/j.intimp.2024.112940 · Cited by 27
Amirshahrokhi, K., & Niapour, A. (2022) · International Immunopharmacology · doi:10.1016/j.intimp.2022.108638 · Cited by 25
Mohseni, F., Garmabi, B., & Khaksari, M. (2021) · Neuropeptides · doi:10.1016/j.npep.2021.102130 · Cited by 23
Picca, A., Ferri, E., Calvani, R., Coelho‐Júnior, H. J., Marzetti, E., & Arosio, B. (2022) · Nutrients · doi:10.3390/nu14122406 · Cited by 24
Is Drp1 a link between mitochondrial dysfunction and inflammation in Alzheimer’s disease?
Sbai, O., Bazzani, V., Tapaswi, S., McHale, J., Vascotto, C., & Perrone, L. (2023) · Frontiers in Molecular Neuroscience · doi:10.3389/fnmol.2023.1166879 · Cited by 24
Pyroptosis in pterygium pathogenesis
Sun, N., & Zhang, H. (2018) · Bioscience Reports · doi:10.1042/bsr20180282 · Cited by 22
Elevated Levels of NLRP3 in Cerebrospinal Fluid of Patients With Autoimmune GFAP Astrocytopathy
Luo, Y., Yan, W., Zhou, Z.-Y., Liu, B.-Z., Wang, Z., Chen, J., & Wang, H.-H. (2019) · Frontiers in Neurology · doi:10.3389/fneur.2019.01019 · Cited by 23
PM2.5 exposure inducing ATP alteration links with NLRP3 inflammasome activation
Zeng, X., Liu, D., Wu, W., & Huo, X. (2022) · Environmental Science and Pollution Research · doi:10.1007/s11356-021-16405-w · Cited by 20
Wang, D., Yuan, Q., Liu, S., Zhao, P., Chen, L., Ma, Y., Li, S., Zhu, X., Hao, X., Shi, J., et al. (2023) · Environmental Pollution · doi:10.1016/j.envpol.2023.122158 · Cited by 20
Luan, Y., Luan, Y., Jiao, Y., Liu, H., Huang, Z., Feng, Q., Pei, J., Yang, Y., & Ren, K. (2023) · Aging and Disease · doi:10.14336/ad.2023.1130 · Cited by 21
Li, C., Liu, Q., & Xie, L. (2018) · Biochemical and Biophysical Research Communications · doi:10.1016/j.bbrc.2018.10.132 · Cited by 20
Yang, M., Xu, Y., Wang, S., Xu, L., Ke, S., Ding, X., Sun, W., & Gao, J. (2019) · Europe PMC (PubMed Central) · Cited by 20
Fernández‐Rodríguez, S., Cano-Cebrián, M. J., Rius‐Pérez, S., Pérez, S., Guerri, C., Granero, L. M., Zornoza, T., & Polache, A. (2022) · Drug and Alcohol Dependence · doi:10.1016/j.drugalcdep.2022.109284 · Cited by 20
Self-citationSu, Y., Yin, X., Huang, X., Guo, Q., Ma, M., & Guo, L. (2022) · Pharmaceutical Biology · doi:10.1080/13880209.2022.2101668 · Cited by 19
Sushma, S., Mishra, S., Kanchan, S., Divakar, A., Jha, G., Sharma, D., Kapoor, R., & Rath, S. K. (2023) · Food and Chemical Toxicology · doi:10.1016/j.fct.2023.114192 · Cited by 19
Alcohol use disorder as a potential risk factor for COVID ‐19 severity: A narrative review
Forsyth, C. B., Voigt, R. M., Swanson, G. R., Bishehsari, F., Shaikh, M. W., Zhang, L., Engen, P. A., & Keshavarzian, A. (2022) · Alcoholism Clinical and Experimental Research · doi:10.1111/acer.14936 · Cited by 18
Microglial IL-1β progressively increases with duration of alcohol consumption
Pradier, B., Erxlebe, E., Markert, A., & Rácz, I. (2018) · Naunyn-Schmiedeberg s Archives of Pharmacology · doi:10.1007/s00210-018-1475-7 · Cited by 18
The Effect of Metformin on Astrocytes in Parkinson’s Disease: Challenges and Opportunities
Al-Kuraishy, H. M., Sulaiman, G. M., Saad, H. M., Mohammed, H. A., Abomughaid, M. M., Al-Gareeb, A. I., & Albuhadily, A. K. (2025) · Molecular Neurobiology · doi:10.1007/s12035-025-05098-8 · Cited by 18
Cx43 hemichannels and panx1 channels contribute to ethanol-induced astrocyte dysfunction and damage
Gómez, G. I., Alvear, T. F., Roa, D. A., Farias-Pasten, A., Vergara, S. A., Mellado, L. A., Martínez-Araya, C. J., Prieto‐Villalobos, J., García‐Rodríguez, C., Sánchez, N., et al. (2024) · Biological Research · doi:10.1186/s40659-024-00493-2 · Cited by 19
Orellana, J. A., Cerpa, W. F., Carvajal, F., Lerma-Cabrera, J. M., Karahanian, E., Osorio‐Fuentealba, C., & Quintanilla, R. A. (2017) · Frontiers in Cellular Neuroscience · doi:10.3389/fncel.2017.00090 · Cited by 17
Ameliorative effect of scutellarin on acute alcohol brain injury in mice
Zhang, T., Wang, K., Fan, H., Yang, Q., Zhang, X., Liu, F., Feng, X., Chen, Y., Teng, D., Zhao, P., et al. (2022) · Journal of Zhejiang University SCIENCE B · doi:10.1631/jzus.b2100763 · Cited by 16
Unraveling the Triad: Hypoxia, Oxidative Stress and Inflammation in Neurodegenerative Disorders
Dakal, T. C., Choudhary, K., Tiwari, I., Yadav, V., Maurya, P. K., & Sharma, N. K. (2024) · Neuroscience · doi:10.1016/j.neuroscience.2024.06.021 · Cited by 16
Nutrients and Immunometabolism: Role of Macrophage NLRP3
Larson, K., Alvine, T., Wu, D., Kalupahana, N. S., Moustaïd‐Moussa, N., & Roemmich, J. N. (2020) · Journal of Nutrition · doi:10.1093/jn/nxaa085 · Cited by 16
Tang, J., Chen, R., Wang, L., Lu, Y., Zuo, D., Cui, G., & Gong, X. (2020) · Inflammation · doi:10.1007/s10753-020-01270-5 · Cited by 16
Bhattarai, N., Piippo, N., Ranta‐aho, S., Mysore, Y., Kaarniranta, K., & Kauppinen, A. (2021) · Antioxidants · doi:10.3390/antiox10010067 · Cited by 16
Ethanol-Induced Depression: Exploring the Underlying Molecular Mechanisms
Mashayekhi‐Sardoo, H., Razazpour, F., Hakemi, Z., Hedayati‐Moghadam, M., & Baghcheghi, Y. (2025) · Cellular and Molecular Neurobiology · doi:10.1007/s10571-025-01569-7 · Cited by 17
Downregulation of ROCK2 attenuates alcohol-induced inflammation and oxidative stress in astrocytes
Li, X., Tong, J., Liu, J., & Wang, Y. (2020) · International Journal of Neuroscience · doi:10.1080/00207454.2020.1825421 · Cited by 15
Pacheco, A. D. O. L., Vicentini, G., Matteucci, K. C., Rosa‐Ribeiro, R., Weinlich, R., & Bortoluci, K. R. (2019) · Journal of Leukocyte Biology · doi:10.1002/jlb.4ab1118-416rr · Cited by 16
Zhang, T., He, M., Zhang, X. P., Li, J., & Zhang, J.-Z. (2021) · Neurochemical Research · doi:10.1007/s11064-021-03270-9 · Cited by 15
Ding, S., Liu, Y., Huang, L., Kong, L., Chen, M., Su, Y., Li, X., Dong, X., Han, Y., Li, W., et al. (2022) · Food and Chemical Toxicology · doi:10.1016/j.fct.2022.113407 · Cited by 15
Toosi, A., Shajiee, H., Khaksari, M., Vaezi, G., & Hojati, V. (2019) · Neuropeptides · doi:10.1016/j.npep.2019.01.001 · Cited by 15
Cuitavi, J., Lorente, J. D., Campos‐Jurado, Y., Polache, A., & Hipólito, L. (2021) · Frontiers in Immunology · doi:10.3389/fimmu.2021.689453 · Cited by 13
Wang, L., Liu, X., Zhou, X., Gao, F., Li, X., & Wang, X. (2022) · Journal of Cardiovascular Translational Research · doi:10.1007/s12265-022-10340-y · Cited by 14
Holloway, K. N., Douglas, J. C., Rafferty, T. M., Majewska, A. K., Kane, C. J. M., & Drew, P. D. (2023) · Frontiers in Neuroscience · doi:10.3389/fnins.2023.1154637 · Cited by 12
Kannan, S. R., Laxmi, I. P. L., Ahmad, S. F., & Tamizhselvi, R. (2024) · Toxicology · doi:10.1016/j.tox.2024.153876 · Cited by 14
Singh, S., Kannan, M., Oladapo, A., Deshetty, U. M., Ray, S., Buch, S. J., & Periyasamy, P. (2024) · Free Radical Biology and Medicine · doi:10.1016/j.freeradbiomed.2024.11.014 · Cited by 15
Zhang, D., Liu, X., Dong, X., Zhu, R., Jiang, J., Ye, Y., & Jiang, Y. (2020) · Alcoholism Clinical and Experimental Research · doi:10.1111/acer.14391 · Cited by 14
Pan, L., Ren, Z., Liu, Y., Zhao, Y., Li, H., Pan, X., Fang, X., Liang, W., Wang, Y., Yang, J., et al. (2020) · Journal of Cellular and Molecular Medicine · doi:10.1111/jcmm.15890 · Cited by 13
Shan, W., Wang, J., Cheng, R., Xuan, Y., & Yin, Z. (2023) · Inflammopharmacology · doi:10.1007/s10787-023-01311-z · Cited by 13
Manganese induces neuroinflammation via NF-κB/ROS NLRP3 pathway in rat brain striatum and HAPI cells
Zhao, X., Yin, L., Wu, Y., Han, M., Zhuang, Y., Cong, Y., Liu, Y., Chen, G., & Jiang, J. (2019) · Molecular & Cellular Toxicology · doi:10.1007/s13273-019-0021-0 · Cited by 13
Xu, E., Liu, J., Wang, X., & Xiong, H. (2017) · PubMed Central · Cited by 12
Research Advances of Mitochondrial Dysfunction in Perioperative Neurocognitive Disorders
Chen, M., Yan, R., Ding, L., Luo, J.-S., Ning, J., & Zhou, R. (2023) · Neurochemical Research · doi:10.1007/s11064-023-03962-4 · Cited by 13
Munshi, S., Albrechet‐Souza, L., Dos‐Santos, R. C., Stelly, C. E., Secci, M. E., Gilpin, N. W., & Tasker, J. G. (2023) · Journal of Neuroscience · doi:10.1523/jneurosci.1744-22.2023 · Cited by 12
Liu, J., Liu, H., Tang, H., Ran, L., Wang, D., Yang, F., Zhang, H., Teng, X., & Chen, D. (2024) · Environmental Pollution · doi:10.1016/j.envpol.2024.124923 · Cited by 12
Chen, N., Wang, Y., Hui-fang, S., Wang, Z., Zhang, Q., Fan, F., Ma, Y., Liu, F.-X., & Zhang, Y. (2023) · World Journal of Stem Cells · doi:10.4252/wjsc.v15.i6.561 · Cited by 12
Role of neuroinflammation in ethanol neurotoxicity
Guerri, C., & Pascual, M. (2018) · Advances in neurotoxicology · doi:10.1016/bs.ant.2018.10.009 · Cited by 12
Self-citationMasson, J.-D., Badran, G., Domdom, M. A., Gherardi, R. K., Mograbi, B., Authier, F., & Crépeaux, G. (2023) · Scientific Reports · doi:10.1038/s41598-023-30336-1 · Cited by 12
Wang, X., Chen, J., Wang, H., Yu, H. Q., Wang, C., You, J., Wang, P., Feng, C.-M., Xu, G., Wu, X., et al. (2017) · Journal of Molecular Neuroscience · doi:10.1007/s12031-017-0948-3 · Cited by 11
Scarnati, M. S., Halikere, A., & Pang, Z. P. (2018) · Alcohol · doi:10.1016/j.alcohol.2018.03.008 · Cited by 11
MiR‐599 Protects Cardiomyocytes against Oxidative Stress‐Induced Pyroptosis
Fan, X., Zhan, E., Yao, Y., Zhang, R., Sun, Y., & Tian, X. (2021) · BioMed Research International · doi:10.1155/2021/3287053 · Cited by 10
“Other Than NLRP3” Inflammasomes: Multiple Roles in Brain Disease
Chiarini, A., Armato, U., Gui, L., & Prà, I. D. (2022) · The Neuroscientist · doi:10.1177/10738584221106114 · Cited by 10
Fernández‐Rodríguez, S., Cano-Cebrián, M. J., Esposito-Zapero, C., Pérez, S., Guerri, C., Zornoza, T., & Polache, A. (2023) · Psychopharmacology · doi:10.1007/s00213-023-06311-z · Cited by 11
Self-citation
Metadata
- Authors
- Alfonso-Loeches, S., Ureña-Peralta, J. R., Morillo-Bargues, M. J., Oliver-De La Cruz, J., & Guerri, C.
- Affiliations
- Centro de Investigacion Principe Felipe (ES)
- Corresponding author
- Guerri, Consuelo
- ORCID
- Guerri, Consuelo
- Venue
- Frontiers in Cellular Neuroscience
- Publisher
- Frontiers Media SA
- Published
- 2014-08-01
- Volume
- 8
- Pages
- 216-216
- ISSN
- 1662-5102 (ISSN-L)
- PMC
- PMC4118026
- OpenAlex
- W2081653529
- Cited by
- 265
- References
- 61
- Citations by year
- 2026: 11 · 2025: 19 · 2024: 21 · 2023: 22 · 2022: 33 · 2021: 33 · 2020: 27 · 2019: 24 · 2018: 22 · 2017: 22 · 2016: 21 · 2015: 8 · 2014: 2
- FWCI
- 7.25
- Type
- journal article
- Language
- en
- Open access
- gold
- doi.org
- Licence
- cc-by
- Locations
- Frontiers in Cellular Neuroscience (publishedVersion, cc-by)
- Europe PMC (PubMed Central) (publishedVersion, cc-by)
- PubMed Central (publishedVersion, cc-by)
- PubMed (publishedVersion)
- DOAJ (DOAJ: Directory of Open Access Journals) (submittedVersion, cc-by-sa)
- Funders
- Ministerio de Economía y Competitividad
- Ministerio de Ciencia e Innovación
- Topics
- Life Sciences › Biochemistry, Genetics and Molecular Biology › Molecular Biology › Inflammasome and immune disorders
- Life Sciences › Neuroscience › Neurology › Neuroinflammation and Neurodegeneration Mechanisms
- Life Sciences › Immunology and Microbiology › Immunology › Immune Response and Inflammation
- Keywords
- ethanol, NLRP3 inflammasome, reactive oxygen species, mitochondria, astrocytes, caspase-1, pyroptosis, TLR4, neuroinflammation, IL-1β, IL-18, innate immunity, brain injury, apoptosis, LPS, ATP
About these checks
Registry, retraction, Cites and statistics results are computed, not judged, with one exception: a printed reference that no index lists is read once by a model before it counts as a citation error. Claims are extracted by a model and kept only when their quote appears verbatim in the text; each cited source is then checked, with a model’s help, for whether it says what the claim relies on. Those verdicts can be wrong — read the claim’s quote and the cited source before relying on one.
Statistics and arithmetic are recomputed, not judged.
Confidence bands are shown only for fields calibrated on our annotated test set. None is calibrated yet, so no band is shown.
What counts as a claim ›How we measure confidence ›How we check this ›
Are you an author, or do you see a problem with this page? Request a review
