

The DOI matches its Crossref record; 59 of the 59 references it cites were found in a registry or an index.
The endosomal-lysosomal pathway is dysregulated by APOE4 expression in vivo
Open accessAbstract
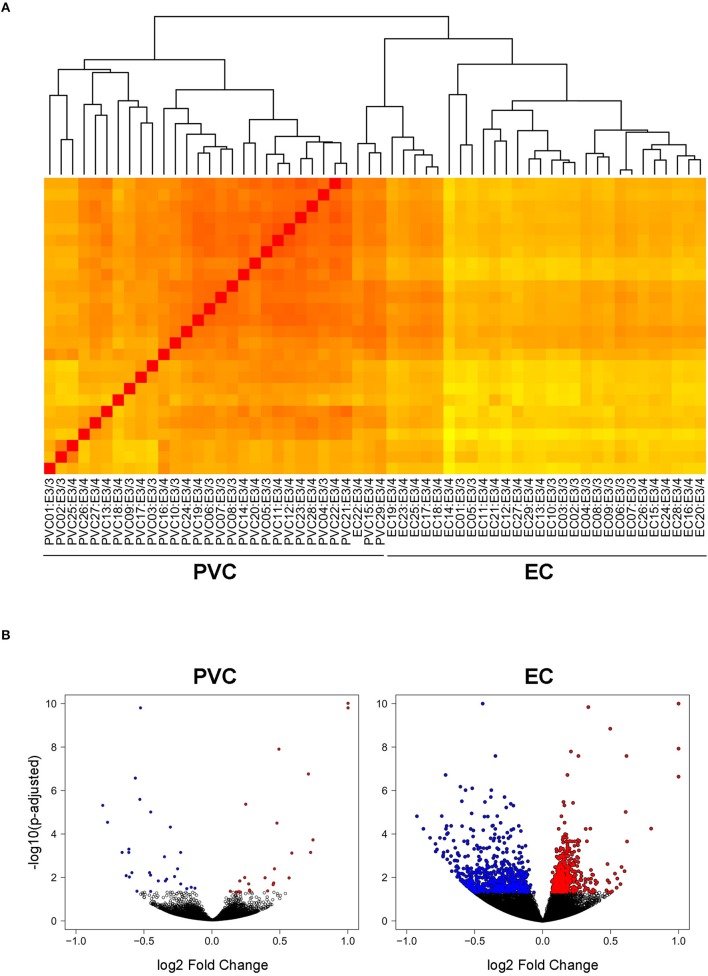
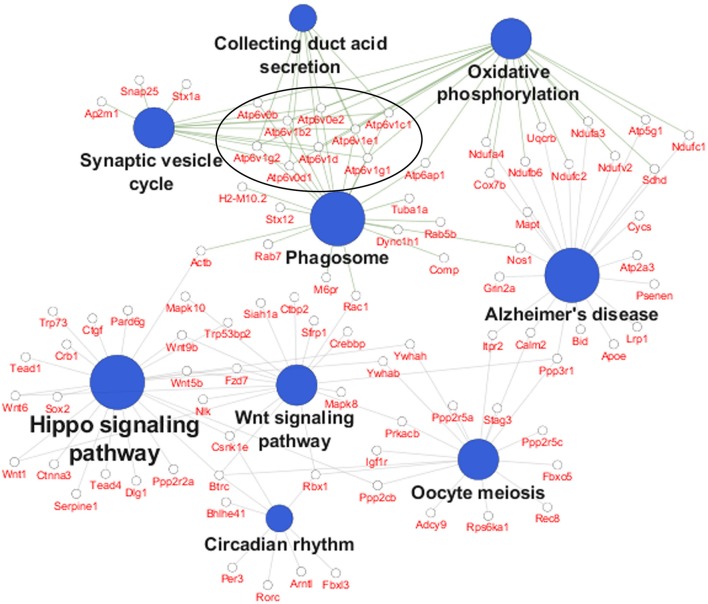
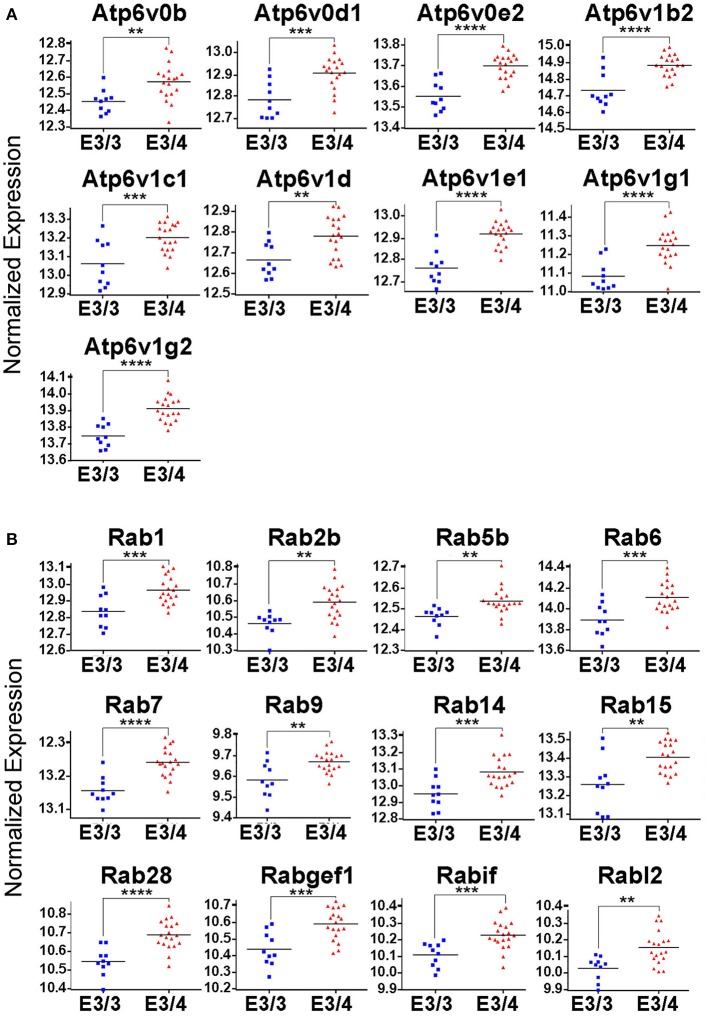
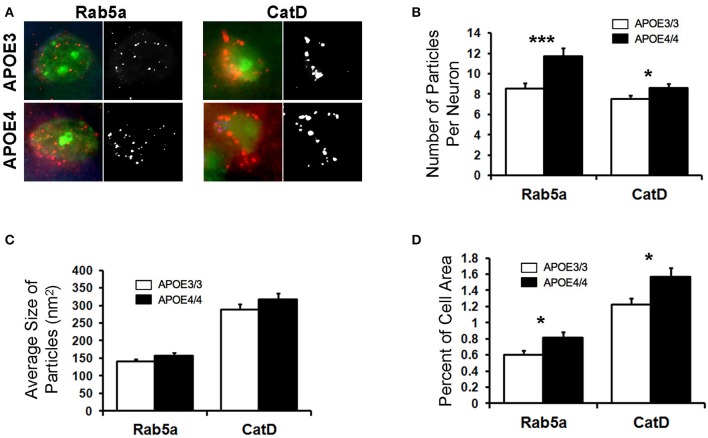
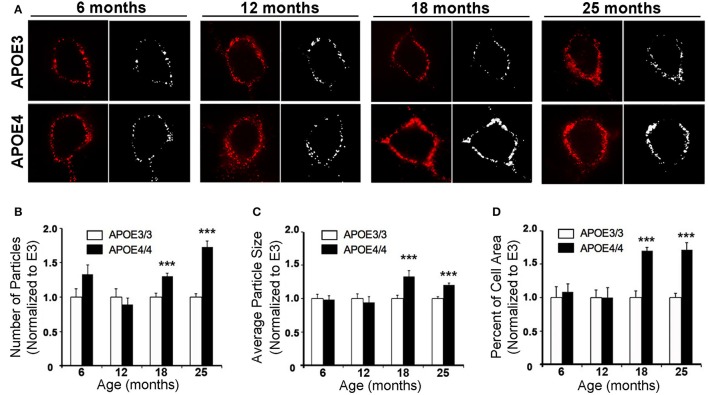
Possession of the ε4 allele of apolipoprotein E (APOE) is the major genetic risk factor for late-onset Alzheimer’s disease (AD). Although numerous hypotheses have been proposed, the precise cause of this increased AD risk is not yet known. In order to gain a more comprehensive understanding of APOE4's role in AD, we performed RNA-sequencing on an AD-vulnerable vs. an AD-resistant brain region from aged APOE targeted replacement mice. This transcriptomics analysis revealed a significant enrichment of genes involved in endosomal-lysosomal processing, suggesting an APOE4-specific endosomal-lysosomal pathway dysregulation in the brains of APOE4 mice. Further analysis revealed clear differences in the morphology of endosomal-lysosomal compartments, including an age-dependent increase in the number and size of early endosomes in APOE4 mice. These findings directly link the APOE4 genotype to endosomal-lysosomal dysregulation in an in vivo, AD pathology-free setting, which may play a causative role in the increased incidence of AD among APOE4 carriers.
Overview
The claims and statistics of this paper haven’t been checked yet.
Run the check — free, no account needed. It reads the open-access text and checks the sources it cites.
Integrity signals
Registry
Cites
Statistics
Figures
Verification
Claims the paper makes
The claims and statistics of this paper haven’t been checked yet.
Run the check — free, no account needed. It reads the open-access text and checks the sources it cites.
Claims other papers make about this one
Each is checked against this paper’s own text: does it say what the citing paper says it does?
The source backs part of the claim, not all of it — or backs it for a different population, condition or comparison.
In the citing paper
“APOE4-bound cholesterol, taken up by the cell, is released from the receptor in the late endosome or lysosome, and aggregation of APOE4 has been shown to cause endosomal congestion and dysfunction (Narayan et al., 2020; Nuriel et al., 2017; Rawat et al., 2019).”
From APOE2, E3, and E4 differentially modulate cellular homeostasis, cholesterol metabolism, and inflammatory response in isogenic iPSC-derived astrocytes (2022) · cites this paper as Nuriel et al., 2017
Experimental — accuracy not yet measuredThe source backs part of the claim, not all of it — or backs it for a different population, condition or comparison.
In the citing paper
“Endolysosomal dysfunction is also prominent in glia expressing ApoE4 as well as in neurons treated with ApoE4 particles 10,14,15 .”
From ApoE4 impairs astrocyte lipid droplet formation via endolysosomal dysfunction (2026) · cites this paper as [15]
Experimental — accuracy not yet measuredThe cited source says what the claim attributes to it.
In the citing paper
“As the endosomal-lysosomal dysregulation that we observed in the brains of aged APOE4 mice was not restricted to the EC30”
From APOE4 is Associated with Differential Regional Vulnerability to Bioenergetic Deficits in Aged APOE Mice (2020) · cites this paper as [30]
The cited source says what the claim attributes to it.
In the citing paper
“APOE4 affects, however, the endosomal-lysosomal pathway (Nuriel et al, 2017) and the APOE4 induced recycling block can be rescued by decreasing pH (Xian et al, 2018).”
From APOE from astrocytes restores Alzheimer’s Aβ-pathology and DAM-like responses in APOE deficient microglia (2024) · cites this paper as Nuriel et al, 2017
The cited source says what the claim attributes to it.
In the citing paper
“Endosomal dysfunction is an early event in carriers of the APOE4 allele appearing in human brains decades before the onset of AD symptoms, and is also observed in ApoE4-TR mouse brain sections (Cataldo et al., 2000;Nuriel et al., 2017).”
From ApoE4 Alters ABCA1 Membrane Trafficking in Astrocytes (2019) · cites this paper as Nuriel et al., 2017
In the citing paper
“Dysregulation of endolysosomal trafficking by ApoE4 causes an age-dependent increase in EE number and size (Nuriel et al., 2017).”
From NHE6 depletion corrects ApoE4-mediated synaptic impairments and reduces amyloid plaque load (2021) · cites this paper as Nuriel et al., 2017
Self-check
Percentages, sums and reported differences re-computed from the paper’s own numbers.
The self-check needs the paper’s full text.
Citations
Cites
Neuropathological stageing of Alzheimer-related changes.
Braak, H., & Braak, E. (1991) · Acta Neuropathologica · doi:10.1007/bf00308809 · Cited by 16,123
Restriction isotyping of human apolipoprotein E by gene amplification and cleavage with HhaI.
Hixson, J., & Vernier, D. (1990) · Journal of Lipid Research · doi:10.1016/s0022-2275(20)43176-1 · Cited by 2,933
The role of the posterior cingulate cortex in cognition and disease
Leech, R., & Sharp, D. J. (2014) · Brain · doi:10.1093/brain/awt162 · Cited by 2,247
Apolipoprotein E: Far More Than a Lipid Transport Protein
Mahley, R. W., & Rall, S. C. (2000) · Annual Review of Genomics and Human Genetics · doi:10.1146/annurev.genom.1.1.507 · Cited by 1,836
Metabolic reduction in the posterior cingulate cortex in very early Alzheimer's disease
Minoshima, S., Giordani, B., Berent, S., Frey, K. A., Foster, N. L., & Kuhl, D. E. (1997) · Annals of Neurology · doi:10.1002/ana.410420114 · Cited by 1,802
Schmechel, D. E., Saunders, A. M., Strittmatter, W. J., Crain, B. J., Hulette, C. M., Joo, S. H., Pericak-Vance, M. A., Goldgaber, D., & Roses, A. D. (1993) · Proceedings of the National Academy of Sciences · doi:10.1073/pnas.90.20.9649 · Cited by 1,525
Reiman, E. M., Caselli, R. J., Yun, L. S., Chen, K., Bandy, D., Minoshima, S., Thibodeau, S. N., & Osborne, D. (1996) · New England Journal of Medicine · doi:10.1056/nejm199603213341202 · Cited by 1,366
Human ApoE isoforms differentially regulate brain amyloid-β peptide clearance
Castellano, J. M., Kim, J., Stewart, F. R., Jiang, H., DeMattos, R. B., Patterson, B. W., Fagan, A. M., Morris, J. C., Mawuenyega, K. G., Cruchaga, C., et al. (2011) · Science Translational Medicine · doi:10.1126/scitranslmed.3002156 · Cited by 1,242 · cited 2×
“While APOE4’s role in AD has often been attributed to its ability to increase the aggregation and decrease the clearance of Aβ (Rebeck et al., 1993; Schmechel et al., 1993; Ma et al., 1994; Castano et al., 1995; Bales et al., 1997; Holtzman et al., 2000; Castellano et al., 2011), APOE4 expression has also been shown t…”
BackgroundAmyloid Precursor Protein Trafficking, Processing, and Function
Thinakaran, G., & Koo, E. H. (2008) · Journal of Biological Chemistry · doi:10.1074/jbc.r800019200 · Cited by 1,141
Apolipoprotein E in sporadic Alzheimer's disease: Allelic variation and receptor interactions
William Rebeck, G., Reiter, J. S., Strickland, D. K., & Hyman, B. T. (1993) · Neuron · doi:10.1016/0896-6273(93)90070-8 · Cited by 1,107
Cited by
Sorted by citations
Apolipoprotein E and Alzheimer disease: pathobiology and targeting strategies
Yamazaki, Y., Zhao, N., Caulfield, T. R., Liu, C.-C., & Bu, G. (2019) · Nature Reviews Neurology · doi:10.1038/s41582-019-0228-7 · Cited by 1,425
Antonarakis, S. E., Skotko, B. G., Rafii, M. S., Strydom, A., Pape, S. E., Bianchi, D. W., Sherman, S. L., & Reeves, R. H. (2020) · Nature Reviews Disease Primers · doi:10.1038/s41572-019-0143-7 · Cited by 964
Amyloid-β-independent regulators of tau pathology in Alzheimer disease
van der Kant, R., Goldstein, L. S. B., & Ossenkoppele, R. (2020) · Nature reviews. Neuroscience · doi:10.1038/s41583-019-0240-3 · Cited by 580
ApoE4: an emerging therapeutic target for Alzheimer’s disease
Safieh, M., Korczyn, A. D., & Michaelson, D. M. (2019) · BMC Medicine · doi:10.1186/s12916-019-1299-4 · Cited by 449
Hypothesis: Tau pathology is an initiating factor in sporadic Alzheimer's disease
Arnsten, A. F. T., Datta, D., Del Tredici, K., & Braak, H. (2021) · Alzheimer's & Dementia · doi:10.1002/alz.12192 · Cited by 361
Metadata
- Authors
- Nuriel, T., Peng, K. Y., Ashok, A., Dillman, A. A., Figueroa, H. Y., Apuzzo, J., Ambat, J., Levy, E., Cookson, M. R., Mathews, P. M., & Duff, K. E.
- Affiliations
- Columbia University Irving Medical Center (US)
- NYU Langone Health (US)
- National Institutes of Health (US)
- Nathan Kline Institute for Psychiatric Research (US)
- Corresponding author
- Mathews, Paul M.
- Duff, Karen E.
- ORCID
- Venue
- Frontiers in Neuroscience
- Publisher
- Frontiers Media SA
- Published
- 2017-12-12
- Volume
- 11
- Pages
- 702-702
- ISSN
- 1662-453X (ISSN-L)
- PMC
- PMC5733017
- OpenAlex
- W2775642640
- Cited by
- 140
- References
- 59
- Citations by year
- 2026: 10 · 2025: 17 · 2024: 16 · 2023: 15 · 2022: 19 · 2021: 21 · 2020: 23 · 2019: 17 · 2018: 2
- FWCI
- 8.50
- Type
- journal article
- Language
- en
- Open access
- gold
- doi.org
- Licence
- cc-by
- Locations
- Frontiers in Neuroscience (publishedVersion, cc-by)
- Europe PMC (PubMed Central) (publishedVersion, cc-by)
- PubMed Central (publishedVersion, cc-by)
- PubMed (publishedVersion)
- DOAJ (DOAJ: Directory of Open Access Journals) (submittedVersion, cc-by-sa)
- Funders
- National Institute on Aging (AG048408, AG047797, AG017617)
- National Institute of Neurological Disorders and Stroke (NS071836)
- BrightFocus Foundation (A2014200F)
- Cure Alzheimer's Fund
- Topics
- Life Sciences › Neuroscience › Cellular and Molecular Neuroscience › Alzheimer's disease research and treatments
- Life Sciences › Biochemistry, Genetics and Molecular Biology › Cell Biology › Cellular transport and secretion
- Life Sciences › Biochemistry, Genetics and Molecular Biology › Cell Biology › Autophagy in Disease and Therapy
- Keywords
- APOE ε4, apolipoprotein E, endolysosomal pathway, Alzheimer's disease, late-onset Alzheimer's disease, early endosomes, lysosomal dysfunction, genetic risk factors, transcriptomics
About these checks
Registry, retraction, Cites and statistics results are computed, not judged, with one exception: a printed reference that no index lists is read once by a model before it counts as a citation error. Claims are extracted by a model and kept only when their quote appears verbatim in the text; each cited source is then checked, with a model’s help, for whether it says what the claim relies on. Those verdicts can be wrong — read the claim’s quote and the cited source before relying on one.
Statistics and arithmetic are recomputed, not judged.
Confidence bands are shown only for fields calibrated on our annotated test set. None is calibrated yet, so no band is shown.
What counts as a claim ›How we measure confidence ›How we check this ›
Are you an author, or do you see a problem with this page? Request a review
