

The DOI matches its Crossref record; 63 of the 63 references it cites were found in a registry or an index.
Synaptic Tau Seeding Precedes Tau Pathology in Human Alzheimer’s Disease Brain
Open accessAbstract
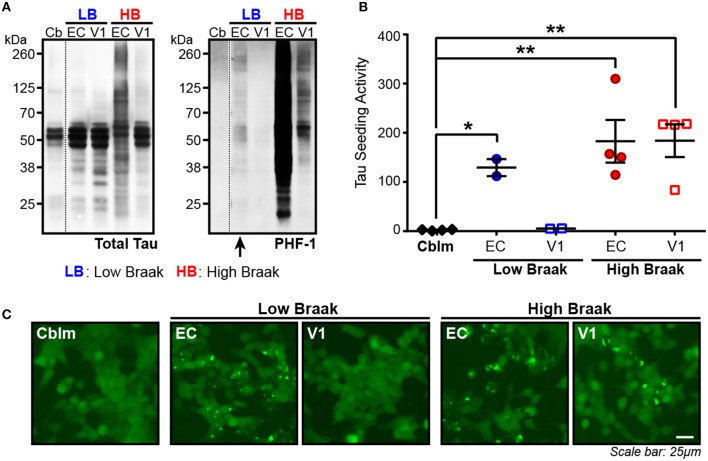
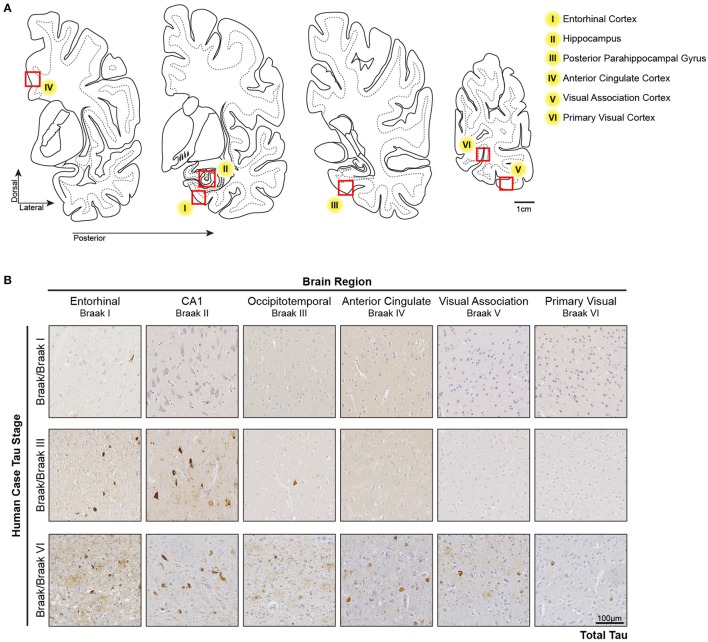
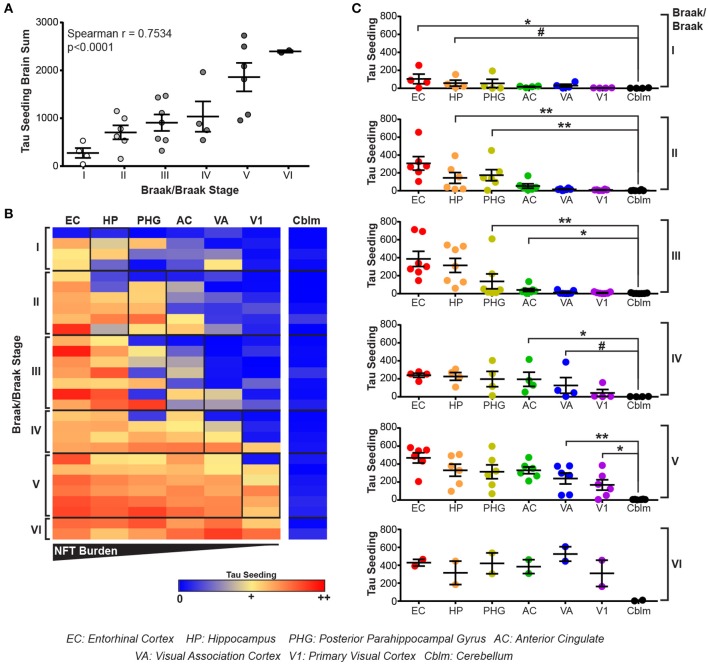
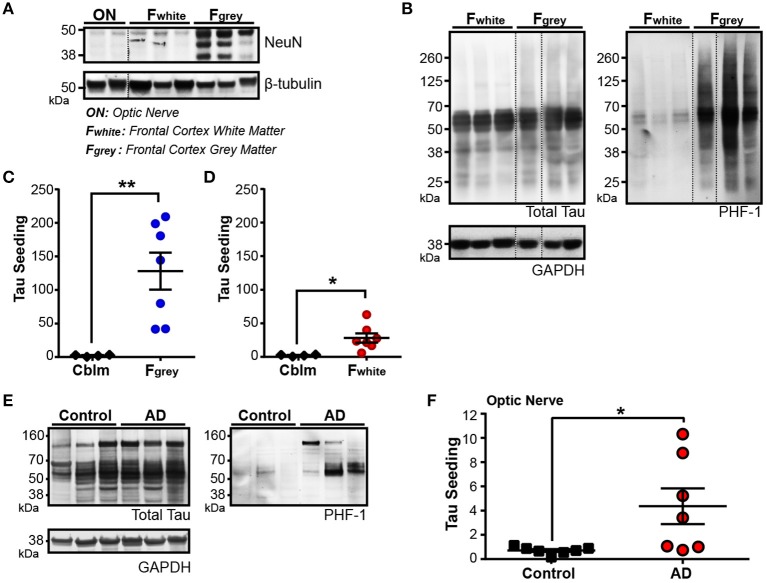
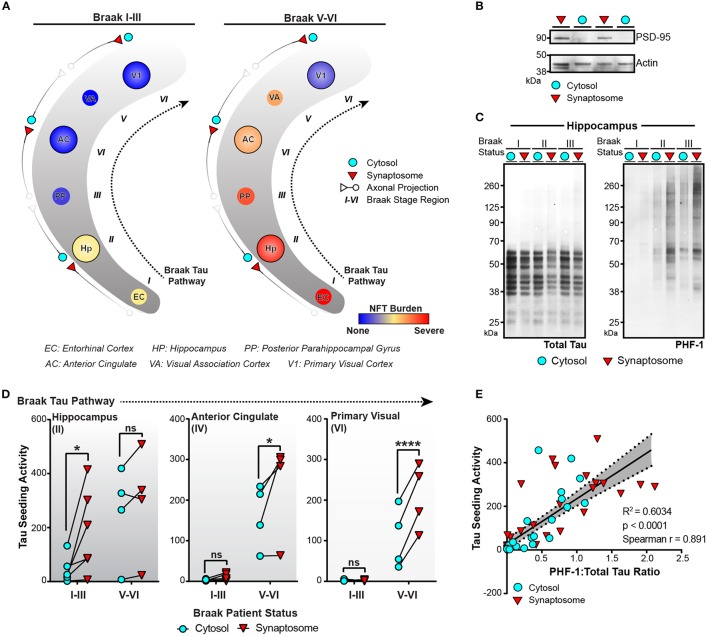
Alzheimer’s disease (AD) is defined by the presence of intraneuronal neurofibrillary tangles (NFTs) composed of hyperphosphorylated tau aggregates and extracellular amyloid-beta plaques. The presence and spread of tau pathology through the brain is classified by Braak stages and thought to correlate to the progression of AD. Several in vitro and in vivo studies have examined tau pathology moving from one neuron to the next, suggesting a “prion-like” spread of tau aggregates may be an underlying cause of Braak tau staging in AD. Using the HEK293 TauRD-P301S-CFP/YFP expressing biosensor cells as a highly sensitive and specific tool to identify the presence of seed competent aggregated tau in brain lysate – ie., tau aggregates that are capable of recruiting and misfolding monomeric tau – , we detected substantial tau seeding levels in the entorhinal cortex from human cases with only very rare NFTs, suggesting that soluble tau aggregates can exist prior to the development of overt tau pathology. We next looked at tau seeding levels in human brains of varying Braak stages along six regions of the Braak Tau Pathway. Tau seeding levels were detected not only in the brain regions impacted by pathology, but also in the subsequent non-pathology containing region along the Braak pathway. These data imply that pathogenic tau aggregates precede overt tau pathology in a manner that is consistent with transneuronal spread of tau aggregates. We then detected tau seeding in frontal white matter tracts and the optic nerve, two brain regions comprised of axons that contain little to no neuronal cell bodies, implying that tau aggregates can indeed traverse along axons. Finally, we isolated cytosolic and synaptosome fractions along the Braak Tau Pathway from brains of varying Braak stages. Phosphorylated and seed competent tau was significantly enriched in the synaptic fraction of brain regions that did not have extensive cellular tau pathology, further suggesting that aggregated tau seeds move through the human brain along synaptically connected neurons. Together, these data provide further evidence that the spread of tau aggregates through the human brain along synaptically connected networks results in the pathogenesis of human AD.
Overview
The claims and statistics of this paper haven’t been checked yet.
Run the check — free, no account needed. It reads the open-access text and checks the sources it cites.
Integrity signals
Registry
Cites
Statistics
Figures
Verification
Claims the paper makes
The claims and statistics of this paper haven’t been checked yet.
Run the check — free, no account needed. It reads the open-access text and checks the sources it cites.
Claims other papers make about this one
Each is checked against this paper’s own text: does it say what the citing paper says it does?
The source backs part of the claim, not all of it — or backs it for a different population, condition or comparison.
In the citing paper
“The progression of tau pathology has been correlated with memory dysfunction and cognitive impairments in AD (DeVos et al., 2018; Giannakopoulos et al., 2003).”
From Cholesterol 25-hydroxylase mediates neuroinflammation and neurodegeneration in a mouse model of tauopathy (2024) · cites this paper as DeVos et al., 2018
Experimental — accuracy not yet measuredThe cited source says what the claim attributes to it.
In the citing paper
“Several studies have shown that seeding precedes tau pathogenesis and can even occur in brain regions where tau pathology does not usually present (DeVos et al., 2018; Kaufman et al., 2018; Stopschinski et al., 2021).”
From Network analysis identifies strain-dependent response to tau and tau seeding-associated genes (2023) · cites this paper as DeVos et al., 2018
In the citing paper
“Thus, prion-like seeding and spreading may represent a mechanism whereby tau pathology propagates from the entorhinal cortex to the neocortex in AD”
From Alzheimer Disease: An Update on Pathobiology and Treatment Strategies (2019) · cites this paper as DeVos et al., 2018
Self-check
Percentages, sums and reported differences re-computed from the paper’s own numbers.
The self-check needs the paper’s full text.
Citations
Cites
Neuropathological stageing of Alzheimer-related changes.
Braak, H., & Braak, E. (1991) · Acta Neuropathologica · doi:10.1007/bf00308809 · Cited by 16,123 · cited 3×
“…disease (Morris et al., 1989), (2) the distribution of beta amyloid plaques (Thal score) (Thal et al., 2002), and (3) the Braak tau stage based on the location of neurofibrillary tau tangles as determined by a total tau immunostaining and Bielchowsky’s silver stain (Braak and Braak, 1991).”
BackgroundOverdependence on degraded gist memory in Alzheimer's disease.
Gallo, D. A., Shahid, K. R., Olson, M. A., Solomon, T. M., Schacter, D. L., & Budson, A. E. (2006) · Neuropsychology · doi:10.1037/0894-4105.20.6.625 · Cited by 4,757
Imaging brain amyloid in Alzheimer's disease with Pittsburgh Compound‐B
Klunk, W. E., Engler, H., Nordberg, A., Wang, Y., Blomqvist, G., Holt, D. P., Bergström, M., Savitcheva, I., Huang, G., Estrada, S., et al. (2004) · Annals of Neurology · doi:10.1002/ana.20009 · Cited by 4,496
Moms, J. C., Heyman, A., Mohs, R. C., Hughes, J. P., van Belle, G., Fillenbaum, G., Mellits, E. D., & Clark, C. (1989) · Neurology · doi:10.1212/wnl.39.9.1159 · Cited by 4,130
Phases of Aβ-deposition in the human brain and its relevance for the development of AD
Thal, D. R., Rüb, U., Orantes, M., & Braak, H. (2002) · Neurology · doi:10.1212/wnl.58.12.1791 · Cited by 3,490
Hyman, B. T., Phelps, C. H., Beach, T. G., Bigio, E. H., Cairns, N. J., Carrillo, M. C., Dickson, D. W., Duyckaerts, C., Frosch, M. P., Masliah, E., et al. (2012) · Alzheimer's & Dementia · doi:10.1016/j.jalz.2011.10.007 · Cited by 3,092
Self-citationNeurofibrillary tangles but not senile plaques parallel duration and severity of Alzheimer's disease
Arriagada, P. V., Growdon, J. H., Hedley-Whyte, E. T., & Hyman, B. T. (1992) · Neurology · doi:10.1212/wnl.42.3.631 · Cited by 2,668
Self-citationAlzheimer's disease: cell-specific pathology isolates the hippocampal formation.
Hyman, B. T., Van Hoesen, G. W., Damasio, A. R., & Barnes, C. L. (1984) · Science · doi:10.1126/science.6474172 · Cited by 2,268
Self-citationSynapse Loss and Microglial Activation Precede Tangles in a P301S Tauopathy Mouse Model
Yoshiyama, Y., Higuchi, M., Zhang, B., Huang, S.-M., Iwata, N., Saido, T. C., Maeda, J., Suhara, T., Trojanowski, J. Q., & Lee, V. M.-Y. (2007) · Neuron · doi:10.1016/j.neuron.2007.01.010 · Cited by 2,208
Transmission and spreading of tauopathy in transgenic mouse brain
Clavaguera, F., Bolmont, T., Crowther, R. A., Abramowski, D., Frank, S., Probst, A., Fraser, G., Stalder, A. K., Beibel, M., Staufenbiel, M., et al. (2009) · Nature Cell Biology · doi:10.1038/ncb1901 · Cited by 1,803
Propagation of Tau Pathology in a Model of Early Alzheimer's Disease
de Calignon, A., Polydoro, M., Suárez-Calvet, M., William, C., Adamowicz, D. H., Kopeikina, K. J., Pitstick, R., Sahara, N., Ashe, K. H., Carlson, G. A., et al. (2012) · Neuron · doi:10.1016/j.neuron.2011.11.033 · Cited by 1,427
Self-citationPropagation of Tau Misfolding from the Outside to the Inside of a Cell
Frost, B., Jacks, R. L., & Diamond, M. I. (2009) · Journal of Biological Chemistry · doi:10.1074/jbc.m808759200 · Cited by 1,252
PET Imaging of Tau Deposition in the Aging Human Brain
Schöll, M., Lockhart, S. N., Schonhaut, D. R., O’Neil, J. P., Janabi, M., Ossenkoppele, R., Baker, S. L., Vogel, J. W., Faria, J., Schwimmer, H. D., et al. (2016) · Neuron · doi:10.1016/j.neuron.2016.01.028 · Cited by 1,214
The Intersection of Amyloid Beta and Tau at Synapses in Alzheimer’s Disease
Spires-Jones, T. L., & Hyman, B. T. (2014) · Neuron · doi:10.1016/j.neuron.2014.05.004 · Cited by 1,201
Self-citationTau PET patterns mirror clinical and neuroanatomical variability in Alzheimer’s disease
Ossenkoppele, R., Schonhaut, D. R., Schöll, M., Lockhart, S. N., Ayakta, N., Baker, S. L., O’Neil, J. P., Janabi, M., Lazaris, A., Cantwell, A., et al. (2016) · Brain · doi:10.1093/brain/aww027 · Cited by 1,185
Trans-Synaptic Spread of Tau Pathology In Vivo
Liu, L., Drouet, V., Wu, J., Witter, M. P., Small, S. A., Clelland, C. L. T., & Duff, K. (2012) · PLoS ONE · doi:10.1371/journal.pone.0031302 · Cited by 994
Distinct Tau Prion Strains Propagate in Cells and Mice and Define Different Tauopathies
Sanders, D. W., Kaufman, S. K., DeVos, S. L., Sharma, A. M., Mirbaha, H., Li, A., Barker, S. J., Foley, A. C., Thorpe, J. R., Serpell, L. C., et al. (2014) · Neuron · doi:10.1016/j.neuron.2014.04.047 · Cited by 986
Self-citationHeparan sulfate proteoglycans mediate internalization and propagation of specific proteopathic seeds
Holmes, B. B., DeVos, S. L., Kfoury, N., Li, M., Jacks, R., Yanamandra, K., Ouidja, M. O., Brodsky, F. M., Marasa, J., Bagchi, D. P., et al. (2013) · Proceedings of the National Academy of Sciences · doi:10.1073/pnas.1301440110 · Cited by 859
Self-citationSynaptic alterations in CA1 in mild Alzheimer disease and mild cognitive impairment
Scheff, S. W., Price, D. A., Schmitt, F. A., DeKosky, S. T., & Mufson, E. J. (2007) · Neurology · doi:10.1212/01.wnl.0000260698.46517.8f · Cited by 824
Brain homogenates from human tauopathies induce tau inclusions in mouse brain
Clavaguera, F., Akatsu, H., Fraser, G. M., Crowther, R. A., Frank, S., Hench, J., Probst, A., Winkler, D. T., Reichwald, J., Staufenbiel, M., et al. (2013) · Proceedings of the National Academy of Sciences · doi:10.1073/pnas.1301175110 · Cited by 792
Predicting Regional Neurodegeneration from the Healthy Brain Functional Connectome
Zhou, J., Gennatas, E. D., Kramer, J. H., Miller, B. L., & Seeley, W. W. (2012) · Neuron · doi:10.1016/j.neuron.2012.03.004 · Cited by 706
Proteopathic tau seeding predicts tauopathy in vivo
Holmes, B. B., Furman, J. L., Mahan, T. E., Yamasaki, T. R., Mirbaha, H., Eades, W. C., Belaygorod, L., Cairns, N. J., Holtzman, D. M., & Diamond, M. I. (2014) · Proceedings of the National Academy of Sciences · doi:10.1073/pnas.1411649111 · Cited by 696
Iba, M., Guo, J. L., McBride, J. D., Zhang, B., Trojanowski, J. Q., & Lee, V. M.-Y. (2013) · The Journal of Neuroscience · doi:10.1523/jneurosci.2642-12.2013 · Cited by 664
Yanamandra, K., Kfoury, N., Jiang, H., Mahan, T. E., Ma, S., Maloney, S. E., Wozniak, D. F., Diamond, M. I., & Holtzman, D. M. (2013) · Neuron · doi:10.1016/j.neuron.2013.07.046 · Cited by 574
Trans-cellular Propagation of Tau Aggregation by Fibrillar Species
Kfoury, N., Holmes, B. B., Jiang, H., Holtzman, D. M., & Diamond, M. I. (2012) · Journal of Biological Chemistry · doi:10.1074/jbc.m112.346072 · Cited by 552
Wu, J. W., Herman, M., Liu, L., Simoes, S., Acker, C. M., Figueroa, H., Steinberg, J. I., Margittai, M., Kayed, R., Zurzolo, C., et al. (2013) · Journal of Biological Chemistry · doi:10.1074/jbc.m112.394528 · Cited by 537
DeVos, S. L., Miller, R. L., Schoch, K. M., Holmes, B. B., Kebodeaux, C. S., Wegener, A. J., Chen, G., Shen, T., Tran, H., Nichols, B., et al. (2017) · Science Translational Medicine · doi:10.1126/scitranslmed.aag0481 · Cited by 516
Self-citationAhmed, Z., Cooper, J., Murray, T. K., Garn, K., McNaughton, E., Clarke, H., Parhizkar, S., Ward, M. A., Cavallini, A., Jackson, S., et al. (2014) · Acta Neuropathologica · doi:10.1007/s00401-014-1254-6 · Cited by 484
Tai, H.-C., Serrano-Pozo, A., Hashimoto, T., Frosch, M. P., Spires-Jones, T. L., & Hyman, B. T. (2012) · The American Journal of Pathology · doi:10.1016/j.ajpath.2012.06.033 · Cited by 443
Self-citationTau association with synaptic vesicles causes presynaptic dysfunction
Zhou, L., McInnes, J., Wierda, K., Holt, M., Herrmann, A. G., Jackson, R. J., Wang, Y.-C., Swerts, J., Beyens, J., Miskiewicz, K., et al. (2017) · Nature Communications · doi:10.1038/ncomms15295 · Cited by 434
Glial contributions to neurodegeneration in tauopathies
Leyns, C. E. G., & Holtzman, D. M. (2017) · Molecular Neurodegeneration · doi:10.1186/s13024-017-0192-x · Cited by 409
Dissecting phenotypic traits linked to human resilience to Alzheimer’s pathology
Perez-Nievas, B. G., Stein, T. D., Tai, H.-C., Dols-Icardo, O., Scotton, T. C., Barroeta-Espar, I., Fernandez-Carballo, L., de Munain, E. L., Perez, J., Marquie, M., et al. (2013) · Brain · doi:10.1093/brain/awt171 · Cited by 387
Self-citationNarasimhan, S., Guo, J. L., Changolkar, L., Stieber, A., McBride, J. D., Silva, L. V., He, Z., Zhang, B., Gathagan, R. J., Trojanowski, J. Q., et al. (2017) · The Journal of Neuroscience · doi:10.1523/jneurosci.1230-17.2017 · Cited by 374
Takeda, S., Wegmann, S., Cho, H., DeVos, S. L., Commins, C., Roe, A. D., Nicholls, S. B., Carlson, G. A., Pitstick, R., Nobuhara, C. K., et al. (2015) · Nature Communications · doi:10.1038/ncomms9490 · Cited by 371
Self-citationRetinal ganglion cell degeneration in Alzheimer's disease
Blanks, J. C., Hinton, D. R., Sadun, A. A., & Miller, C. A. (1989) · Brain Research · doi:10.1016/0006-8993(89)90653-7 · Cited by 297
Xia, C., Makaretz, S. J., Caso, C., McGinnis, S. M., Gomperts, S. N., Sepulcre, J., Gómez‐Isla, T., Hyman, B. T., Schultz, A. P., Vasdev, N., et al. (2017) · JAMA Neurology · doi:10.1001/jamaneurol.2016.5755 · Cited by 288
Self-citationDujardin, S., Lécolle, K., Caillierez, R., Bégard, S., Zommer, N., Lachaud, C., Carrier, S., Dufour, N., Aurégan, G., Winderickx, J., et al. (2014) · Acta Neuropathologica Communications · doi:10.1186/2051-5960-2-14 · Cited by 284
Castillo-Carranza, D. L., Sengupta, U., Guerrero-Muñoz, M. J., Lasagna-Reeves, C. A., Gerson, J. E., Singh, G., Estes, D. M., Barrett, A. D. T., Dineley, K. T., Jackson, G. R., et al. (2014) · The Journal of Neuroscience · doi:10.1523/jneurosci.3192-13.2014 · Cited by 278 · cited 1×
“This therapy has been shown both in vitro and in vivo to be successful at preventing both tau pathology formation and propagation (Boimel et al., 2010; Bi et al., 2011; Yanamandra et al., 2013; Castillo-Carranza et al., 2014; Ittner et al., 2015; Nicholls et al., 2017; Nobuhara et al., 2017).”
BackgroundSynaptic Contacts Enhance Cell-to-Cell Tau Pathology Propagation
Calafate, S., Buist, A., Miśkiewicz, K., Vijayan, V. A., Daneels, G., Strooper, B. D., de Wit, J., Verstreken, P., & Moechars, D. (2015) · Cell Reports · doi:10.1016/j.celrep.2015.04.043 · Cited by 277
Luo, W., Liu, W., Hu, X., Hanna, M., Caravaca, A., & Paul, S. M. (2015) · Scientific Reports · doi:10.1038/srep11161 · Cited by 241
Direct Evidence of Internalization of Tau by Microglia In Vitro and In Vivo
Bolós, M., Llorens-Martín, M., Jurado-Arjona, J., Hernández, F., Rábano, A., & Avila, J. (2016) · Journal of Alzheimer's Disease · doi:10.3233/jad-150704 · Cited by 234
In Vivo Tau, Amyloid, and Gray Matter Profiles in the Aging Brain
Sepulcre, J., Schultz, A. P., Sabuncu, M. R., Gómez‐Isla, T., Chhatwal, J. P., Becker, A., Sperling, R. A., & Johnson, K. A. (2016) · Journal of Neuroscience · doi:10.1523/jneurosci.0639-16.2016 · Cited by 182
Efficacy and safety of immunization with phosphorylated tau against neurofibrillary tangles in mice
Boimel, M., Grigoriadis, N., Lourbopoulos, A., Haber, E., Abramsky, O., & Rosenmann, H. (2010) · Experimental Neurology · doi:10.1016/j.expneurol.2010.05.010 · Cited by 174
Networks of tau distribution in Alzheimer’s disease
Hoenig, M. C., Bischof, G. N., Seemiller, J., Hammes, J., Kukolja, J., Onur, O. A., Jessen, F., Fließbach, K., Neumaier, B., Fink, G. R., et al. (2017) · Brain · doi:10.1093/brain/awx353 · Cited by 174
Local and distant relationships between amyloid, tau and neurodegeneration in Alzheimer's Disease
Iaccarino, L., Tammewar, G., Ayakta, N., Baker, S. L., Bejanin, A., Boxer, A. L., Gorno-Tempini, M. L., Janabi, M., Kramer, J. H., Lazaris, A., et al. (2018) · NeuroImage: Clinical · doi:10.1016/j.nicl.2017.09.016 · Cited by 165
Ho, C., Troncoso, J. C., Knox, D. L., Stark, W. J., & Eberhart, C. G. (2013) · Brain Pathology · doi:10.1111/bpa.12070 · Cited by 157
Bi, M., Ittner, A., Ke, Y. D., Götz, J., & Ittner, L. M. (2011) · PLoS ONE · doi:10.1371/journal.pone.0026860 · Cited by 153
Tai, H., Wang, B. Y., Serrano‐Pozo, A., Frosch, M. P., Spires‐Jones, T. L., & Hyman, B. T. (2014) · Acta Neuropathologica Communications · doi:10.1186/s40478-014-0146-2 · Cited by 147
Self-citationWidespread tau seeding activity at early Braak stages
Furman, J. L., Vaquer‐Alicea, J., White, C. L., Cairns, N. J., Nelson, P. T., & Diamond, M. I. (2016) · Acta Neuropathologica · doi:10.1007/s00401-016-1644-z · Cited by 146
Stancu, I.-C., Vasconcelos, B., Ris, L., Wang, P., Villers, A., Peeraer, E., Buist, A., Terwel, D., Baatsen, P., Oyelami, T., et al. (2015) · Acta Neuropathologica · doi:10.1007/s00401-015-1413-4 · Cited by 143
Pre‐synaptic C‐terminal truncated tau is released from cortical synapses in Alzheimer's disease
Sokolow, S., Henkins, K. M., Bilousova, T., Gonzalez, B., Vinters, H. V., Miller, C. A., Cornwell, L., Poon, W. W., & Gylys, K. H. (2015) · Journal of Neurochemistry · doi:10.1111/jnc.12991 · Cited by 133
Nobuhara, C. K., DeVos, S. L., Commins, C., Wegmann, S., Moore, B. D., Roe, A. D., Costantino, I., Frosch, M. P., Pitstick, R., Carlson, G. A., et al. (2017) · The American Journal of Pathology · doi:10.1016/j.ajpath.2017.01.022 · Cited by 120
Self-citationPolydoro, M., Dzhala, V. I., Pooler, A. M., Nicholls, S. B., McKinney, A. P., Sanchez, L., Pitstick, R., Carlson, G. A., Staley, K. J., Spires-Jones, T. L., et al. (2014) · Acta Neuropathologica · doi:10.1007/s00401-013-1215-5 · Cited by 117
Self-citationSensitive Detection of Proteopathic Seeding Activity with FRET Flow Cytometry
Furman, J. L., Holmes, B. B., & Diamond, M. I. (2015) · Journal of Visualized Experiments · doi:10.3791/53205 · Cited by 104
Characterization of tau prion seeding activity and strains from formaldehyde-fixed tissue
Kaufman, S. K., Thomas, T. L., Tredici, K. D., Braak, H., & Diamond, M. I. (2017) · Acta Neuropathologica Communications · doi:10.1186/s40478-017-0442-8 · Cited by 97
Tau‐targeting passive immunization modulates aspects of pathology in tau transgenic mice
Ittner, A., Bertz, J., Suh, L. S., Stevens, C. H., Götz, J., & Ittner, L. M. (2014) · Journal of Neurochemistry · doi:10.1111/jnc.12821 · Cited by 86
Ishiki, A., Okamura, N., Furukawa, K., Furumoto, S., Harada, R., Tomita, N., Hiraoka, K., Watanuki, S., Ishikawa, Y., Tago, T., et al. (2015) · PLoS ONE · doi:10.1371/journal.pone.0140311 · Cited by 77
Extensive p‐Tau Pathology and SDS‐Stable p‐Tau Oligomers in Alzheimer's Cortical Synapses
Henkins, K. M., Sokolow, S., Miller, C. A., Vinters, H. V., Poon, W. W., Cornwell, L. B., Saing, T., & Gylys, K. H. (2012) · Brain Pathology · doi:10.1111/j.1750-3639.2012.00598.x · Cited by 69
Pickett, E. K., Henstridge, C. M., Allison, E. K., Pitstick, R., Pooler, A. M., Wegmann, S., Carlson, G. A., Hyman, B. T., & Spires‐Jones, T. L. (2017) · Synapse · doi:10.1002/syn.21965 · Cited by 68
Self-citationDifferential distribution of neurons in the gyral white matter of the human cerebral cortex
García‐Marín, V., Blázquez‐Llorca, L., Rodríguez, J., González‐Soriano, J., & DeFelipe, J. (2010) · The Journal of Comparative Neurology · doi:10.1002/cne.22485 · Cited by 63
Determination of regional cerebral function with FDG-PET imaging in neuropsychiatric disorders
Newberg, A. B., Alavi, A. A., & Reivich, M. (2002) · Seminars in Nuclear Medicine · doi:10.1053/snuc.2002.29276 · Cited by 58
Jhou, J.-F., & Tai, H. (2017) · Neurology and Therapy · doi:10.1007/s40120-017-0070-z · Cited by 54
Characterization of TauC3 antibody and demonstration of its potential to block tau propagation
Nicholls, S. B., DeVos, S. L., Commins, C., Nobuhara, C. K., Bennett, R. E., Corjuc, D. L., Maury, E. A., Eftekharzadeh, B., Akingbade, O., Fan, Z., et al. (2017) · PLoS ONE · doi:10.1371/journal.pone.0177914 · Cited by 46
Self-citation
Cited by
Sorted by citations
Alzheimer Disease: An Update on Pathobiology and Treatment Strategies
Long, J. M., & Holtzman, D. M. (2019) · Cell · doi:10.1016/j.cell.2019.09.001 · Cited by 3,204
Knopman, D. S., Amieva, H., Petersen, R. C., Chételat, G., Holtzman, D. M., Hyman, B. T., Nixon, R. A., & Jones, D. T. (2021) · Nature Reviews Disease Primers · doi:10.1038/s41572-021-00269-y · Cited by 2,606
Self-citationLópez, J. A., González, H. M., & Léger, G. C. (2019) · Handbook of clinical neurology · doi:10.1016/b978-0-12-804766-8.00013-3 · Cited by 887
Spread of pathological tau proteins through communicating neurons in human Alzheimer’s disease
Vogel, J. W., Iturria‐Medina, Y., Strandberg, O. T., Smith, R. A., Levitis, E., Evans, A. C., Hansson, O., Initiative, A. D. N., Weiner, M. W., Aisen, P., et al. (2020) · Nature Communications · doi:10.1038/s41467-020-15701-2 · Cited by 537
Synaptic degeneration in Alzheimer disease
Tzioras, M., McGeachan, R. I., Durrant, C. S., & Spires-Jones, T. L. (2023) · Nature Reviews Neurology · doi:10.1038/s41582-022-00749-z · Cited by 504
Metadata
- Authors
- DeVos, S. L., Corjuc, B. T., Oakley, D. H., Nobuhara, C. K., Bannon, R. N., Chase, A., Commins, C., Gonzalez, J. A., Dooley, P. M., Frosch, M. P., & Hyman, B. T.
- Affiliations
- Harvard University (US)
- Corresponding author
- Hyman, Bradley T.
- ORCID
- Venue
- Frontiers in Neuroscience
- Publisher
- Frontiers Media SA
- Published
- 2018-04-24
- Volume
- 12
- Pages
- 267-267
- ISSN
- 1662-453X (ISSN-L)
- PMC
- PMC5928393
- OpenAlex
- W2800998714
- Cited by
- 285
- References
- 63
- Citations by year
- 2026: 13 · 2025: 28 · 2024: 47 · 2023: 41 · 2022: 34 · 2021: 50 · 2020: 36 · 2019: 23 · 2018: 11
- FWCI
- 20.63
- Type
- journal article
- Language
- en
- Open access
- gold
- doi.org
- Locations
- Frontiers in Neuroscience (publishedVersion, cc-by)
- Europe PMC (PubMed Central) (publishedVersion, cc-by)
- PubMed Central (publishedVersion, cc-by)
- PubMed (publishedVersion)
- Digital Access to Scholarship at Harvard (DASH) (Harvard University) (submittedVersion, cc-by)
- DOAJ (DOAJ: Directory of Open Access Journals) (submittedVersion, cc-by-sa)
- Funders
- National Institutes of Health (AG000222, AG026249)
- BrightFocus Foundation
- Topics
- Life Sciences › Neuroscience › Cellular and Molecular Neuroscience › Alzheimer's disease research and treatments
- Health Sciences › Medicine › Psychiatry and Mental health › Dementia and Cognitive Impairment Research
- Life Sciences › Neuroscience › Neurology › Neuroinflammation and Neurodegeneration Mechanisms
- Keywords
- Alzheimer's disease, tau seeding, tau pathology, neurofibrillary tangles, Braak staging, prion-like spread, transneuronal spread, entorhinal cortex, optic nerve, synaptosomes, tau phosphorylation, P301S tau, human brain
About these checks
Registry, retraction, Cites and statistics results are computed, not judged, with one exception: a printed reference that no index lists is read once by a model before it counts as a citation error. Claims are extracted by a model and kept only when their quote appears verbatim in the text; each cited source is then checked, with a model’s help, for whether it says what the claim relies on. Those verdicts can be wrong — read the claim’s quote and the cited source before relying on one.
Statistics and arithmetic are recomputed, not judged.
Confidence bands are shown only for fields calibrated on our annotated test set. None is calibrated yet, so no band is shown.
What counts as a claim ›How we measure confidence ›How we check this ›
Are you an author, or do you see a problem with this page? Request a review
