

The DOI matches its Crossref record; 49 of the 49 references it cites were found in a registry or an index.
Extracellular Monomeric Tau Is Internalized by Astrocytes
Open accessAbstract
Tau is a microtubule-associated protein that is expressed in neurons. However, in a group of neurodegenerative diseases named tauopathies - characterized by an increase in aggregated and/or hyperphosphorylated Tau - the protein accumulates inside other cells, such as astrocytes and microglia. Given that these glial cells do not produce Tau, its presence can be explained by internalization from the extracellular medium and consequent formation of Tau aggregates. Among internalization mechanisms, heparan sulfate proteoglycans (HSPGs) have been proposed to be responsible for fibrillary Tau uptake in various cell types. Here we studied whether monomeric Tau, which has been observed to be internalized by glial cells such as microglia, was also taken up by astrocytes. Although this Tau form was internalized from the extracellular medium by these cells, the mechanism of uptake was found to be independent of HSPGs.
Overview
The claims and statistics of this paper haven’t been checked yet.
Run the check — free, no account needed. It reads the open-access text and checks the sources it cites.
Integrity signals
Registry
Cites
Statistics
Figures
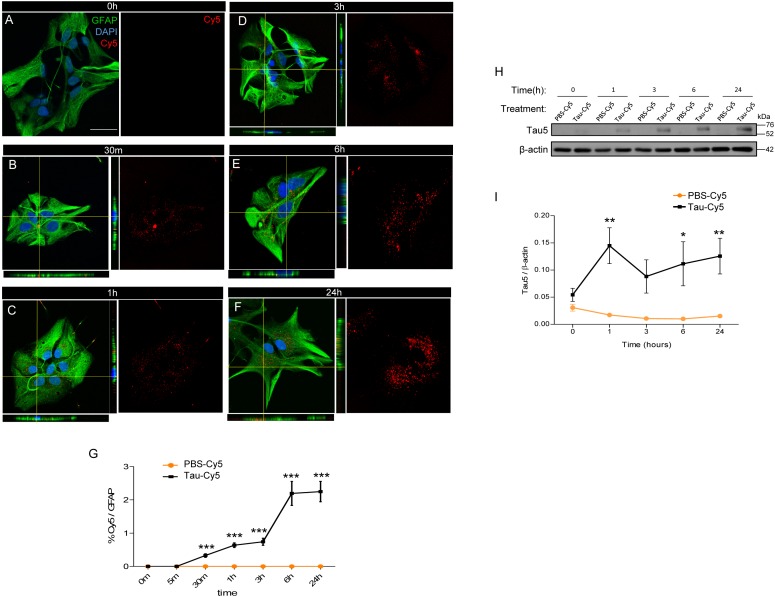
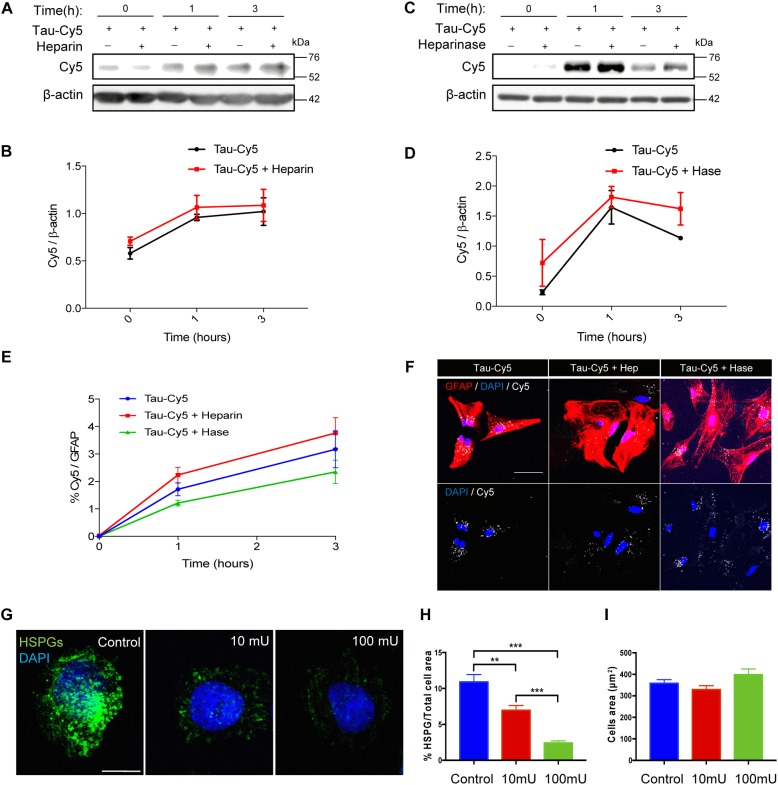
Verification
Claims the paper makes
The claims and statistics of this paper haven’t been checked yet.
Run the check — free, no account needed. It reads the open-access text and checks the sources it cites.
Claims other papers make about this one
Each is checked against this paper’s own text: does it say what the citing paper says it does?
The cited source doesn’t support the claim as written.
In the citing paper
“astrocytes are increasingly recognized as active participants in tau clearance, a process critical for limiting the spread of pathological tau aggregates in AD and related tauopathies.”
From Protective mechanisms against Alzheimer's disease in APOE3‐Christchurch homozygous astrocytes (2025) · cites this paper as [13]
Checked by a reasoning model — may be wrong.
Experimental — accuracy not yet measuredThe cited source says what the claim attributes to it.
In the citing paper
“Previous studies have demonstrated that astrocytes can internalize both tau monomers and higher‐molecular‐weight tau species. 13 , 28”
From Protective mechanisms against Alzheimer's disease in APOE3‐Christchurch homozygous astrocytes (2025) · cites this paper as [13]
In the citing paper
“Astrocytes can internalize tau monomers or fibrils through mechanisms independent of HSPGs [202].”
From Tau and neuroinflammation in Alzheimer’s disease: interplay mechanisms and clinical translation (2023) · cites this paper as [202]
Self-check
Percentages, sums and reported differences re-computed from the paper’s own numbers.
The self-check needs the paper’s full text.
Citations
Cites
Neuropathological stageing of Alzheimer-related changes.
Braak, H., & Braak, E. (1991) · Acta Neuropathologica · doi:10.1007/bf00308809 · Cited by 16,123
A protein factor essential for microtubule assembly
Weingarten, M. D., Lockwood, A. H., Hwo, S. Y., & Kirschner, M. W. (1975) · Proceedings of the National Academy of Sciences · doi:10.1073/pnas.72.5.1858 · Cited by 3,089
Tau-mediated neurodegeneration in Alzheimer’s disease and related disorders
Ballatore, C., Lee, V. M.-Y., & Trojanowski, J. Q. (2007) · Nature Reviews Neuroscience · doi:10.1038/nrn2194 · Cited by 2,174
Heparan sulfate proteoglycans mediate internalization and propagation of specific proteopathic seeds
Holmes, B. B., DeVos, S. L., Kfoury, N., Li, M., Jacks, R., Yanamandra, K., Ouidja, M. O., Brodsky, F. M., Marasa, J., Bagchi, D. P., et al. (2013) · Proceedings of the National Academy of Sciences · doi:10.1073/pnas.1301440110 · Cited by 859
Tau protein function in living cells.
Drubin, D. G., & Kirschner, M. W. (1986) · The Journal of Cell Biology · doi:10.1083/jcb.103.6.2739 · Cited by 766
The release and trans-synaptic transmission of Tau via exosomes
Wang, Y., Balaji, V., Kaniyappan, S., Krüger, L., Irsen, S., Tepper, K., Chandupatla, R., Maetzler, W., Schneider, A., Mandelkow, E., et al. (2017) · Molecular Neurodegeneration · doi:10.1186/s13024-016-0143-y · Cited by 674
Physiological release of endogenous tau is stimulated by neuronal activity
Pooler, A. M., Phillips, E. C., Lau, D. H. W., Noble, W., & Hanger, D. P. (2013) · The EMBO Reports · doi:10.1038/embor.2013.15 · Cited by 642
Arendt, T., Stieler, J. T., & Holzer, M. (2016) · Brain Research Bulletin · doi:10.1016/j.brainresbull.2016.08.018 · Cited by 609
Maphis, N., Xu, G., Kokiko-Cochran, O. N., Jiang, S., Cardona, A., Ransohoff, R. M., Lamb, B. T., & Bhaskar, K. (2015) · Brain · doi:10.1093/brain/awv081 · Cited by 595
Aging-related tau astrogliopathy (ARTAG): Harmonized evaluation strategy
Kovacs, G. G., Ferrer, I., Grinberg, L. T., Alafuzoff, I., Attems, J., Budka, H., Cairns, N. J., Crary, J. F., Duyckaerts, C., Ghetti, B., et al. (2016) · Acta Neuropathologica · doi:10.1007/s00401-015-1509-x · Cited by 532 · cited 2×
“, 2015; Leyns and Holtzman, 2017) and astrocytes (Kovacs et al., 2016; Ferrer et al., 2018), despite their lack of Tau expression.”
BackgroundGlial contributions to neurodegeneration in tauopathies
Leyns, C. E. G., & Holtzman, D. M. (2017) · Molecular Neurodegeneration · doi:10.1186/s13024-017-0192-x · Cited by 409
Selkoe, D. J., Ihara, Y., & Salazar, F. J. (1982) · Science · doi:10.1126/science.6120571 · Cited by 395
Buée, L., & Delacourte, A. (1999) · Brain Pathology · doi:10.1111/j.1750-3639.1999.tb00550.x · Cited by 368
Tau pathophysiology in neurodegeneration: a tangled issue
Spires‐Jones, T. L., Stoothoff, W. H., de Calignon, A., Jones, P., & Hyman, B. T. (2009) · Trends in Neurosciences · doi:10.1016/j.tins.2008.11.007 · Cited by 321
Mechanisms of secretion and spreading of pathological tau protein
Brunello, C. A., Merezhko, M., Uronen, R.-L., & Huttunen, H. J. (2020) · Cellular and Molecular Life Sciences · doi:10.1007/s00018-019-03349-1 · Cited by 304
Synaptic Contacts Enhance Cell-to-Cell Tau Pathology Propagation
Calafate, S., Buist, A., Miśkiewicz, K., Vijayan, V. A., Daneels, G., Strooper, B. D., de Wit, J., Verstreken, P., & Moechars, D. (2015) · Cell Reports · doi:10.1016/j.celrep.2015.04.043 · Cited by 277
Unconventional Secretion Mediates the Trans-cellular Spreading of Tau
Katsinelos, T., Zeitler, M., Dimou, E., Karakatsani, A., Müller, H., Nachman, E., Steringer, J. P., de Almodóvar, C. R., Nickel, W., & Jahn, T. R. (2018) · Cell Reports · doi:10.1016/j.celrep.2018.04.056 · Cited by 274
TFEB enhances astroglial uptake of extracellular tau species and reduces tau spreading
Martini-Stoica, H., Cole, A. L., Swartzlander, D. B., Chen, F., Wan, Y.-W., Bajaj, L., Bader, D. A., Lee, V. M. Y., Trojanowski, J. Q., Liu, Z., et al. (2018) · Journal of Experimental Medicine · doi:10.1084/jem.20172158 · Cited by 253
Extracellular tau is toxic to neuronal cells
Gómez-Ramos, A., Díaz-Hernández, M., Cuadros, R., Hernández, F., & Avila, J. (2006) · FEBS Letters · doi:10.1016/j.febslet.2006.07.078 · Cited by 241
Self-citationLuo, W., Liu, W., Hu, X., Hanna, M., Caravaca, A., & Paul, S. M. (2015) · Scientific Reports · doi:10.1038/srep11161 · Cited by 241
Direct Evidence of Internalization of Tau by Microglia In Vitro and In Vivo
Bolós, M., Llorens-Martín, M., Jurado-Arjona, J., Hernández, F., Rábano, A., & Avila, J. (2016) · Journal of Alzheimer's Disease · doi:10.3233/jad-150704 · Cited by 234
Self-citationAbsence of CX3CR1 impairs the internalization of Tau by microglia
Bolós, M., Llorens-Martín, M., Perea, J. R., Jurado-Arjona, J., Rábano, A., Hernández, F., & Avila, J. (2017) · Molecular Neurodegeneration · doi:10.1186/s13024-017-0200-1 · Cited by 231
Self-citationAre tau aggregates toxic or protective in tauopathies?
Cowan, C. M., & Mudher, A. (2013) · Frontiers in Neurology · doi:10.3389/fneur.2013.00114 · Cited by 215
Tau Internalization is Regulated by 6-O Sulfation on Heparan Sulfate Proteoglycans (HSPGs)
Rauch, J. N., Chen, J. J., Sorum, A. W., Miller, G. M., Sharf, T., See, S. K., Hsieh-Wilson, L. C., Kampmann, M., & Kosik, K. S. (2018) · Scientific Reports · doi:10.1038/s41598-018-24904-z · Cited by 211 · cited 2×
“However, the implication of these structures in the internalization of monomeric Tau has been addressed only in neurons (Katsinelos et al., 2018; Rauch et al., 2018).”
BackgroundPrion-like Properties of Tau Protein: The Importance of Extracellular Tau as a Therapeutic Target
Holmes, B. B., & Diamond, M. I. (2014) · Journal of Biological Chemistry · doi:10.1074/jbc.r114.549295 · Cited by 202
Stopschinski, B. E., Holmes, B. B., Miller, G. M., Manon, V. A., Vaquer-Alicea, J., Prueitt, W. L., Hsieh-Wilson, L. C., & Diamond, M. I. (2018) · Journal of Biological Chemistry · doi:10.1074/jbc.ra117.000378 · Cited by 180
Proteostasis of tau. Tau overexpression results in its secretion via membrane vesicles
Simón, D., García‐García, E., Royo, F., Falcón‐Pérez, J. M., & Ávila, J. (2011) · FEBS Letters · doi:10.1016/j.febslet.2011.11.022 · Cited by 166
Self-citationThe role of extracellular Tau in the spreading of neurofibrillary pathology
Medina, M., & Avila, J. (2014) · Frontiers in Cellular Neuroscience · doi:10.3389/fncel.2014.00113 · Cited by 161
Self-citationIhse, E., Yamakado, H., van Wijk, X. M., Lawrence, R., Esko, J. D., & Masliah, E. (2017) · Scientific Reports · doi:10.1038/s41598-017-08720-5 · Cited by 144
Avila, J., Jiménez, J. S., Sayas, C. L., Bolós, M., Zabala, J. C., Rivas, G., & Hernández, F. (2016) · Frontiers in Aging Neuroscience · doi:10.3389/fnagi.2016.00262 · Cited by 140
Self-citationThe Role of Microglia in the Spread of Tau: Relevance for Tauopathies
Perea, J. R., Llorens-Martín, M., Ávila, J., & Bolós, M. (2018) · Frontiers in Cellular Neuroscience · doi:10.3389/fncel.2018.00172 · Cited by 129
Self-citationPathogenesis of the Tauopathies
Goedert, M., & Spillantini, M. G. (2011) · Journal of Molecular Neuroscience · doi:10.1007/s12031-011-9593-4 · Cited by 126
Astroglia and Tau: New Perspectives
Kovacs, G. G. (2020) · Frontiers in Aging Neuroscience · doi:10.3389/fnagi.2020.00096 · Cited by 115
Puangmalai, N., Bhatt, N. N., Montalbano, M., Sengupta, U., Gaikwad, S., Ventura, F. L., McAllen, S., Ellsworth, A., García, S., & Kayed, R. (2020) · Cell Death and Disease · doi:10.1038/s41419-020-2503-3 · Cited by 113
New Features about Tau Function and Dysfunction
Medina, M., Hernández, F., & Ávila, J. (2016) · Biomolecules · doi:10.3390/biom6020021 · Cited by 103
Self-citationCharacteristics and consequences of muscarinic receptor activation by tau protein
Gómez‐Ramos, A., Dı́az-Hernández, M., Rubio, A., Díaz‐Hernandéz, J. I., Miras‐Portugal, M. T., & Ávila, J. (2009) · European Neuropsychopharmacology · doi:10.1016/j.euroneuro.2009.04.006 · Cited by 95
Self-citationFox, L. M., William, C. M., Adamowicz, D. H., Pitstick, R., Carlson, G. A., Spires-Jones, T. L., & Hyman, B. T. (2011) · Journal of Neuropathology & Experimental Neurology · doi:10.1097/nen.0b013e318220a658 · Cited by 88
Aging‐related tau astrogliopathy (ARTAG): not only tau phosphorylation in astrocytes
Ferrer, I., Aguiló, M., González, I. L., Lucena, D. D., Roig, A., Carmona, M., Llorens, F., Garcia‐Esparcia, P., Martínez-Maldonado, A., Frau‐Méndez, M. A., et al. (2018) · Brain Pathology · doi:10.1111/bpa.12593 · Cited by 77
Gerson, J. E., Castillo‐Carranza, D. L., & Kayed, R. (2014) · ACS Chemical Neuroscience · doi:10.1021/cn500143n · Cited by 75
Soluble Tau has devastating effects on the structural plasticity of hippocampal granule neurons
Bolós, M., Pallas‐Bazarra, N., Terreros‐Roncal, J., Perea, J. R., Jurado‐Arjona, J., Ávila, J., & Llorens-Martín, M. (2017) · Translational Psychiatry · doi:10.1038/s41398-017-0013-6 · Cited by 55
Self-citationPerea, J. R., Ávila, J., & Bolós, M. (2018) · Experimental Neurology · doi:10.1016/j.expneurol.2018.08.007 · Cited by 54
Self-citationOdawara, T., Iseki, E., Kosaka, K., Akiyama, H., Ikeda, K., & Yamamoto, T. (1995) · Neuroscience Letters · doi:10.1016/0304-3940(95)11595-n · Cited by 47
Tau Propagation, Different Tau Phenotypes, and Prion-like Properties of Tau
Hyman, B. T. (2014) · Neuron · doi:10.1016/j.neuron.2014.06.004 · Cited by 44
The role of tau phosphorylation in transfected COS-1 cells
Medina, M., de Garcini, E. M., & Ávila, J. (1995) · Molecular and Cellular Biochemistry · doi:10.1007/bf00929506 · Cited by 33
Self-citationHassan-Abdi, R., Brenet, A., Bennis, M., Yanicostas, C., & Soussi‐Yanicostas, N. (2019) · Frontiers in Neuroscience · doi:10.3389/fnins.2019.01199 · Cited by 28
Secretion of full-length tau or tau fragments in a cell culture model
Pérez, M., Cuadros, R., Hernández, F., & Ávila, J. (2016) · Neuroscience Letters · doi:10.1016/j.neulet.2016.09.026 · Cited by 27
Self-citationThe sulfation code for propagation of neurodegeneration
Yamada, M., & Hamaguchi, T. (2018) · Journal of Biological Chemistry · doi:10.1074/jbc.h118.003970 · Cited by 21
Methylene Blue Blocks and Reverses the Inhibitory Effect of Tau on PMCA Function
Berrocal, M., Caballero-Bermejo, M., Gutierrez-Merino, C., & Mata, A. M. (2019) · International Journal of Molecular Sciences · doi:10.3390/ijms20143521 · Cited by 17
Medina, M., & Ávila, J. (2014) · Journal of Alzheimer s Disease · doi:10.3233/jad-140755 · Cited by 8
Self-citation
Cited by
Sorted by citations
Tau and neuroinflammation in Alzheimer’s disease: interplay mechanisms and clinical translation
Chen, Y., & Yu, Y. (2023) · Journal of Neuroinflammation · doi:10.1186/s12974-023-02853-3 · Cited by 516
“Astrocytes can internalize tau monomers or fibrils through mechanisms independent of HSPGs [202].”
BackgroundInfluentialAstrocyte contribution to dysfunction, risk and progression in neurodegenerative disorders
Brandebura, A. N., Paumier, A., Onur, T. S., & Allen, N. J. (2023) · Nature Reviews Neuroscience · doi:10.1038/s41583-022-00641-1 · Cited by 427
Mechanisms of secretion and spreading of pathological tau protein
Brunello, C. A., Merezhko, M., Uronen, R.-L., & Huttunen, H. J. (2020) · Cellular and Molecular Life Sciences · doi:10.1007/s00018-019-03349-1 · Cited by 304
Cellular and pathological functions of tau
Bravo, C. P., Naguib, S. A., & Gan, L. (2024) · Nature Reviews Molecular Cell Biology · doi:10.1038/s41580-024-00753-9 · Cited by 271
Reducing acetylated tau is neuroprotective in brain injury
Shin, M.-K., Vázquez-Rosa, E., Koh, Y., Dhar, M., Chaubey, K., Cintrón-Pérez, C. J., Barker, S., Miller, E., Franke, K., Noterman, M. F., et al. (2021) · Cell · doi:10.1016/j.cell.2021.03.032 · Cited by 226
Metadata
- Authors
- Perea, J. R., López, E., Díez-Ballesteros, J. C., Ávila, J., Hernández, F., & Bolós, M.
- Affiliations
- Biomedical Research Networking Center on Neurodegenerative Diseases (ES)
- Centro de Biología Molecular Severo Ochoa (ES)
- Corresponding author
- Bolós, Marta
- Venue
- Frontiers in Neuroscience
- Publisher
- Frontiers Media SA
- Published
- 2019-05-01
- Volume
- 13
- Pages
- 442-442
- ISSN
- 1662-453X (ISSN-L)
- PMC
- PMC6504834
- OpenAlex
- W2943016427
- Cited by
- 114
- References
- 49
- Citations by year
- 2026: 7 · 2025: 14 · 2024: 20 · 2023: 13 · 2022: 10 · 2021: 28 · 2020: 15 · 2019: 6
- FWCI
- 10.11
- Type
- journal article
- Language
- en
- Open access
- gold
- doi.org
- Licence
- Locations
- Frontiers in Neuroscience (publishedVersion, cc-by)
- Europe PMC (PubMed Central) (publishedVersion, cc-by)
- PubMed Central (publishedVersion, cc-by)
- PubMed (publishedVersion)
- DIGITAL.CSIC (Spanish National Research Council (CSIC)) (submittedVersion, cc-by)
- DOAJ (DOAJ: Directory of Open Access Journals) (submittedVersion)
- Hispana (submittedVersion, cc-by)
- Biblos-e Archivo (Universidad Autónoma de Madrid) (submittedVersion, public-domain)
- Funders
- Centro de Biología Molecular Severo Ochoa
- Ministerio de Economía y Competitividad (SAF-2014-53040-P, BFU2016-77885-P)
- Centro de Investigación Biomédica en Red sobre Enfermedades Neurodegenerativas
- Topics
- Life Sciences › Neuroscience › Cellular and Molecular Neuroscience › Alzheimer's disease research and treatments
- Life Sciences › Neuroscience › Neurology › Neuroinflammation and Neurodegeneration Mechanisms
- Life Sciences › Biochemistry, Genetics and Molecular Biology › Cell Biology › Cellular transport and secretion
- Keywords
- tau protein, astrocytes, tauopathy, heparan sulfate proteoglycans, microglia, tau aggregation
About these checks
Registry, retraction, Cites and statistics results are computed, not judged, with one exception: a printed reference that no index lists is read once by a model before it counts as a citation error. Claims are extracted by a model and kept only when their quote appears verbatim in the text; each cited source is then checked, with a model’s help, for whether it says what the claim relies on. Those verdicts can be wrong — read the claim’s quote and the cited source before relying on one.
Statistics and arithmetic are recomputed, not judged.
Confidence bands are shown only for fields calibrated on our annotated test set. None is calibrated yet, so no band is shown.
What counts as a claim ›How we measure confidence ›How we check this ›
Are you an author, or do you see a problem with this page? Request a review
