Cited by 66Neuroinflammation and Neurodegeneration MechanismsBarrier Structure and Function StudiesThermal Regulation in Medicine

The DOI matches its Crossref record; 223 of the 224 references it cites were found in a registry or an index.

Glial functions in the blood-brain communication at the circumventricular organs

Open access
Miyata, Seiji·2022·Frontiers in Neuroscience

Abstract

The circumventricular organs (CVOs) are located around the brain ventricles, lack a blood-brain barrier (BBB) and sense blood-derived molecules. This review discusses recent advances in the importance of CVO functions, especially glial cells transferring periphery inflammation signals to the brain. The CVOs show size-limited vascular permeability, allowing the passage of molecules with molecular weight <10,000. This indicates that the lack of an endothelial cell barrier does not mean the free movement of blood-derived molecules into the CVO parenchyma. Astrocytes and tanycytes constitute a dense barrier at the distal CVO subdivision, preventing the free diffusion of blood-derived molecules into neighboring brain regions. Tanycytes in the CVOs mediate communication between cerebrospinal fluid and brain parenchyma via transcytosis. Microglia and macrophages of the CVOs are essential for transmitting peripheral information to other brain regions via toll-like receptor 2 (TLR2). Inhibition of TLR2 signaling or depletion of microglia and macrophages in the brain eliminates TLR2-dependent inflammatory responses. In contrast to TLR2, astrocytes and tanycytes in the CVOs of the brain are crucial for initiating lipopolysaccharide (LPS)-induced inflammatory responses via TLR4. Depletion of microglia and macrophages augments LPS-induced fever and chronic sickness responses. Microglia and macrophages in the CVOs are continuously activated, even under normal physiological conditions, as they exhibit activated morphology and express the M1/M2 marker proteins. Moreover, the microglial proliferation occurs in various regions, such as the hypothalamus, medulla oblongata, and telencephalon, with a marked increase in the CVOs, due to low-dose LPS administration, and after high-dose LPS administration, proliferation is seen in most brain regions, except for the cerebral cortex and hippocampus. A transient increase in the microglial population is beneficial during LPS-induced inflammation for attenuating sickness response. Transient receptor potential receptor vanilloid 1 expressed in astrocytes and tanycytes of the CVOs is responsible for thermoregulation upon exposure to a warm environment less than 37°C. Alternatively, Na x expressed in astrocytes and tanycytes of the CVOs is crucial for maintaining body fluid homeostasis. Thus, recent findings indicate that glial cells in the brain CVOs are essential for initiating neuroinflammatory responses and maintaining body fluid and thermal homeostasis.

Overview

The claims and statistics of this paper haven’t been checked yet.

Run the check — free, no account needed. It reads the open-access text and checks the sources it cites.

A few free checks a day · papers already verified open instantly · results are public

Integrity signals

Registry

Crossref · 10.3389/fnins.2022.991779

Cites

223 of 223 references verified0 citation errors · 0 not checkable

Statistics

Figures

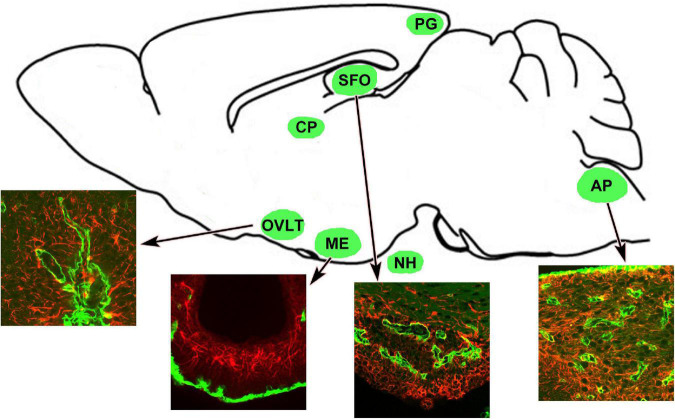
FIGURE 1 Schematic representation revealing CVOs locations in the adult rodent brain. Insets indicate that the CVOs are characterized by dense and thick laminin+ (green) capillaries and dense GFAP+ (red) astrocytic and tanycytic networks. Scale bar = 50 μm. AP, area postrema; CP, choroid plexus; GFAP, glial fibrillar acidic protein; ME, median eminence; NH, neurohypophysis; OVLT, organum vasculosum of the lamina terminalis; PG, pineal gland; SFO, subfornical organ. The illustration is rearranged with permission from Elsevier B.V. (Takagi et al., 2017).
FIGURE 1 Schematic representation revealing CVOs locations in the adult rodent brain. Insets indicate that the CVOs are characterized by dense and thick laminin+ (green) capillaries and dense GFAP+ (red) astrocytic and tanycytic networks. Scale bar = 50 μm. AP, area postrema; CP, choroid plexus; GFAP, glial fibrillar acidic protein; ME, median eminence; NH, neurohypophysis; OVLT, organum vasculosum of the lamina terminalis; PG, pineal gland; SFO, subfornical organ. The illustration is rearranged with permission from Elsevier B.V. (Takagi et al., 2017).CC BY · PubMed Central
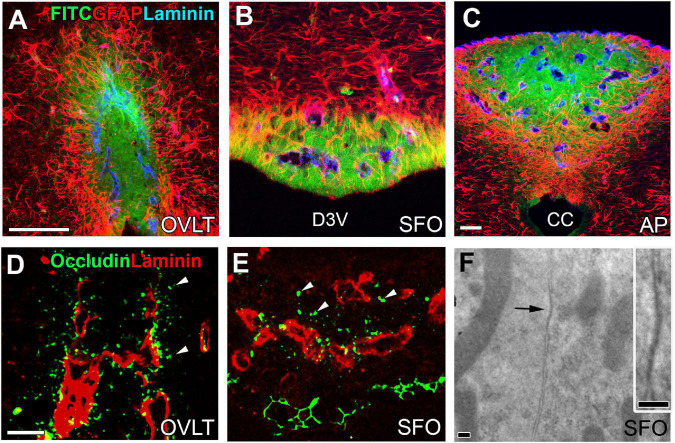
FIGURE 2 Vascular permeability and tight junctions in the CVOs of the adult mouse brain. Strong fluorescence of blood-derived fluorescein isothiocyanate is seen at the central subdivision of the sensory CVOs, but fluorescence is weak at distal subdivisions and no fluorescence is seen in the neighboring brain region beyond dense astrocytic and tanycytic barriers (A–C). Tight junction protein occludin is seen at parenchyma close to fenestrated capillaries and tanycytic layers (D,E). An electron microscopic image reveals the tight junction-like structure between the plasma membrane of neighboring cells making complete contact (F). Scale bar = 50 μm (A,C,D) and 100 nm (F). AP, area postrema; CC, central canal; D3V, dorsal 3rd ventricle; FITC, fluorescein isothiocyanate; GFAP, glial fibrillar acidic protein; OVLT, organum vasculosum of the lamina terminalis; SFO, subfornical organ. Photographs are rearranged with permission from Springer Nature (Morita et al., 2016).
FIGURE 2 Vascular permeability and tight junctions in the CVOs of the adult mouse brain. Strong fluorescence of blood-derived fluorescein isothiocyanate is seen at the central subdivision of the sensory CVOs, but fluorescence is weak at distal subdivisions and no fluorescence is seen in the neighboring brain region beyond dense astrocytic and tanycytic barriers (A–C). Tight junction protein occludin is seen at parenchyma close to fenestrated capillaries and tanycytic layers (D,E). An electron microscopic image reveals the tight junction-like structure between the plasma membrane of neighboring cells making complete contact (F). Scale bar = 50 μm (A,C,D) and 100 nm (F). AP, area postrema; CC, central canal; D3V, dorsal 3rd ventricle; FITC, fluorescein isothiocyanate; GFAP, glial fibrillar acidic protein; OVLT, organum vasculosum of the lamina terminalis; SFO, subfornical organ. Photographs are rearranged with permission from Springer Nature (Morita et al., 2016).CC BY · PubMed Central
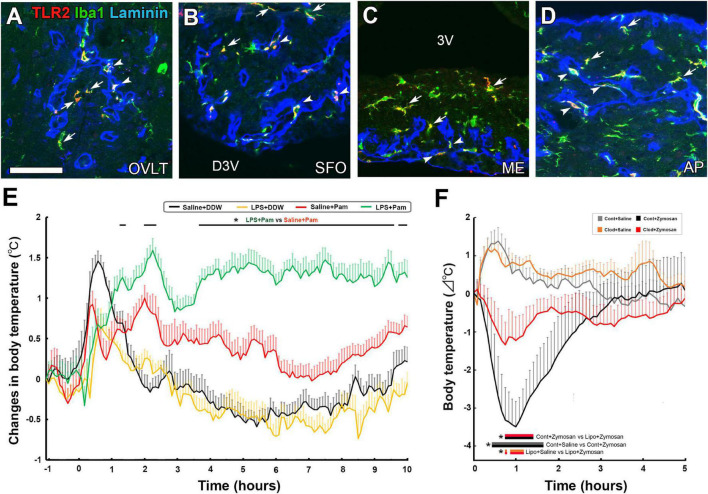
FIGURE 3 The expression of TLR2 at microglia and macrophages in the CVOs and TLR2 agonist-induced fever and hypothermia in the adult mouse. Triple labeled immunohistochemistry shows prominent TLR2 expression at Iba1+ microglia (arrows) in parenchyma and Iba1+ macrophages (arrowheads) in laminin+ capillary of the CVOs (A–D). LPS pretreatment promotes fever generation induced by a LMW TLR2 agonist Pam3CSK4 (E). Depletion of microglia and macrophages with clodronate liposomes attenuates hypothermia induced by the HMW TLR2 agonist zymosan (E). Scale bar = 50 μm. 3V, 3rd ventricle; AP, area postrema; D3V, dorsal 3rd ventricle; ME, median eminence; OVLT, organum vasculosum of the lamina terminalis; SFO, subfornical organ; TLR2, toll-like receptor 2. p < 0.05 by an ANOVA with Tukey’s post-hoc test. Photographs are rearranged with permission from Elsevier B.V. [(A–E) Murayama et al., 2019; (F) Takagi et al., 2020].
FIGURE 3 The expression of TLR2 at microglia and macrophages in the CVOs and TLR2 agonist-induced fever and hypothermia in the adult mouse. Triple labeled immunohistochemistry shows prominent TLR2 expression at Iba1+ microglia (arrows) in parenchyma and Iba1+ macrophages (arrowheads) in laminin+ capillary of the CVOs (A–D). LPS pretreatment promotes fever generation induced by a LMW TLR2 agonist Pam3CSK4 (E). Depletion of microglia and macrophages with clodronate liposomes attenuates hypothermia induced by the HMW TLR2 agonist zymosan (E). Scale bar = 50 μm. 3V, 3rd ventricle; AP, area postrema; D3V, dorsal 3rd ventricle; ME, median eminence; OVLT, organum vasculosum of the lamina terminalis; SFO, subfornical organ; TLR2, toll-like receptor 2. p < 0.05 by an ANOVA with Tukey’s post-hoc test. Photographs are rearranged with permission from Elsevier B.V. [(A–E) Murayama et al., 2019; (F) Takagi et al., 2020].CC BY · PubMed Central
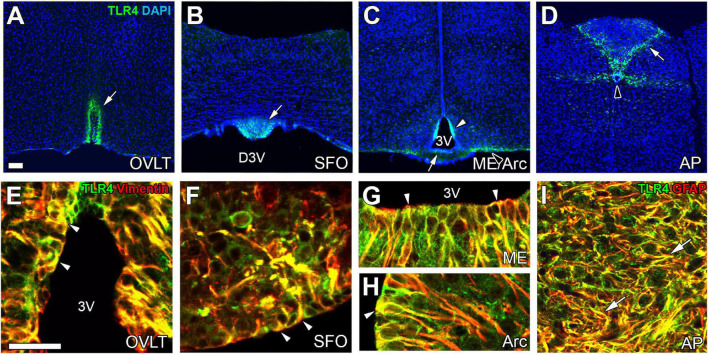
FIGURE 4 The expression of TLR4 at astrocytes/tanycytes of the adult mouse brain. Immunohistochemistry shows robust and specific TLR4 expression in the CVOs (open arrows), Arc (open arrowhead), and CC (solid arrowhead) (A–D). Double-labeling immunohistochemistry reveals that TLR4 is expressed at vimentin+ tanycytes (arrowheads) and GFAP+ astrocytes (arrows) (E–I). Scale bars = 50 μm. 3V, 3rd ventricle; AP, area postrema; Arc, arcuate nucleus; DAPI, 4′,6-diamidino-2-phenylindole; D3V, dorsal 3rd ventricle; GFAP, glial fibrillar acidic protein; ME, median eminence; OVLT, organum vasculosum of the lamina terminalis; SFO, subfornical organ; TLR4, toll-like receptor 4. Photographs are rearranged with permission from Elsevier B.V. (Muneoka et al., 2019).
FIGURE 4 The expression of TLR4 at astrocytes/tanycytes of the adult mouse brain. Immunohistochemistry shows robust and specific TLR4 expression in the CVOs (open arrows), Arc (open arrowhead), and CC (solid arrowhead) (A–D). Double-labeling immunohistochemistry reveals that TLR4 is expressed at vimentin+ tanycytes (arrowheads) and GFAP+ astrocytes (arrows) (E–I). Scale bars = 50 μm. 3V, 3rd ventricle; AP, area postrema; Arc, arcuate nucleus; DAPI, 4′,6-diamidino-2-phenylindole; D3V, dorsal 3rd ventricle; GFAP, glial fibrillar acidic protein; ME, median eminence; OVLT, organum vasculosum of the lamina terminalis; SFO, subfornical organ; TLR4, toll-like receptor 4. Photographs are rearranged with permission from Elsevier B.V. (Muneoka et al., 2019).CC BY · PubMed Central
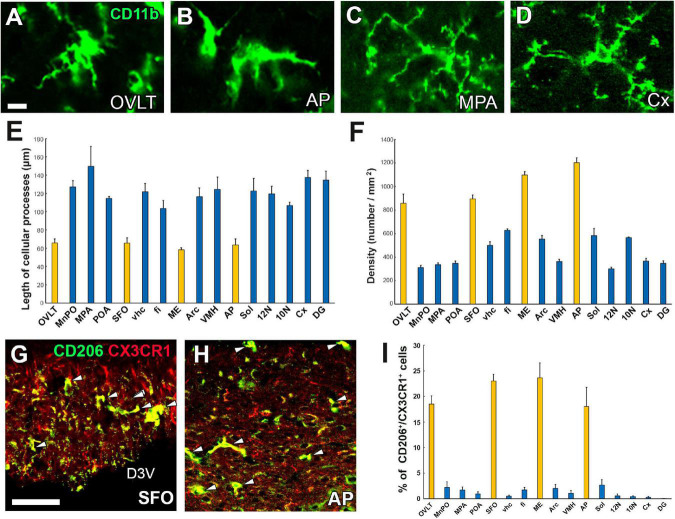
FIGURE 5 Activated state of microglia in the CVOs even under physiologically normal conditions. Microglia morphology in the CVOs, such as the OVLT and AP, is amoeboid, whereas in the medial preoptic area and cerebral cortex, it is dendritic (A–D). Quantitative analysis reveals shorter microglial cellular processes in the CVOs than other brain regions (E). The density of the CVOs microglia is significantly higher than that of other brain regions (F). Double-labeling immunohistochemistry shows that CX3CR1+ microglia express an M2 marker protein CD206 (arrowheads) in the SFO and AP (G,H). Quantitative analysis shows the percentage of CD206 expression in CX3CR1+ microglia is higher in the CVOs than that of other brain regions (I). 10N, dorsal motor nucleus of vagus nerve; 12N, hypoglossal nucleus; AP, area postrema; Cx, cerebral cortex; D3V, dorsal 3rd ventricle; DG, dentate gyrus; fi, fimbria; ME, median eminence; MnPO, median preoptic area; MPA, medial preoptic area; OVLT, organum vasculosum of the lamina terminalis; SFO, subfornical organ; Sol, solitary nucleus; vhc, ventral hippocampal commissure; VMH, ventromedial hypothalamic nucleus. Scale bars = 10 (A) and 50 μm (G). Scale bars = 50 μm. Yellow and blue bars indicate the CVOs and non-CVO regions, respectively. Photographs are rearranged with permission from Elsevier B.V. (Takagi et al., 2017).
FIGURE 5 Activated state of microglia in the CVOs even under physiologically normal conditions. Microglia morphology in the CVOs, such as the OVLT and AP, is amoeboid, whereas in the medial preoptic area and cerebral cortex, it is dendritic (A–D). Quantitative analysis reveals shorter microglial cellular processes in the CVOs than other brain regions (E). The density of the CVOs microglia is significantly higher than that of other brain regions (F). Double-labeling immunohistochemistry shows that CX3CR1+ microglia express an M2 marker protein CD206 (arrowheads) in the SFO and AP (G,H). Quantitative analysis shows the percentage of CD206 expression in CX3CR1+ microglia is higher in the CVOs than that of other brain regions (I). 10N, dorsal motor nucleus of vagus nerve; 12N, hypoglossal nucleus; AP, area postrema; Cx, cerebral cortex; D3V, dorsal 3rd ventricle; DG, dentate gyrus; fi, fimbria; ME, median eminence; MnPO, median preoptic area; MPA, medial preoptic area; OVLT, organum vasculosum of the lamina terminalis; SFO, subfornical organ; Sol, solitary nucleus; vhc, ventral hippocampal commissure; VMH, ventromedial hypothalamic nucleus. Scale bars = 10 (A) and 50 μm (G). Scale bars = 50 μm. Yellow and blue bars indicate the CVOs and non-CVO regions, respectively. Photographs are rearranged with permission from Elsevier B.V. (Takagi et al., 2017).CC BY · PubMed Central
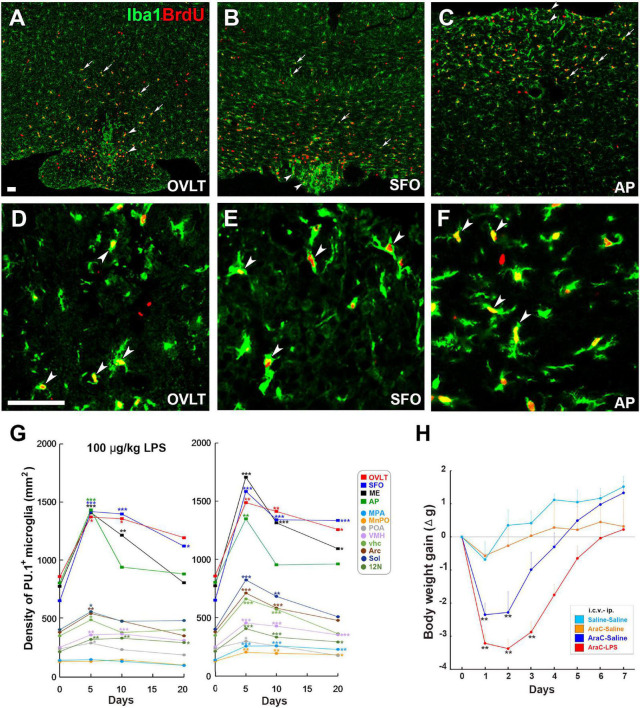
FIGURE 6 Remarkable increase in proliferation of microglia and macrophages in the CVOs and neighboring brain regions in adult mouse brain after LPS administration. Intraperitoneal administration of 100 μg/kg LPS induces a robust increase of Iba1+ BrdU+ proliferating microglia and macrophages in the OVLT (arrowheads) and medial preoptic area (MPA; arrows) (A), the SFO (arrowheads) and ventral hippocampal commissure (vhc; arrows) (B), and the AP (arrowheads) and solitary nucleus (Sol; arrows) (C). High magnification reveals many Iba1+ BrdU+ proliferating microglia and macrophages in the CVOs (D–F). Scale bars = 100 (A) and 50 μm (D). Photographs are rearranged with permission from Springer Nature (Furube et al., 2015, 2018). The density of PU.1+ microglia and macrophages is significantly elevated in the CVOs and neighboring brain regions on the 5th and 10th day after administration of 100 μg/kg and 1 mg/kg LPS, but returns to almost normal levels on the 20th day (G). The i.c.v. infusion of the mitotic inhibitor AraC significantly delays body weight recovery after 5 mg/kg administration (H). 10N, dorsal motor nucleus of vagus nerve; 12N, hypoglossal nucleus; AP, area postrema; fi, fimbria; MnPO, median preoptic area; MPA, medial preoptic area; OVLT, organum vasculosum of the lamina terminalis; SFO, subfornical organ; Sol, solitary nucleus; vhc, ventral hippocampal commissure; VMH, ventromedial hypothalamic nucleus. *p < 0.05, **p < 0.01, ***p 0.001 vs. the control by an ANOVA with Tukey’s post-hoc test. Graphs are rearranged with permission from Springer Nature [(A) Furube et al., 2018] and Elsevier B.V. [(B) Torii et al., 2022].
FIGURE 6 Remarkable increase in proliferation of microglia and macrophages in the CVOs and neighboring brain regions in adult mouse brain after LPS administration. Intraperitoneal administration of 100 μg/kg LPS induces a robust increase of Iba1+ BrdU+ proliferating microglia and macrophages in the OVLT (arrowheads) and medial preoptic area (MPA; arrows) (A), the SFO (arrowheads) and ventral hippocampal commissure (vhc; arrows) (B), and the AP (arrowheads) and solitary nucleus (Sol; arrows) (C). High magnification reveals many Iba1+ BrdU+ proliferating microglia and macrophages in the CVOs (D–F). Scale bars = 100 (A) and 50 μm (D). Photographs are rearranged with permission from Springer Nature (Furube et al., 2015, 2018). The density of PU.1+ microglia and macrophages is significantly elevated in the CVOs and neighboring brain regions on the 5th and 10th day after administration of 100 μg/kg and 1 mg/kg LPS, but returns to almost normal levels on the 20th day (G). The i.c.v. infusion of the mitotic inhibitor AraC significantly delays body weight recovery after 5 mg/kg administration (H). 10N, dorsal motor nucleus of vagus nerve; 12N, hypoglossal nucleus; AP, area postrema; fi, fimbria; MnPO, median preoptic area; MPA, medial preoptic area; OVLT, organum vasculosum of the lamina terminalis; SFO, subfornical organ; Sol, solitary nucleus; vhc, ventral hippocampal commissure; VMH, ventromedial hypothalamic nucleus. *p < 0.05, **p < 0.01, ***p 0.001 vs. the control by an ANOVA with Tukey’s post-hoc test. Graphs are rearranged with permission from Springer Nature [(A) Furube et al., 2018] and Elsevier B.V. [(B) Torii et al., 2022].CC BY · PubMed Central
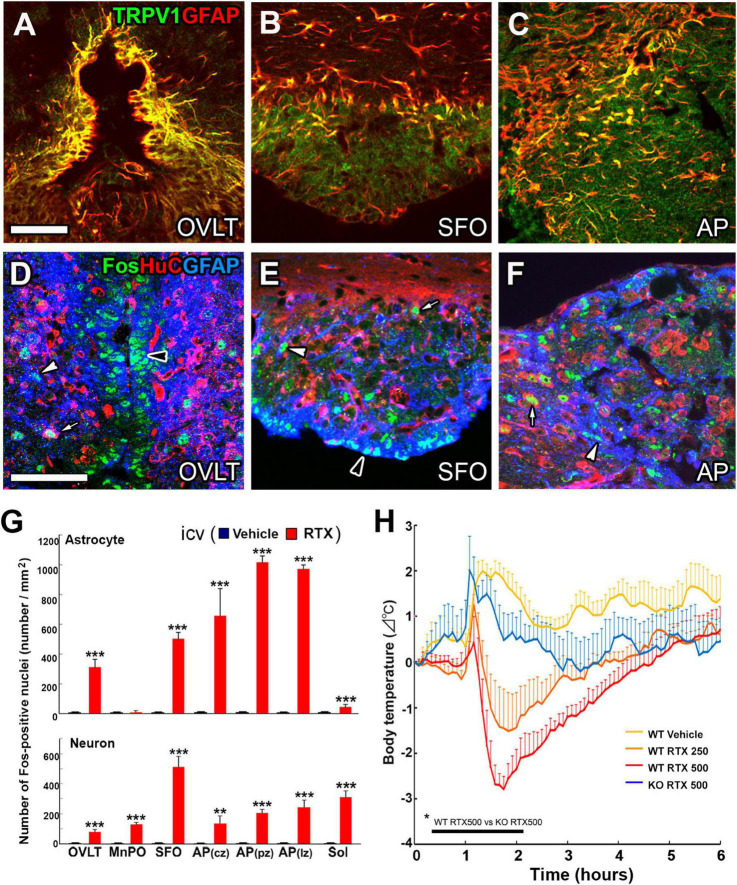
FIGURE 7 Prominent TRPV1 and TRPV1-dependent Fos expression at astrocytes in the CVOs of adult mouse brain and hypothermia by central activation of TRPV1. The expression of TRPV1 is prominent at GFAP+ astrocytes in the CVOs (A–C). The i.c.v. infusion of the TRPV1 agonist resiniferatoxin at 500 ng/kg causes prominent Fos expression at astrocytes rather than neurons in the CVOs (D–F). AP, area postrema; GFAP, glial fibrillar acidic protein; OVLT, organum vasculosum of the lamina terminalis; SFO, subfornical organ. Scale bars = 50 μm. Quantitative analysis shows central infusion of resiniferatoxin induces significant Fos expression at astrocytes preferentially in the CVOs and at neurons in the CVOs and neighboring brain regions (G). The i.c.v. infusion of the TRPV1 agonist resiniferatoxin induces hypothermia in a dose-dependent manner in WT mice, but not in TRPV1 KO mice (H). **p < 0.01, ***p0.001 between WT and TRPV1 KO mice with unpaired Student’s t-test (G) or an ANOVA with Tukey’s post-hoc-test (H). Photographs and graphs are rearranged with permission from John Wiley & Sons [(A–G) Mannari et al., 2013] and Springer Nature [(H) Yoshida et al., 2016].
FIGURE 7 Prominent TRPV1 and TRPV1-dependent Fos expression at astrocytes in the CVOs of adult mouse brain and hypothermia by central activation of TRPV1. The expression of TRPV1 is prominent at GFAP+ astrocytes in the CVOs (A–C). The i.c.v. infusion of the TRPV1 agonist resiniferatoxin at 500 ng/kg causes prominent Fos expression at astrocytes rather than neurons in the CVOs (D–F). AP, area postrema; GFAP, glial fibrillar acidic protein; OVLT, organum vasculosum of the lamina terminalis; SFO, subfornical organ. Scale bars = 50 μm. Quantitative analysis shows central infusion of resiniferatoxin induces significant Fos expression at astrocytes preferentially in the CVOs and at neurons in the CVOs and neighboring brain regions (G). The i.c.v. infusion of the TRPV1 agonist resiniferatoxin induces hypothermia in a dose-dependent manner in WT mice, but not in TRPV1 KO mice (H). **p < 0.01, ***p0.001 between WT and TRPV1 KO mice with unpaired Student’s t-test (G) or an ANOVA with Tukey’s post-hoc-test (H). Photographs and graphs are rearranged with permission from John Wiley & Sons [(A–G) Mannari et al., 2013] and Springer Nature [(H) Yoshida et al., 2016].CC BY · PubMed Central
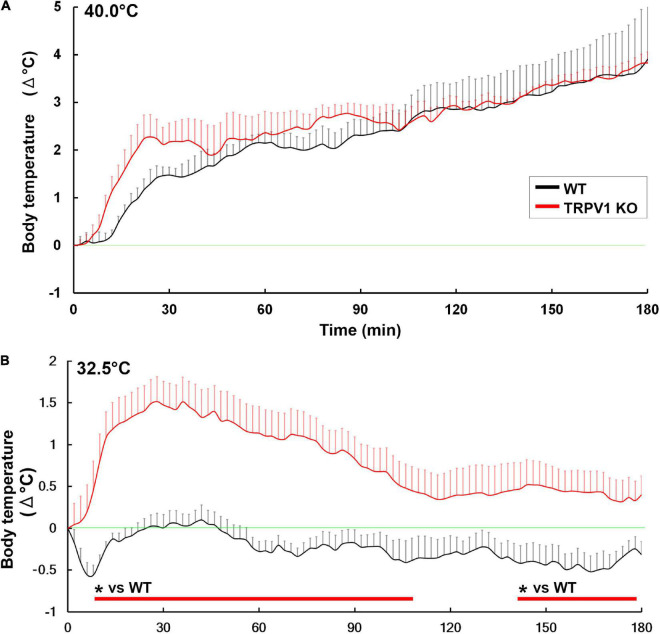
FIGURE 8 Abnormal hyperthermia in TRPV1 KO mice upon exposure to moderately warm ambient temperature. Both WT and TRPV1 KO mice showed similar increases in core body temperature upon exposure to 40°C (A). Upon exposure to 32.5°C, TRPV1 KO mice exhibited hyperthermia, but hyperthermia was not seen in WT mice (B). *p < 0.05 between WT and TRPV1 KO mice with unpaired Student’s t-test. Graphs are rearranged with permission from Springer Nature (Park et al., 2020).
FIGURE 8 Abnormal hyperthermia in TRPV1 KO mice upon exposure to moderately warm ambient temperature. Both WT and TRPV1 KO mice showed similar increases in core body temperature upon exposure to 40°C (A). Upon exposure to 32.5°C, TRPV1 KO mice exhibited hyperthermia, but hyperthermia was not seen in WT mice (B). *p < 0.05 between WT and TRPV1 KO mice with unpaired Student’s t-test. Graphs are rearranged with permission from Springer Nature (Park et al., 2020).CC BY · PubMed Central

Verification

Claims the paper makes

The claims and statistics of this paper haven’t been checked yet.

Run the check — free, no account needed. It reads the open-access text and checks the sources it cites.

A few free checks a day · papers already verified open instantly · results are public

Claims other papers make about this one

Each is checked against this paper’s own text: does it say what the citing paper says it does?

Self-check

Percentages, sums and reported differences re-computed from the paper’s own numbers.

The self-check needs the paper’s full text.

Citations

Cites

Show all 224 references

Research works printed but not linked: 1

  1. Ehrlich, 1885, Das Sauerstoff-Bedurfinis dews Oraganisms. Eine Farenanalytisch Studie, 69

Cited by

Sorted by citations

See all 66

Metadata

Authors
Miyata, S.
Affiliations
Kyoto Institute of Technology (JP)
Corresponding author
Miyata, Seiji
Venue
Frontiers in Neuroscience
Published
2022-10-06
Volume
16
Pages
991779-991779
ISSN
1662-453X (ISSN-L)
OpenAlex
W4302305006
Cited by
66
References
224
Citations by year
2026: 24 · 2025: 22 · 2024: 13 · 2023: 7
FWCI
1.08
Type
journal article
Language
en
Open access
Locations
  • Frontiers in Neuroscience (publishedVersion, cc-by)
  • PubMed Central (publishedVersion, cc-by)
  • PubMed (publishedVersion)
  • DOAJ (DOAJ: Directory of Open Access Journals) (submittedVersion, cc-by-sa)
Funders
Japan Society for the Promotion of Science (22K06456, 19K06921)
Topics
  • Life Sciences › Neuroscience › Neurology › Neuroinflammation and Neurodegeneration Mechanisms
  • Life Sciences › Neuroscience › Neurology › Barrier Structure and Function Studies
  • Health Sciences › Medicine › Critical Care and Intensive Care Medicine › Thermal Regulation in Medicine
Keywords
circumventricular organs, blood-brain barrier, glial cells, tanycytes, astrocytes, microglia, macrophages, TLR2, TLR4, lipopolysaccharide, neuroinflammation, sickness behavior, fever, microglial proliferation, TRPV1, Na+/Ca2+ exchanger, thermoregulation, fluid homeostasis, transcytosis, cerebrospinal fluid, hypothalamus, medulla oblongata

About these checks

Registry, retraction, Cites and statistics results are computed, not judged, with one exception: a printed reference that no index lists is read once by a model before it counts as a citation error. Claims are extracted by a model and kept only when their quote appears verbatim in the text; each cited source is then checked, with a model’s help, for whether it says what the claim relies on. Those verdicts can be wrong — read the claim’s quote and the cited source before relying on one.

Statistics and arithmetic are recomputed, not judged.

Confidence bands are shown only for fields calibrated on our annotated test set. None is calibrated yet, so no band is shown.

What counts as a claim ›How we measure confidence ›How we check this ›

Are you an author, or do you see a problem with this page? Request a review