

The DOI matches its Crossref record; 67 of the 67 references it cites were found in a registry or an index.
Frontotemporal dementia: does structural MRI-based clustering match clinical syndromes?
Open accessAbstract
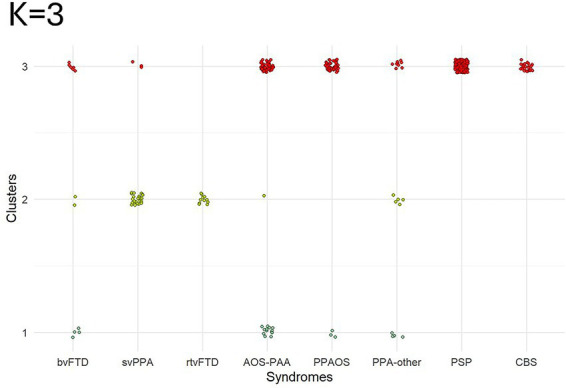
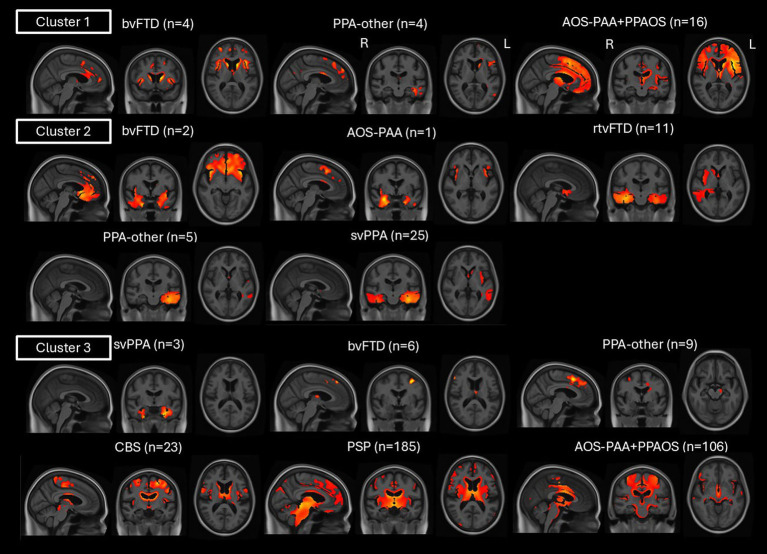
Background: Frontotemporal dementia is an umbrella term that encompasses several clinical syndromes with impaired behavioral, language, and motor functions. These syndromes show considerable overlap in clinical features and imaging patterns. Therefore, there is a need to investigate the syndromic heterogeneity in FTD using unbiased data-driven approaches. Methods: We used data-driven clustering analysis of structural magnetic resonance imaging (MRI) data on 400 patients with clinical FTD diagnoses [behavioral variant of frontotemporal dementia (bvFTD), semantic variant of primary progressive aphasia (svPPA), right temporal variant of frontotemporal dementia (rtvFTD), apraxia of speech with agrammatic aphasia (AOS-PAA), primary progressive apraxia of speech (PPAOS), progressive supranuclear palsy (PSP), corticobasal syndrome (CBS) and primary progressive aphasia who did not fit into the other diagnostic categories (PPA-other)]. MR images were w-scored relative to cognitively unimpaired individuals, and principal component analysis was performed. A clustering ensemble approach, including hierarchical algorithms, was applied to the MR-based principal components, and imaging and clinical characteristics of the clusters were investigated. Various numbers of clusters ( K = 2, 3, or 4) were evaluated. Results: The K = 3 solution offered the most clinically meaningful separation of FTD syndromes. The first cluster captured mostly frontal MRI abnormalities related to the speech, language and behavioral clinical dimensions, including patients with AOS-PAA, PPAOS, PPA-other, and bvFTD. The second cluster captured mostly temporal abnormalities and included mainly patients with svPPA and rtvFTD, but also bvFTD, AOS-PAA, and PPA-other. The third cluster captured cortical and subcortical atrophy, particularly in the midbrain, and included atypical Parkinsonian syndromes, with all PSP and CBS patients captured in this cluster, as well as most PPAOS patients. Considerable overlap of clinical syndromes was noted across these clusters, whereby patients with AOS-PAA, svPPA, PPA-other, and bvFTD were captured in more than one cluster. Discussion: Our findings highlight heterogeneity in FTD, which mainly exists along three axes: speech, language and behavioral deficits reflecting frontal atrophy, language deficits reflecting temporal atrophy, and motor and motor speech deficits reflecting mostly midbrain and subcortical atrophy, with cortical involvement.
Overview
The claims and statistics of this paper haven’t been checked yet.
Free: it reads the open-access text and checks the first 5 claims that cite a source we can check. Create a free account to check every claim.
Integrity signals
Registry
Cites
Statistics
Figures



Verification
Claims the paper makes
The claims and statistics of this paper haven’t been checked yet.
Free: it reads the open-access text and checks the first 5 claims that cite a source we can check. Create a free account to check every claim.
Self-check
Percentages, sums and reported differences re-computed from the paper’s own numbers.
The self-check needs the paper’s full text.
Citations
Cites
The Montreal Cognitive Assessment, MoCA: a brief screening tool for mild cognitive impairment
Nasreddine, Z. S., Phillips, N. A., Bédirian, V., Charbonneau, S., Whitehead, V., Collin, I., Cummings, J. L., & Chertkow, H. (2005) · Journal of the American Geriatrics Society · doi:10.1111/j.1532-5415.2005.53221.x · Cited by 25,553
Hubert, L., & Arabie, P. (1985) · Journal of Classification · doi:10.1007/bf01908075 · Cited by 8,219
Ashburner, J., & Friston, K. J. (2005) · NeuroImage · doi:10.1016/j.neuroimage.2005.02.018 · Cited by 7,507
Sensitivity of revised diagnostic criteria for the behavioural variant of frontotemporal dementia
Rascovsky, K., Hodges, J. R., Knopman, D., Mendez, M. F., Kramer, J. H., Neuhaus, J., van Swieten, J. C., Seelaar, H., Dopper, E. G. P., Onyike, C. U., et al. (2011) · Brain · doi:10.1093/brain/awr179 · Cited by 5,221
Self-citationClassification of primary progressive aphasia and its variants
Gorno-Tempini, M. L., Hillis, A. E., Weintraub, S., Kertesz, A., Mendez, M., Cappa, S. F., Ogar, J. M., Rohrer, J. D., Black, S., Boeve, B. F., et al. (2011) · Neurology · doi:10.1212/wnl.0b013e31821103e6 · Cited by 5,141
Frontotemporal lobar degeneration: A consensus on clinical diagnostic criteria
Neary, D., Snowden, J. S., Gustafson, L., Passant, U., Stuss, D., Black, S., Freedman, M., Kertesz, A., Robert, P. H., Albert, M., et al. (1998) · Neurology · doi:10.1212/wnl.51.6.1546 · Cited by 5,047
The FAB: A frontal assessment battery at bedside
Dubois, B., Slachevsky, A., Litvan, I., & Pillon, B. (2000) · Neurology · doi:10.1212/wnl.55.11.1621 · Cited by 3,913
Clinical diagnosis of progressive supranuclear palsy: The movement disorder society criteria
Höglinger, G. U., Respondek, G., Stamelou, M., Kurz, C., Josephs, K. A., Lang, A. E., Mollenhauer, B., Müller, U., Nilsson, C., Whitwell, J. L., et al. (2017) · Movement Disorders · doi:10.1002/mds.26987 · Cited by 2,359
Self-citationCriteria for the diagnosis of corticobasal degeneration
Armstrong, M. J., Litvan, I., Lang, A. E., Bak, T. H., Bhatia, K. P., Borroni, B., Boxer, A. L., Dickson, D. W., Grossman, M., Hallett, M., et al. (2013) · Neurology · doi:10.1212/wnl.0b013e31827f0fd1 · Cited by 1,904
Self-citationSEMANTIC DEMENTIA: PROGRESSIVE FLUENT APHASIA WITH TEMPORAL LOBE ATROPHY
HODGES, J. R., PATTERSON, K., OXBURY, S., & FUNNELL, E. (1992) · Brain · doi:10.1093/brain/115.6.1783 · Cited by 1,710
Research works printed but not linked: 2
- Howard, 1992, The Pyramids and Palm Trees Test: A Test of Semantic Access From Words and Picture
- Kertesz, 2007, Western Aphasia Battery (Revised)
Cited by
Still being checked.
Metadata
- Authors
- Singh-Reilly, N., Sintini, I., Ali, F., Duffy, J. R., Clark, H. M., Utianski, R. L., Meade, G., Machulda, M. M., Satoh, R., Lowe, V. J., Josephs, K. A., & Whitwell, J. L.
- Affiliations
- Department of Radiology, Mayo Clinic
- Mayo Clinic (US)
- Corresponding author
- Whitwell, Jennifer L.
- ORCID
- Venue
- Frontiers in Neuroscience
- Publisher
- Frontiers Media SA
- Published
- 2026-05-05
- Volume
- 20
- Pages
- 1771092-1771092
- ISSN
- 1662-453X (ISSN-L)
- PMC
- PMC13184375
- OpenAlex
- W7160274201
- Cited by
- 0
- References
- 67
- FWCI
- 0.00
- Type
- journal article
- Language
- en
- Open access
- gold
- doi.org
- Licence
- Locations
- Frontiers in Neuroscience (publishedVersion, cc-by)
- PubMed (publishedVersion)
- PubMed Central (publishedVersion, cc-by)
- DOAJ (DOAJ: Directory of Open Access Journals) (submittedVersion, cc-by-sa)
- Funders
- National Institutes of Health
- Topics
- Health Sciences › Medicine › Psychiatry and Mental health › Dementia and Cognitive Impairment Research
- Health Sciences › Medicine › Clinical Neurology › Amyotrophic Lateral Sclerosis Research
- Life Sciences › Neuroscience › Cellular and Molecular Neuroscience › Alzheimer's disease research and treatments
- Keywords
- frontotemporal dementia, behavioral variant frontotemporal dementia, semantic dementia, primary progressive apraxia of speech, progressive supranuclear palsy, corticobasal syndrome, atypical parkinsonism, frontal lobe atrophy, temporal lobe atrophy, midbrain atrophy, subcortical atrophy, speech and language disorders, behavioral deficits
About these checks
Registry, retraction, Cites and statistics results are computed, not judged, with one exception: a printed reference that no index lists is read once by a model before it counts as a citation error. Claims are extracted by a model and kept only when their quote appears verbatim in the text; each cited source is then checked, with a model’s help, for whether it says what the claim relies on. Those verdicts can be wrong — read the claim’s quote and the cited source before relying on one.
Statistics and arithmetic are recomputed, not judged.
Confidence bands are shown only for fields calibrated on our annotated test set. None is calibrated yet, so no band is shown.
What counts as a claim ›How we measure confidence ›How we check this ›
Are you an author, or do you see a problem with this page? Request a review
How to cite
Cite CoChat for the checks on this page, and the paper for its own findings.
- This page
- CoChat. (2026). Citation check: Frontotemporal dementia: does structural MRI-based clustering match clinical syndromes? https://app.cochat.ai/papers/10.3389/fnins.2026.1771092
- The paper
- Singh-Reilly, N., Sintini, I., Ali, F., Duffy, J. R., Clark, H. M., Utianski, R. L., Meade, G., Machulda, M. M., Satoh, R., Lowe, V. J., Josephs, K. A., & Whitwell, J. L. (2026). Frontotemporal dementia: does structural MRI-based clustering match clinical syndromes? Frontiers in Neuroscience. https://doi.org/10.3389/fnins.2026.1771092
Data sources
Bibliographic data: Semantic Scholar, OpenAlex, Crossref.
Contains information from the Semantic Scholar Academic Graph Datasets, made available under the ODC Attribution License (ODC-BY 1.0).
Semantic Scholar’s data is described in: Kinney, R., et al. (2023). The Semantic Scholar Open Data Platform. arXiv:2301.10140.
