Cited by 77

The DOI matches its Crossref record; 6 of the 6 references it cites were found in a registry or an index.

MicroRNA-212-5p Prevents Dopaminergic Neuron Death by Inhibiting SIRT2 in MPTP-Induced Mouse Model of Parkinson’s Disease

Sun, Sifan, Han, Xiaojuan, Li, Xueting, Song, Qiqi, Lu, Ming, Jia, Miaomiao, Ding, Jianhua, Hu, Gang·2018·Frontiers in Molecular Neuroscience

Overview

The claims and statistics of this paper haven’t been checked yet.

Run the check — free, no account needed. It reads the open-access text and checks the sources it cites.

A few free checks a day · papers already verified open instantly · results are public

Integrity signals

Registry

Crossref · 10.3389/fnmol.2018.00381

Cites

6 of 6 references verified0 citation errors · 0 not checkable

Statistics

Figures

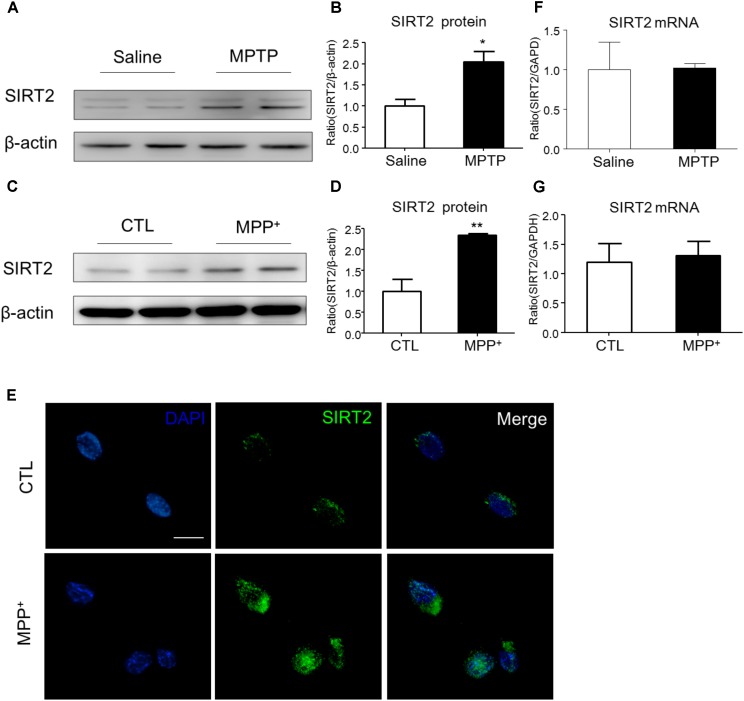
FIGURE 1 The expression patterns of SIRT2 in PD model. (A–D) Western blotting analysis showed that SIRT2 protein level increased by MPTP treatment or MPP+ stimulating, respectively. (E) Immunohistochemistry staining showed a significant increment of SIRT2 in SH-SY5Y cells by MPP+ stimulation, compared with controls. Scale bar: 40 μm. (F,G) Quantitative RT-PCR analysis for SIRT2 mRNA level showed no significant difference in midbrain tissues and SH-SY5Y cells under treatment. Data are presented as the mean ± SEM for each group of five mice or three independent in vitro experiments. ∗p < 0.05, ∗∗p < 0.01 versus corresponding control group.
FIGURE 1 The expression patterns of SIRT2 in PD model. (A–D) Western blotting analysis showed that SIRT2 protein level increased by MPTP treatment or MPP+ stimulating, respectively. (E) Immunohistochemistry staining showed a significant increment of SIRT2 in SH-SY5Y cells by MPP+ stimulation, compared with controls. Scale bar: 40 μm. (F,G) Quantitative RT-PCR analysis for SIRT2 mRNA level showed no significant difference in midbrain tissues and SH-SY5Y cells under treatment. Data are presented as the mean ± SEM for each group of five mice or three independent in vitro experiments. ∗p < 0.05, ∗∗p < 0.01 versus corresponding control group.CC BY · PubMed Central
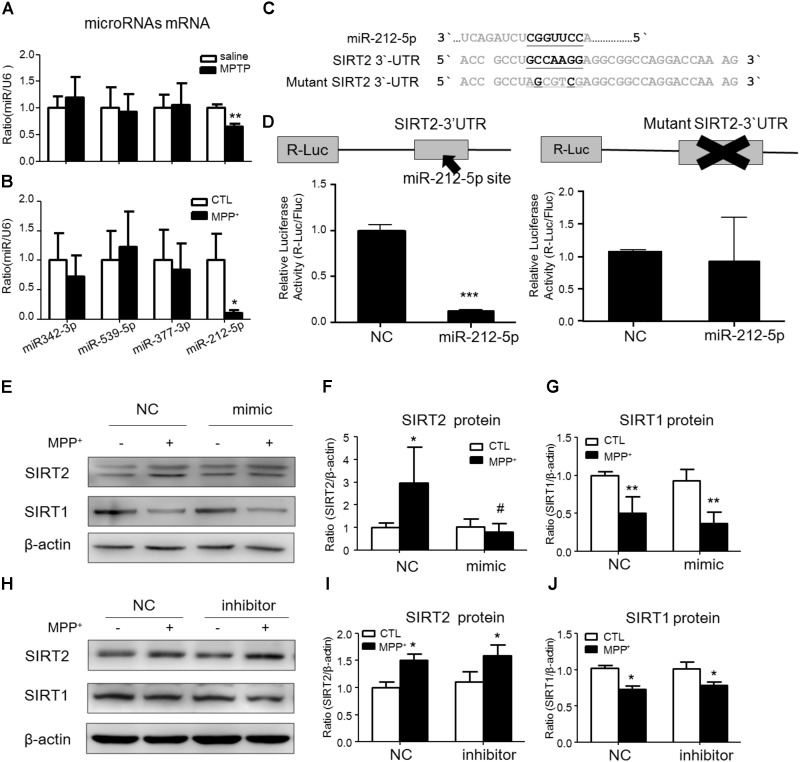
FIGURE 2 SIRT2 is a target gene of miR-212-5p. (A,B) Quantitative RT-PCR analysis detected some predicted SIRT2-associated microRNAs expression. Results showed miR-212-5p significantly decreased in PD model both in vivo and in vitro. (C) The predicted binding sites of miR-212-5p in the 3′UTR of SIRT2, and schematic description of the base-pairing interaction between miR-212-5p and SIRT2 mRNA. (D) Luciferase reporter assays confirm that SIRT2 is a direct target gene of miR-212-5p in HEK293T cells. (E–G) Transfection of miR-212-5p into SH-SY5Y cells significantly reduced SIRT2 expression but failed to affect SIRT1 expression. (H–J) Anti-miR-212-5p up-regulated SIRT2 expression without significant difference, but had no effect on SIRT1 expression. Data are presented as the mean ± SEM from three independent experiments. ∗p < 0.05, ∗∗p < 0.01, ∗∗∗p < 0.001 versus control or NC-control group; #p < 0.05 versus NC plus MPP+ group. NC, negative control.
FIGURE 2 SIRT2 is a target gene of miR-212-5p. (A,B) Quantitative RT-PCR analysis detected some predicted SIRT2-associated microRNAs expression. Results showed miR-212-5p significantly decreased in PD model both in vivo and in vitro. (C) The predicted binding sites of miR-212-5p in the 3′UTR of SIRT2, and schematic description of the base-pairing interaction between miR-212-5p and SIRT2 mRNA. (D) Luciferase reporter assays confirm that SIRT2 is a direct target gene of miR-212-5p in HEK293T cells. (E–G) Transfection of miR-212-5p into SH-SY5Y cells significantly reduced SIRT2 expression but failed to affect SIRT1 expression. (H–J) Anti-miR-212-5p up-regulated SIRT2 expression without significant difference, but had no effect on SIRT1 expression. Data are presented as the mean ± SEM from three independent experiments. ∗p < 0.05, ∗∗p < 0.01, ∗∗∗p < 0.001 versus control or NC-control group; #p < 0.05 versus NC plus MPP+ group. NC, negative control.CC BY · PubMed Central
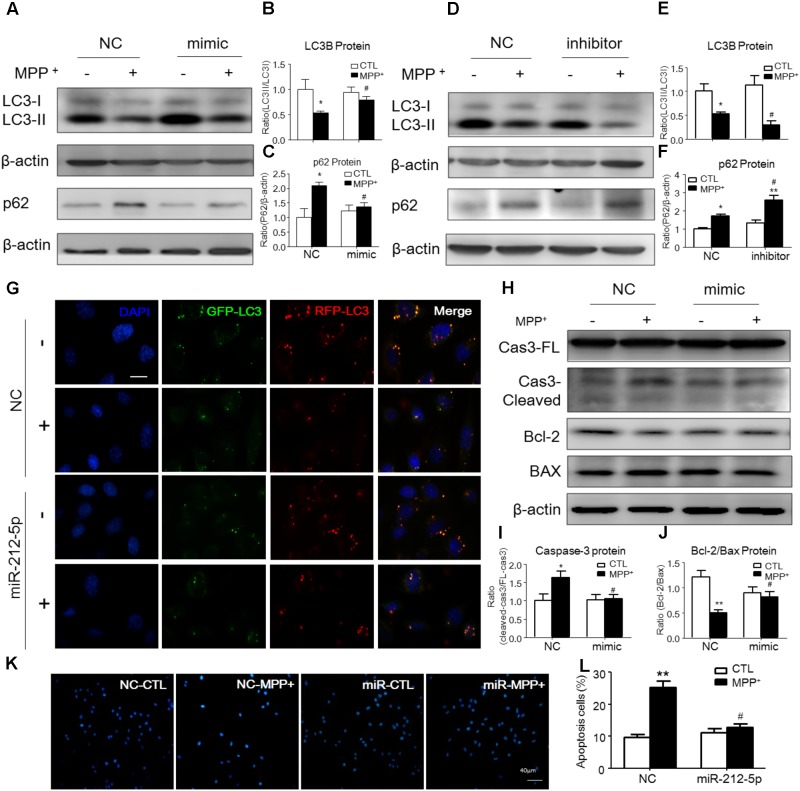
FIGURE 3 MiR-212-5p promotes autophagy and inhibits apoptosis in SH-SY5Y cells. (A–C) Western blotting and quantitative analysis of LC3B and P62 revealed that transfection of miR-212-5p into SH-SY5Y cells activated autophagy. (D–F) In contrast, miR-212-5p inhibitor indeed blocked autophagy, which showed by Western blotting and quantitative analysis of autophagy markers. (G) Double immunofluorescence of GFP-LC3B (Green) and RFP-LC3B (Red). MPP+ blocked the autophagy flux in SH-SY5Y cells, which was reversed by miR-212-5p transfection. Scar bar: 40 μm. (H–J) Transfection of miR-212-5p into SH-SY5Y cells reduced apoptosis, Western blotting and quantitative analysis of cleaved caspase-3, Bcl2 and BAX. (K,L) Apoptotic cells were stained by Hoechst 33342 and analysis of positive cells. Scale bar: 80 μm. Data is presented as the mean ± SEM from three independent experiments. ∗p < 0.05, ∗∗p < 0.01, ∗∗∗p < 0.001 versus control or NC-control group; #p < 0.05, ##p < 0.01, ###p < 0.01 versus NC plus MPP+ group.
FIGURE 3 MiR-212-5p promotes autophagy and inhibits apoptosis in SH-SY5Y cells. (A–C) Western blotting and quantitative analysis of LC3B and P62 revealed that transfection of miR-212-5p into SH-SY5Y cells activated autophagy. (D–F) In contrast, miR-212-5p inhibitor indeed blocked autophagy, which showed by Western blotting and quantitative analysis of autophagy markers. (G) Double immunofluorescence of GFP-LC3B (Green) and RFP-LC3B (Red). MPP+ blocked the autophagy flux in SH-SY5Y cells, which was reversed by miR-212-5p transfection. Scar bar: 40 μm. (H–J) Transfection of miR-212-5p into SH-SY5Y cells reduced apoptosis, Western blotting and quantitative analysis of cleaved caspase-3, Bcl2 and BAX. (K,L) Apoptotic cells were stained by Hoechst 33342 and analysis of positive cells. Scale bar: 80 μm. Data is presented as the mean ± SEM from three independent experiments. ∗p < 0.05, ∗∗p < 0.01, ∗∗∗p < 0.001 versus control or NC-control group; #p < 0.05, ##p < 0.01, ###p < 0.01 versus NC plus MPP+ group.CC BY · PubMed Central
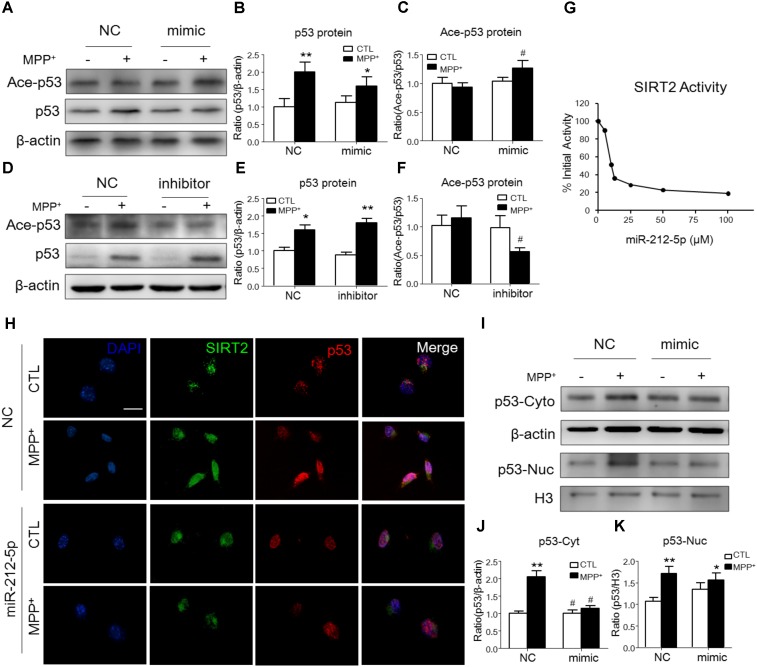
FIGURE 4 MiR-212-5p regulates p53 sub-localization via SIRT2 activity in PD model. (A,B) Western blotting and quantitative analysis showed that the total p53 expression was highly increased by MPP+ stimulating, which was somehow inhibited by miR-212-5p mimic treatment. (D,E) In contrast, miR-212-5p inhibitor indeed enhanced the increased total p53 expression. Since p53 is a key deacetylation substrate of SIRT2, we detected the acetylation of p53 by Western blotting. Results showed that miR-212-5p regulated the level of acetylated p53 (C,F). (G) SIRT2 activity assay revealed that miR-2125p could suppress the deacetylation potential of SIRT2. (H) Double immunofluorescence of SIRT2 (green) and p53 (red). Scale bar: 40 μm. Consistent with previous results, SIRT2 and p53 were highly increased under MPP+ treatment, which was inhibited by miR-212-5p transfection. (I–K) Western blotting and quantitative analysis showed that p53 was up-regulated both in cytoplasm and nucleus. miR-212-5p transfection suppressed the expression of p53, especially in cytoplasm. ∗p < 0.05, ∗∗p < 0.01 versus control or NC-control group; #p < 0.05, ##p < 0.01 versus NC plus MPP+ group.
FIGURE 4 MiR-212-5p regulates p53 sub-localization via SIRT2 activity in PD model. (A,B) Western blotting and quantitative analysis showed that the total p53 expression was highly increased by MPP+ stimulating, which was somehow inhibited by miR-212-5p mimic treatment. (D,E) In contrast, miR-212-5p inhibitor indeed enhanced the increased total p53 expression. Since p53 is a key deacetylation substrate of SIRT2, we detected the acetylation of p53 by Western blotting. Results showed that miR-212-5p regulated the level of acetylated p53 (C,F). (G) SIRT2 activity assay revealed that miR-2125p could suppress the deacetylation potential of SIRT2. (H) Double immunofluorescence of SIRT2 (green) and p53 (red). Scale bar: 40 μm. Consistent with previous results, SIRT2 and p53 were highly increased under MPP+ treatment, which was inhibited by miR-212-5p transfection. (I–K) Western blotting and quantitative analysis showed that p53 was up-regulated both in cytoplasm and nucleus. miR-212-5p transfection suppressed the expression of p53, especially in cytoplasm. ∗p < 0.05, ∗∗p < 0.01 versus control or NC-control group; #p < 0.05, ##p < 0.01 versus NC plus MPP+ group.CC BY · PubMed Central
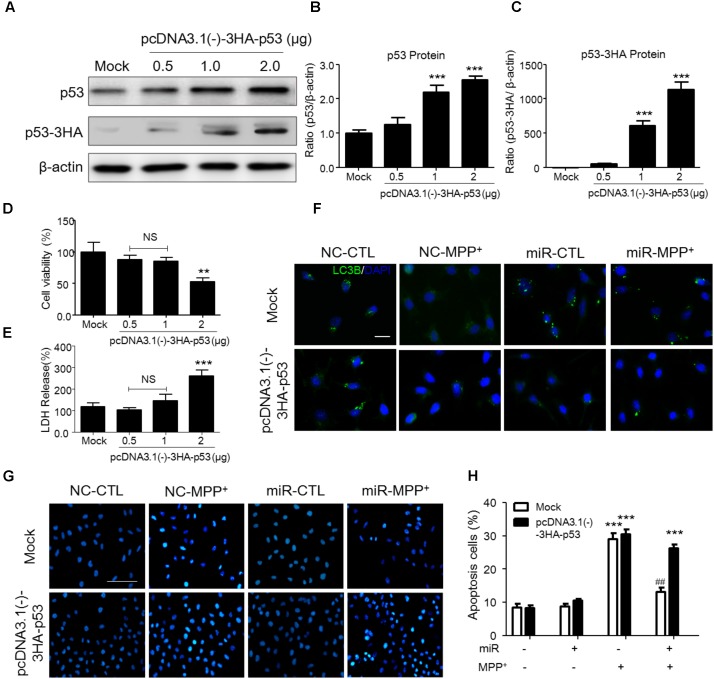
FIGURE 5 P53 transfection abolished the SIRT2-related programmed cell death in SH-SY5Y cells. (A–C) According to p53 as a key transfactor dealing with the programmed cell death, to detect the realistic role of p53 regulated by SIRT2 in this study, we transfected pcDNA3.0-Flag-p53 plasmid to SH-SY5Y cells. Western blotting and quantitative analysis showed that 1 μg and 2 μg plasmid transfection highly increased the p53 expression. (D,E) CCK-8 and LDH release assay showed that 0.5 μg and 1 μg plasmid transfection had no effects on cell viability. Thus, we transfected 1 μg pcDNA3.0-Flag-p53 plasmid to SH-SY5Y cells in the further study. (F) Immunohistochemistry staining showed a significant increment of LC3 (green) under MPP+ stimulation could suppressed by miR-212-5p transfection, which was blocked by p53 overexpression. Scar bar: 40 μm. (G,H) Apoptotic cells were stained by Hoechst 33342 and analysis of positive cells. MiR-212-5p decreased the apoptotic cells by MPP+ stimulation, which was blocked by p53 overexpression. Scale bar: 80 μm. ∗p < 0.05, ∗∗p < 0.01, ∗∗∗p < 0.01 versus Mock or Mock with NC control group; ##p < 0.01 versus pcDNA3.0-Flag-p53 plasmid plus MPP+ group.
FIGURE 5 P53 transfection abolished the SIRT2-related programmed cell death in SH-SY5Y cells. (A–C) According to p53 as a key transfactor dealing with the programmed cell death, to detect the realistic role of p53 regulated by SIRT2 in this study, we transfected pcDNA3.0-Flag-p53 plasmid to SH-SY5Y cells. Western blotting and quantitative analysis showed that 1 μg and 2 μg plasmid transfection highly increased the p53 expression. (D,E) CCK-8 and LDH release assay showed that 0.5 μg and 1 μg plasmid transfection had no effects on cell viability. Thus, we transfected 1 μg pcDNA3.0-Flag-p53 plasmid to SH-SY5Y cells in the further study. (F) Immunohistochemistry staining showed a significant increment of LC3 (green) under MPP+ stimulation could suppressed by miR-212-5p transfection, which was blocked by p53 overexpression. Scar bar: 40 μm. (G,H) Apoptotic cells were stained by Hoechst 33342 and analysis of positive cells. MiR-212-5p decreased the apoptotic cells by MPP+ stimulation, which was blocked by p53 overexpression. Scale bar: 80 μm. ∗p < 0.05, ∗∗p < 0.01, ∗∗∗p < 0.01 versus Mock or Mock with NC control group; ##p < 0.01 versus pcDNA3.0-Flag-p53 plasmid plus MPP+ group.CC BY · PubMed Central
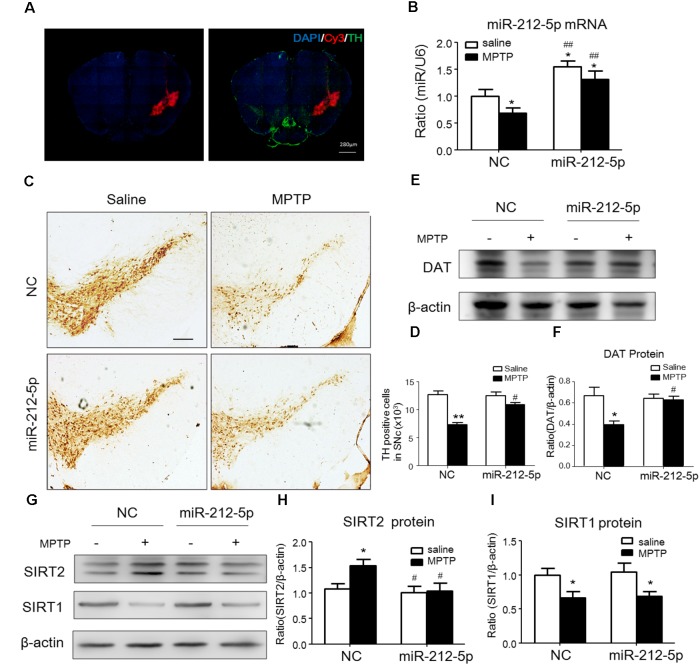
FIGURE 6 MiR-212-5p decreases SIRT2 expression and attenuates DA neuron loss in vivo. (A) Fluorescent image of Cy3-labeled miR-212-5p (red) and TH-marked neurons (green) was observed in the SNc of mice. (B) RT-PCR analysis of miR-212-5p. (C,E) Representative microphotographs and quantitative analysis of TH in the SNc of MPTP injured mice. Scar bar: 200 μm. (D,F) Western blotting and quantitative analysis showed that DAT was decreased by MPTP-induced PD mice model, which was reversed by miR-212-5p treatment. (G,H) Western blotting and quantitative analysis of SIRT2 and SIRT1. Consistent with the previous founds, SIRT2 was increased and SIRT1 was decreased in MPTP-induce PD mice model. MiR-212-5p treatment decreased SIRT2 expression with no influence on SIRT1. Data are presented as the mean ± SEM for each group of five mice, Two-way ANOVA, ∗p < 0.05, ∗∗p < 0.01 versus NC with saline treatment; #p < 0.05, ##p < 0.01, ###p < 0.001 versus NC with MPTP-treatment.
FIGURE 6 MiR-212-5p decreases SIRT2 expression and attenuates DA neuron loss in vivo. (A) Fluorescent image of Cy3-labeled miR-212-5p (red) and TH-marked neurons (green) was observed in the SNc of mice. (B) RT-PCR analysis of miR-212-5p. (C,E) Representative microphotographs and quantitative analysis of TH in the SNc of MPTP injured mice. Scar bar: 200 μm. (D,F) Western blotting and quantitative analysis showed that DAT was decreased by MPTP-induced PD mice model, which was reversed by miR-212-5p treatment. (G,H) Western blotting and quantitative analysis of SIRT2 and SIRT1. Consistent with the previous founds, SIRT2 was increased and SIRT1 was decreased in MPTP-induce PD mice model. MiR-212-5p treatment decreased SIRT2 expression with no influence on SIRT1. Data are presented as the mean ± SEM for each group of five mice, Two-way ANOVA, ∗p < 0.05, ∗∗p < 0.01 versus NC with saline treatment; #p < 0.05, ##p < 0.01, ###p < 0.001 versus NC with MPTP-treatment.CC BY · PubMed Central
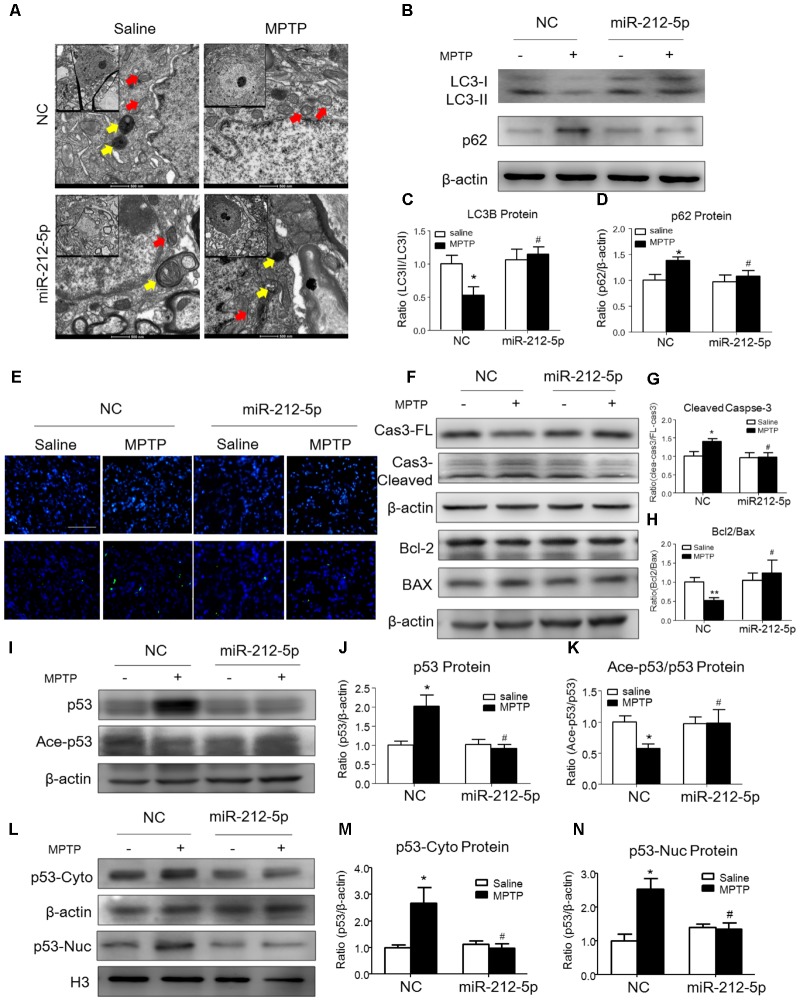
FIGURE 7 MiR-212-5p promotes p53-dependent autophagy and inhibits apoptosis in vivo. (A) Transmission electron microscope of midbrain in mice. Yellow arrow means autolysosome, red arrow means mitochondrion. (B–D) Representative immunoblots and quantification of midbrain extracts for analysis of LC3B and P62 in mice of both normal and MPTP-treatment. (E) TUNEL staining of midbrain in mice. (F–H) Representative immunoblots and quantification of midbrain extracts for analysis of cleaved caspase-3, Bcl-2 and BAX. (I–K) Western blotting and quantitative analysis showed that miR-212-5p decreased total p53 and increased ace-p53 expression in the midbrain of mice. (L–N) Western blotting and quantitative analysis revealed that miR-212-5p decreased both cytosolic and nuclear p53 expression. Data are presented as the mean ± SEM for each group of five mice. ∗p < 0.05, ∗∗p < 0.01 versus NC with saline treatment; #p < 0.05, ##p < 0.01 versus NC with MPTP-treatment.
FIGURE 7 MiR-212-5p promotes p53-dependent autophagy and inhibits apoptosis in vivo. (A) Transmission electron microscope of midbrain in mice. Yellow arrow means autolysosome, red arrow means mitochondrion. (B–D) Representative immunoblots and quantification of midbrain extracts for analysis of LC3B and P62 in mice of both normal and MPTP-treatment. (E) TUNEL staining of midbrain in mice. (F–H) Representative immunoblots and quantification of midbrain extracts for analysis of cleaved caspase-3, Bcl-2 and BAX. (I–K) Western blotting and quantitative analysis showed that miR-212-5p decreased total p53 and increased ace-p53 expression in the midbrain of mice. (L–N) Western blotting and quantitative analysis revealed that miR-212-5p decreased both cytosolic and nuclear p53 expression. Data are presented as the mean ± SEM for each group of five mice. ∗p < 0.05, ∗∗p < 0.01 versus NC with saline treatment; #p < 0.05, ##p < 0.01 versus NC with MPTP-treatment.CC BY · PubMed Central
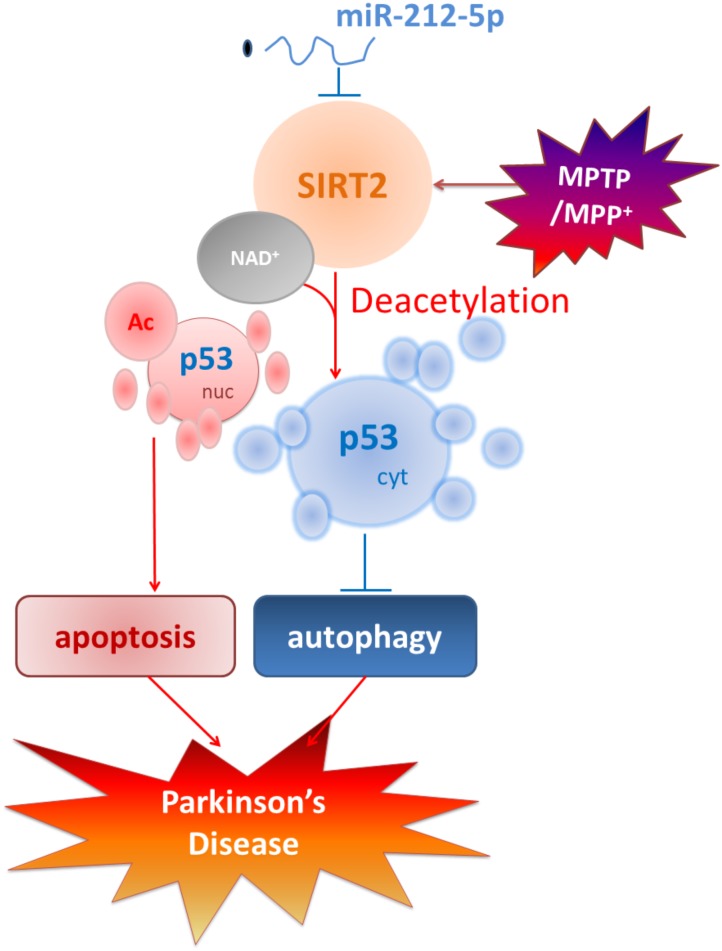
FIGURE 8 Schematic illustration demonstrates that miR-212-5p prevents dopaminergic neuron death in the pathogenesis of PD by inhibiting SIRT2. As we find, miR-212-5p is downregulated and specifically regulate the translation of SIRT2 in the midbrain or SH-SY5Y cells of PD experimental models. Furthermore, inhibition of SIRT2 promotes autophagy by decreases cytoplasmic p53 expression. According to p53 is a key deacetylation substrate of SIRT2 and plays a vital role in programmed cell death, regulation of p53 dual function by post-transcriptional regulation of SIRT2 is a potential therapy in PD.
FIGURE 8 Schematic illustration demonstrates that miR-212-5p prevents dopaminergic neuron death in the pathogenesis of PD by inhibiting SIRT2. As we find, miR-212-5p is downregulated and specifically regulate the translation of SIRT2 in the midbrain or SH-SY5Y cells of PD experimental models. Furthermore, inhibition of SIRT2 promotes autophagy by decreases cytoplasmic p53 expression. According to p53 is a key deacetylation substrate of SIRT2 and plays a vital role in programmed cell death, regulation of p53 dual function by post-transcriptional regulation of SIRT2 is a potential therapy in PD.CC BY · PubMed Central

Verification

Claims the paper makes

The claims and statistics of this paper haven’t been checked yet.

Run the check — free, no account needed. It reads the open-access text and checks the sources it cites.

A few free checks a day · papers already verified open instantly · results are public

Claims other papers make about this one

Each is checked against this paper’s own text: does it say what the citing paper says it does?

Self-check

Percentages, sums and reported differences re-computed from the paper’s own numbers.

The self-check needs the paper’s full text.

Citations

Cites

Show all 6 references

Research works printed but not linked: 42

  1. Akbulut, 2015, The role of melatonin, sirtuin2 and FoXO1 transcription factor in the aging process of colon in male rats., Biogerontology, 16, 99, 10.1007/s10522-014-9540-1 · DOI
  2. Beirowski, 2011, Sir-two-homolog 2 (Sirt2) modulates peripheral myelination through polarity protein Par-3/atypical protein kinase C (aPKC) signaling., Proc. Natl. Acad. Sci. U.S.A., 108, E952, 10.1073/pnas.1104969108 · DOI
  3. Chen, 2015, The sirtuin-2 inhibitor AK7 is neuroprotective in models of Parkinson’s disease but not amyotrophic lateral sclerosis and cerebral ischemia., PLoS One, 10, 10.1371/journal.pone.0116919 · DOI
  4. Cui, 2014, Discovery of potent and selective sirtuin 2 (SIRT2) inhibitors using a fragment-based approach., J. Med. Chem., 57, 8340, 10.1021/jm500777s · DOI
  5. de Oliveira, 2017, The mechanism of sirtuin 2-mediated exacerbation of alpha-synuclein toxicity in models of Parkinson disease., PLoS Biol., 15, 10.1371/journal.pbio.2000374 · DOI
  6. Dexter, 2013, Parkinson disease: from pathology to molecular disease mechanisms., Free Radic. Biol. Med., 62, 132, 10.1016/j.freeradbiomed.2013.01.018 · DOI
  7. Dix, 2017, Specific and novel microRNAs are regulated as response to fungal infection in human dendritic cells., Front. Microbiol., 8, 10.3389/fmicb.2017.00270 · DOI
  8. Donmez, 2012, The neurobiology of sirtuins and their role in neurodegeneration., Trends Pharmacol. Sci., 33, 494, 10.1016/j.tips.2012.05.007 · DOI
  9. Donmez, 2012, SIRT1 protects against alpha-synuclein aggregation by activating molecular chaperones., J. Neurosci., 32, 124, 10.1523/JNEUROSCI.3442-11.2012 · DOI
  10. Doxakis, 2010, Post-transcriptional regulation of alpha-synuclein expression by mir-7 and mir-153., J. Biol. Chem., 285, 12726, 10.1074/jbc.M109.086827 · DOI · Paper page
  11. Duan, 2013, Sirtuins: from metabolic regulation to brain aging., Front. Aging Neurosci., 5, 10.3389/fnagi.2013.00036 · DOI
  12. Fan, 2016, MicroRNA-7 enhances subventricular zone neurogenesis by inhibiting nlrp3/caspase-1 axis in adult neural stem cells., Mol. Neurobiol., 53, 7057, 10.1007/s12035-015-9620-5 · DOI · Paper page
  13. Gal, 2012, SIRT2 interferes with autophagy-mediated degradation of protein aggregates in neuronal cells under proteasome inhibition., Neurochem. Int., 61, 992, 10.1016/j.neuint.2012.07.010 · DOI
  14. Han, 2018, Plin4-Dependent lipid droplets hamper neuronal mitophagy in the MPTP/p-induced mouse model of Parkinson’s disease., Front. Neurosci., 12, 10.3389/fnins.2018.00397 · DOI · Paper page
  15. Herskovits, 2014, SIRT1 in neurodevelopment and brain senescence., Neuron, 81, 471, 10.1016/j.neuron.2014.01.028 · DOI
  16. Jesko, 2017, Sirtuins and their roles in brain aging and neurodegenerative disorders., Neurochem. Res., 42, 876, 10.1007/s11064-016-2110-y · DOI
  17. Junn, 2012, MicroRNAs in neurodegenerative diseases and their therapeutic potential., Pharmacol. Ther., 133, 142, 10.1016/j.pharmthera.2011.10.002 · DOI · Paper page
  18. Kida, 2016, Sirtuins, Cell Senescence, and Vascular Aging., Can. J. Cardiol., 32, 634, 10.1016/j.cjca.2015.11.022 · DOI
  19. Lanford, 2010, Therapeutic silencing of microRNA-122 in primates with chronic hepatitis C virus infection., Science, 327, 198, 10.1126/science.1178178 · DOI · Paper page
  20. Lee, 2015, Sirtuin 1 (SIRT1) deacetylase activity and NAD(+)/NADH ratio are imperative for capsaicin-mediated programmed cell death., J. Agric. Food Chem., 63, 7361, 10.1021/acs.jafc.5b02876 · DOI
  21. Levine, 2008, p53: the Janus of autophagy?, Nat. Cell Biol., 10, 637, 10.1038/ncb0608-637 · DOI
  22. Li, 2013, Poly(ADP-ribose) polymerase mediates both cell death and ATP decreases in SIRT2 inhibitor AGK2-treated microglial BV2 cells., Neurosci. Lett., 544, 36, 10.1016/j.neulet.2013.03.032 · DOI
  23. Liu, 2014, SIRT2 enhances 1-methyl-4-phenyl-1,2,3,6-tetrahydropyridine (MPTP)-induced nigrostriatal damage via apoptotic pathway., Front. Aging Neurosci., 6, 10.3389/fnagi.2014.00184 · DOI
  24. Ma, 2013, Advances with microRNAs in Parkinson’s disease research., Drug Des. Dev. Ther., 7, 1103, 10.2147/DDDT.S48500 · DOI
  25. Maciotta, 2013, The involvement of microRNAs in neurodegenerative diseases., Front. Cell Neurosci., 7, 10.3389/fncel.2013.00265 · DOI
  26. Martinez-Vicente, 2015, Autophagy in neurodegenerative diseases: from pathogenic dysfunction to therapeutic modulation., Semin. Cell Dev. Biol., 40, 115, 10.1016/j.semcdb.2015.03.005 · DOI
  27. Maxwell, 2011, The Sirtuin 2 microtubule deacetylase is an abundant neuronal protein that accumulates in the aging CNS., Hum. Mol. Genet., 20, 3986, 10.1093/hmg/ddr326 · DOI
  28. North, 2003, The human Sir2 ortholog, SIRT2, is an NAD+-dependent tubulin deacetylase., Mol. Cell, 11, 437, 10.1016/S1097-2765(03)00038-8 · DOI
  29. Outeiro, 2007, Sirtuin 2 inhibitors rescue alpha-synuclein-mediated toxicity in models of Parkinson’s disease., Science, 317, 516, 10.1126/science.1143780 · DOI
  30. Pais, 2013, The NAD-dependent deacetylase sirtuin 2 is a suppressor of microglial activation and brain inflammation., EMBO J., 32, 2603, 10.1038/emboj.2013.200 · DOI
  31. Qiu, 2014, Deciphering the function and regulation of microRNAs in Alzheimer’s disease and Parkinson’s disease., ACS Chem. Neurosci., 5, 884, 10.1021/cn500149w · DOI
  32. Rumpf, 2015, Selective Sirt2 inhibition by ligand-induced rearrangement of the active site., Nat. Commun., 6, 10.1038/ncomms7263 · DOI
  33. Savitt, 2006, Diagnosis and treatment of Parkinson disease: molecules to medicine., J. Clin. Invest., 116, 1744, 10.1172/JCI29178 · DOI
  34. Shan, 2016, Fluoxetine protects against IL-1beta-induced neuronal apoptosis via downregulation of p53., Neuropharmacology, 107, 68, 10.1016/j.neuropharm.2016.03.019 · DOI
  35. van Leeuwen, 2013, Modulation of p53 C-terminal acetylation by mdm2, p14ARF, and cytoplasmic SirT2., Mol. Cancer Ther., 12, 471, 10.1158/1535-7163.MCT-12-0904 · DOI
  36. Venderova, 2012, Programmed cell death in Parkinson’s disease., Cold Spring Harb. Perspect. Med., 2, 10.1101/cshperspect.a009365 · DOI
  37. Wang, 2007, SIRT2 deacetylates FOXO3a in response to oxidative stress and caloric restriction., Aging Cell, 6, 505, 10.1111/j.1474-9726.2007.00304.x · DOI
  38. Ye, 2013, Protective effect of SIRT1 on toxicity of microglial-derived factors induced by LPS to PC12 cells via the p53-caspase-3-dependent apoptotic pathway., Neurosci. Lett., 553, 72, 10.1016/j.neulet.2013.08.020 · DOI
  39. Yu, 2009, The role of sirtuins in the control of metabolic homeostasis., Ann. N. Y. Acad. Sci., 1173, E10, 10.1111/j.1749-6632.2009.04952.x · DOI · Paper page
  40. Zhao, 2010, Cytosolic FoxO1 is essential for the induction of autophagy and tumour suppressor activity., Nat. Cell Biol., 12, 665, 10.1038/ncb2069 · DOI
  41. Zhou, 2016, MicroRNA-7 targets Nod-like receptor protein 3 inflammasome to modulate neuroinflammation in the pathogenesis of Parkinson’s disease., Mol. Neurodegener., 11, 10.1186/s13024-016-0094-3 · DOI · Paper page
  42. Zi, 2015, Circulating microRNA as potential source for neurodegenerative diseases biomarkers., Mol. Neurobiol., 52, 1494, 10.1007/s12035-014-8944-x · DOI

Cited by

Sorted by citations

Metadata

Authors
Sun, S., Han, X., Li, X., Song, Q., Lu, M., Jia, M., Ding, J., & Hu, G.
Venue
Frontiers in Molecular Neuroscience
Published
2018-10-11
Volume
11
ISSN
1662-5099
Cited by
77
References
6
Funders
National Natural Science Foundation of China (No. 81603091)

About these checks

Registry, retraction, Cites and statistics results are computed, not judged, with one exception: a printed reference that no index lists is read once by a model before it counts as a citation error. Claims are extracted by a model and kept only when their quote appears verbatim in the text; each cited source is then checked, with a model’s help, for whether it says what the claim relies on. Those verdicts can be wrong — read the claim’s quote and the cited source before relying on one.

Statistics and arithmetic are recomputed, not judged.

Confidence bands are shown only for fields calibrated on our annotated test set. None is calibrated yet, so no band is shown.

What counts as a claim ›How we measure confidence ›How we check this ›

Are you an author, or do you see a problem with this page? Request a review