

The DOI matches its Crossref record; 69 of the 70 references it cites were found in a registry or an index.
Implementation of pharmacokinetic and pharmacodynamic strategies in early research phases of drug discovery and development at Novartis Institute of Biomedical Research
Open accessAbstract
Characterizing the relationship between the pharmacokinetics (PK, concentration vs. time) and pharmacodynamics (PD, effect vs. time) is an important tool in the discovery and development of new drugs in the pharmaceutical industry. The purpose of this publication is to serve as a guide for drug discovery scientists toward optimal design and conduct of PK/PD studies in the research phase. This review is a result of the collaborative efforts of DMPK scientists from various Metabolism and Pharmacokinetic (MAP) departments of the global organization Novartis Institute of Biomedical Research (NIBR). We recommend that PK/PD strategies be implemented in early research phases of drug discovery projects to enable successful transition to drug development. Effective PK/PD study design, analysis, and interpretation can help scientists elucidate the relationship between PK and PD, understand the mechanism of drug action, and identify PK properties for further improvement and optimal compound design. Additionally, PK/PD modeling can help increase the translation of in vitro compound potency to the in vivo setting, reduce the number of in vivo animal studies, and improve translation of findings from preclinical species into the clinical setting. This review focuses on three important elements of successful PK/PD studies, namely partnership among key scientists involved in the study execution; parameters that influence study designs; and data analysis and interpretation. Specific examples and case studies are highlighted to help demonstrate key points for consideration. The intent is to provide a broad PK/PD foundation for colleagues in the pharmaceutical industry and serve as a tool to promote appropriate discussions on early research project teams with key scientists involved in PK/PD studies.
Overview
The claims and statistics of this paper haven’t been checked yet.
Run the check — free, no account needed. It reads the open-access text and checks the sources it cites.
Integrity signals
Registry
Cites
Statistics
Figures
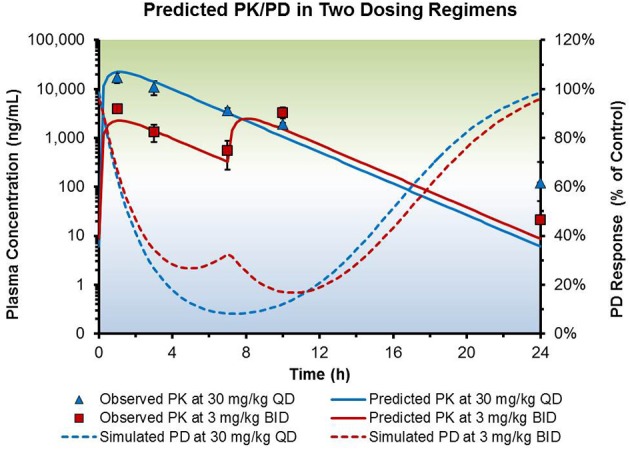
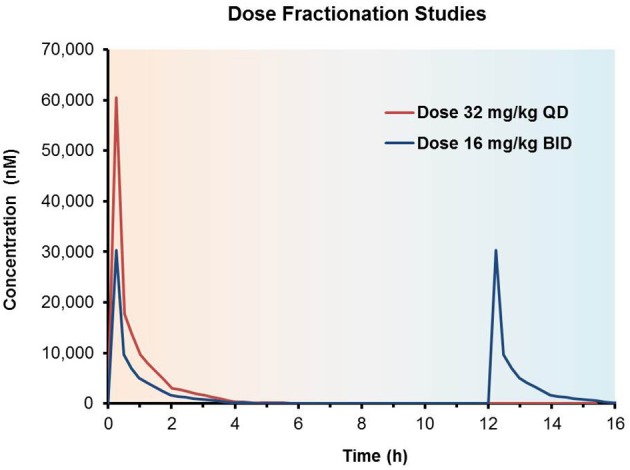
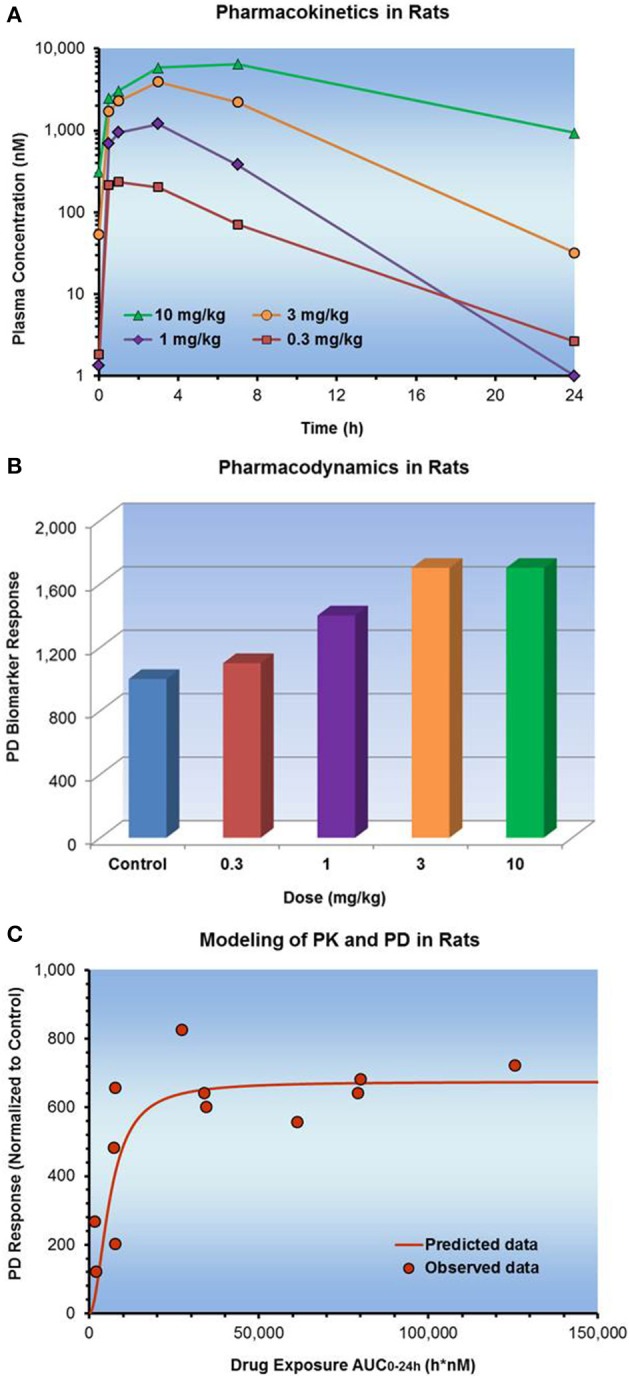
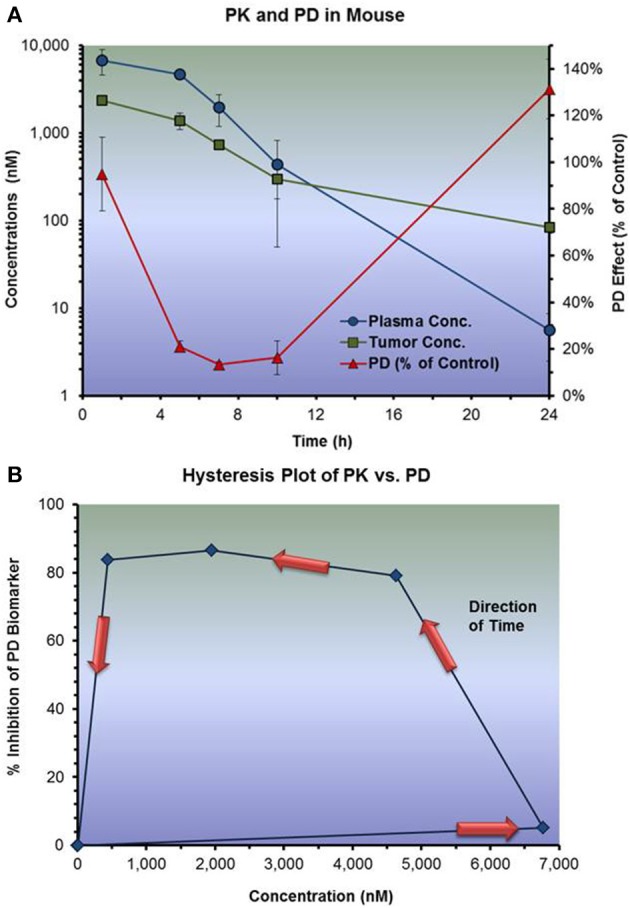
Verification
Claims the paper makes
The claims and statistics of this paper haven’t been checked yet.
Run the check — free, no account needed. It reads the open-access text and checks the sources it cites.
Claims other papers make about this one
Each is checked against this paper’s own text: does it say what the citing paper says it does?
In the citing paper
“At the investigational new drug (IND) enabling stage, integrated PK/PD knowledge along with safety studies serve a critical role in translating preclinical findings to first‐in‐human dose and regimen selection in the clinic.52, 53”
From Tutorial on monoclonal antibody pharmacokinetics and its considerations in early development (2018) · cites this paper as [52]
Self-check
Percentages, sums and reported differences re-computed from the paper’s own numbers.
The self-check needs the paper’s full text.
Citations
Cites
Craig, W. A. (1998) · Clinical Infectious Diseases · doi:10.1086/516284 · Cited by 2,908
Monoclonal Antibody Pharmacokinetics and Pharmacodynamics
Wang, W., Wang, E., & Balthasar, J. (2008) · Clinical Pharmacology & Therapeutics · doi:10.1038/clpt.2008.170 · Cited by 978
The effect of plasma protein binding on in vivo efficacy: misconceptions in drug discovery
Smith, D. A., Di, L., & Kerns, E. H. (2010) · Nature Reviews Drug Discovery · doi:10.1038/nrd3287 · Cited by 925
Antibody Pharmacokinetics and Pharmacodynamics
Lobo, E. D., Hansen, R. J., & Balthasar, J. P. (2004) · Journal of Pharmaceutical Sciences · doi:10.1002/jps.20178 · Cited by 909
Pharmacokinetic/pharmacodynamic data analysis : concepts and applications
Gabrielsson, J., & Weiner, D. (2002) · Cited by 704
Ambrose, P. G., Bhavnani, S. M., Rubino, C. M., Louie, A., Gumbo, T., Forrest, A., & Drusano, G. L. (2007) · Clinical Infectious Diseases · doi:10.1086/510079 · Cited by 697
Vaidya, V. S., Ozer, J. S., Dieterle, F., Collings, F. B., Ramírez, V., Troth, S. P., Muniappa, N., Thudium, D. T., Gerhold, D. L., Holder, D., et al. (2010) · Nature Biotechnology · doi:10.1038/nbt.1623 · Cited by 662
Simeoni, M., Magni, P., Cammia, C., Nicolao, G. D., Croci, V., Pesenti, E. A., Germani, M., Poggesi, I., & Rocchetti, M. (2004) · Cancer Research · doi:10.1158/0008-5472.can-03-2524 · Cited by 509
Elimination mechanisms of therapeutic monoclonal antibodies
Tabrizi, M. A., Tseng, C.-M. L., & Roskos, L. K. (2006) · Drug Discovery Today · doi:10.1016/s1359-6446(05)03638-x · Cited by 479
BRAFV600E: Implications for Carcinogenesis and Molecular Therapy
Dorris, E., O’Leary, J. J., & Sheils, O. M. (2011) · Molecular Cancer Therapeutics · doi:10.1158/1535-7163.mct-10-0799 · Cited by 473
Lalonde, R. L., Kowalski, K., Hutmacher, M. M., Ewy, W., Nichols, D., Milligan, P. A., Corrigan, B., Lockwood, P. A., Marshall, S. A., Benincosa, L. J., et al. (2007) · Clinical Pharmacology & Therapeutics · doi:10.1038/sj.clpt.6100235 · Cited by 462
Marsilje, T. H., Pei, W., Chen, B., Lu, W., Uno, T., Jin, Y., Jiang, T., Kim, S., Li, N., Warmuth, M., et al. (2013) · Journal of Medicinal Chemistry · doi:10.1021/jm400402q · Cited by 426
Self-citationAnimal model pharmacokinetics and pharmacodynamics: a critical review
Andes, D. R., & Craig, W. A. (2002) · International Journal of Antimicrobial Agents · doi:10.1016/s0924-8579(02)00022-5 · Cited by 415
Clinical pharmacokinetics and phamacodynamics: concepts and applications
Rowland, M., & Tozer, T. N. (2011) · Cited by 367
Physiologic indirect response models characterize diverse types of pharmacodynamic effects
Jusko, W. J., & Ko, H. C. (1994) · Clinical Pharmacology & Therapeutics · doi:10.1038/clpt.1994.155 · Cited by 360
Modeling of Pharmacokinetic/Pharmacodynamic (PK/PD) Relationships: Concepts and Perspectives
Derendorf, H., & Meibohm, B. (1999) · Pharmaceutical Research · doi:10.1023/a:1011907920641 · Cited by 352
The importance of plasma protein binding in drug discovery
Trainor, G. L. (2007) · Expert Opinion on Drug Discovery · doi:10.1517/17460441.2.1.51 · Cited by 352
Tissue concentrations: do we ever learn?
Mouton, J. W., Theuretzbacher, U., Craig, W. A., Tulkens, P. M., Derendorf, H., & Cars, O. (2007) · Journal of Antimicrobial Chemotherapy · doi:10.1093/jac/dkm476 · Cited by 352
Diversity of Mechanism-Based Pharmacodynamic Models
Mager, D. E., Wyska, E., & Jusko, W. J. (2003) · Drug Metabolism and Disposition · doi:10.1124/dmd.31.5.510 · Cited by 345
Imaging of Plasmodium Liver Stages to Drive Next-Generation Antimalarial Drug Discovery
Meister, S., Plouffe, D., Kuhen, K., Bonamy, G. M. C., Wu, T., Barnes, S. W., Bopp, S. E. R., Borboa, R., Bright, A. T., Che, J., et al. (2011) · Science · doi:10.1126/science.1211936 · Cited by 341
Self-citationValidation of a rapid equilibrium dialysis approach for the measurement of plasma protein binding.
Waters, N., Jones, R., Williams, G., & Sohal, B. (2008) · Journal of Pharmacy and Science · doi:10.1002/jps.21317 · Cited by 322
Mechanism-based pharmacokinetic-pharmacodynamic (PK-PD) modeling in translational drug research
Danhof, M., DELANGE, E., Pasqua, O. E. D., Ploeger, B. A., & Voskuyl, R. A. (2008) · Trends in Pharmacological Sciences · doi:10.1016/j.tips.2008.01.007 · Cited by 290
van der Graaf, P. H., & Benson, N. (2011) · Pharmaceutical Research · doi:10.1007/s11095-011-0467-9 · Cited by 249
Kalvass, J. C., Maurer, T. S., & Pollack, G. M. (2007) · Drug Metabolism and Disposition · doi:10.1124/dmd.106.012294 · Cited by 229
Yu, R., Kim, T.-W., Hong, A., Watanabe, T., Gaus, H., & Geary, R. (2007) · Drug Metabolism And Disposition · doi:10.1124/dmd.106.012401 · Cited by 226
Ieiri, I., Higuchi, S., & Sugiyama, Y. (2009) · Expert Opinion on Drug Metabolism & Toxicology · doi:10.1517/17425250902976854 · Cited by 211
Pharmacokinetic/Pharmacodynamic Modeling in Drug Research and Development
Derendorf, H., Lesko, L. J., Chaikin, P., Colburn, W. A., Lee, P., Miller, R., Powell, R., Rhodes, G. R., Stanski, D. R., & Venitz, J. (2000) · The Journal of Clinical Pharmacology · doi:10.1177/009127000004001211 · Cited by 207
Pharmacokinetics and the drug–target residence time concept
Dahl, G., & Åkerud, T. (2013) · Drug Discovery Today · doi:10.1016/j.drudis.2013.02.010 · Cited by 204
Chien, J. Y., Friedrich, S. W., Heathman, M. A., de Alwis, D. P., & Sinha, V. P. (2005) · The AAPS Journal · doi:10.1208/aapsj070355 · Cited by 178
MAHMOOD, I. (2007) · Advanced Drug Delivery Reviews · doi:10.1016/j.addr.2007.05.015 · Cited by 170
Biomarkers in Drug Discovery and Development: From Target Identification through Drug Marketing
Colburn, W. A. (2003) · The Journal of Clinical Pharmacology · doi:10.1177/0091270003252480 · Cited by 150
How Modeling and Simulation Have Enhanced Decision Making in New Drug Development
Miller, R., Ewy, W., Corrigan, B., Ouellet, D., Hermann, D. J., Kowalski, K. G., LOCKWOOD, P. A., Koup, J. R., Donevan, S. D., El‐Kattan, A. F., et al. (2005) · Journal of Pharmacokinetics and Pharmacodynamics · doi:10.1007/s10928-005-0074-7 · Cited by 147
Agoram, B. M., Martin, S. W., & van der Graaf, P. H. (2007) · Drug Discovery Today · doi:10.1016/j.drudis.2007.10.002 · Cited by 145
Scaling Pharmacodynamics from In Vitro and Preclinical Animal Studies to Humans
Mager, D. E., Woo, S., & Jusko, W. J. (2009) · Drug Metabolism and Pharmacokinetics · doi:10.2133/dmpk.24.16 · Cited by 144
Lobo, E. D., & Balthasar, J. P. (2002) · AAPS PharmSci · doi:10.1208/ps040442 · Cited by 127
Yu, R. Z., Lemonidis, K. M., Graham, M. J., Matson, J. E., Crooke, R. M., Tribble, D. L., Wedel, M. K., Levin, A. A., & Geary, R. S. (2008) · Biochemical Pharmacology · doi:10.1016/j.bcp.2008.11.005 · Cited by 125
Development of Translational Pharmacokinetic–Pharmacodynamic Models
Mager, D. E., & Jusko, W. J. (2008) · Clinical pharmacology and therapy · doi:10.1038/clpt.2008.52 · Cited by 122
Modeling the efficacy of trastuzumab-DM1, an antibody drug conjugate, in mice
Jumbe, N. L., Xin, Y., Leipold, D. D., Crocker, L., Dugger, D., Mai, E., Sliwkowski, M. X., Fielder, P. J., & Tibbitts, J. (2010) · Journal of Pharmacokinetics and Pharmacodynamics · doi:10.1007/s10928-010-9156-2 · Cited by 119
Clinical pharmacokinetics and pharmacodynamicsconcepts and applications
Rowland, M. (2009) · Cited by 119
Wong, H., Alicke, B., West, K. A., Pacheco, P., La, H., Januario, T., Yauch, R. L., de Sauvage, F. J., & Gould, S. E. (2011) · Clinical Cancer Research · doi:10.1158/1078-0432.ccr-11-0975 · Cited by 113
Gibiansky, L. V., & Gibiansky, E. (2009) · Expert Opinion on Drug Metabolism & Toxicology · doi:10.1517/17425250902992901 · Cited by 111
Gabrielsson, J., Dolgos, H., Gillberg, P., Bredberg, U., Benthem, B., & Duker, G. (2009) · Drug Discovery Today · doi:10.1016/j.drudis.2008.12.011 · Cited by 104
PK/PD modelling and simulations: utility in drug development
Rajman, I. (2008) · Drug Discovery Today · doi:10.1016/j.drudis.2008.01.003 · Cited by 101
Wajima, T., Yano, Y., Fukumura, K., & Oguma, T. (2004) · Journal of Pharmaceutical Sciences · doi:10.1002/jps.20099 · Cited by 98
Plasma / Serum Protein Binding Determinations
Banker, M. J., & Clark, T. H. (2008) · Current Drug Metabolism · doi:10.2174/138920008786485065 · Cited by 95
Yamazaki, S., Skaptason, J., Romero, D., Lee, J. H., Zou, H. Y., Christensen, J. G., Koup, J. R., Smith, B. J., & Koudriakova, T. B. (2008) · Drug Metabolism and Disposition · doi:10.1124/dmd.107.019711 · Cited by 94
Salphati, L., Wong, H., Belvin, M. P., Bradford, D., Edgar, K. A., Prior, W. W., Sampath, D., & Wallin, J. J. (2010) · Drug Metabolism and Disposition · doi:10.1124/dmd.110.032912 · Cited by 86
Shenoy, S. D., Spencer, T. A., Mercer-Haines, N. A., Alipour, M., Gargano, M. D., Runge‐Morris, M., & Kocarek, T. A. (2004) · Drug Metabolism and Disposition · doi:10.1124/dmd.32.1.66 · Cited by 82
Wong, H., Vernillet, L., Peterson, A., Ware, J. A., Lee, L., Martini, J., Yu, P., Li, C., Rosario, G. D., Choo, E. F., et al. (2012) · Clinical Cancer Research · doi:10.1158/1078-0432.ccr-12-0445 · Cited by 80
Incorporating Receptor Theory in Mechanism-Based Pharmacokinetic-Pharmacodynamic (PK-PD) Modeling
Ploeger, B. A., van der Graaf, P. H., & Danhof, M. (2009) · Drug Metabolism and Pharmacokinetics · doi:10.2133/dmpk.24.3 · Cited by 78
Pharmacokinetics and Pharmacodynamics of Biotech Drugs
(2006) · Wiley eBooks · doi:10.1002/9783527609628 · Cited by 72
Assessing brain free fraction in early drug discovery
Read, K. D., & Braggio, S. (2010) · Expert Opinion on Drug Metabolism & Toxicology · doi:10.1517/17425250903559873 · Cited by 71
Model-based drug discovery: implementation and impact
Visser, S. A. G., Aurell, M., Jones, R. D. O., Schuck, V., Egnell, A., Peters, S. A., Brynne, L., Yates, J. W. T., Jansson‐Löfmark, R., Tan, B., et al. (2013) · Drug Discovery Today · doi:10.1016/j.drudis.2013.05.012 · Cited by 66
Wang, S., Guo, P., Wang, X., Zhou, Q. S., & Gallo, J. M. (2008) · Molecular Cancer Therapeutics · doi:10.1158/1535-7163.mct-07-2070 · Cited by 58
Mathematical modeling of tumor growth and tumor growth inhibition in oncology drug development
Bernard, A., Kimko, H. H. C., Mital, D. P., & Poggesi, I. (2012) · Expert Opinion on Drug Metabolism & Toxicology · doi:10.1517/17425255.2012.693480 · Cited by 56
Heinzen, E. L., & Pollack, G. M. (2004) · Brain Research · doi:10.1016/j.brainres.2004.07.015 · Cited by 53
Optimising in vivo pharmacology studies—Practical PKPD considerations
Gabrielsson, J., Green, A. R., & van der Graaf, P. H. (2010) · Journal of Pharmacological and Toxicological Methods · doi:10.1016/j.vascn.2010.02.002 · Cited by 52
Predicting Oral Clearance in Humans
Sinha, V. K., Buck, S. S. D., Fenu, L. A., Smit, J. W., Nijsen, M., Gilissen, R., Peer, A. V., Lavrijsen, K., & Mackie, C. E. (2008) · Clinical Pharmacokinetics · doi:10.2165/00003088-200847010-00004 · Cited by 50
Bueters, T., Ploeger, B. A., & Visser, S. A. G. (2013) · Drug Discovery Today · doi:10.1016/j.drudis.2013.05.001 · Cited by 43
Nestorov, I., Graham, G., Duffull, S., Aarons, L., Fuseau, E., & Coates, P. (2001) · Pharmaceutical Research · doi:10.1023/a:1010943430471 · Cited by 41
Target-Mediated Pharmacokinetic and Pharmacodynamic Model of Exendin-4 in Rats, Monkeys, and Humans
Gao, W., & Jusko, W. J. (2012) · Drug Metabolism and Disposition · doi:10.1124/dmd.111.042291 · Cited by 40
Heimbach, T., Lakshminarayana, S. B., Hu, W., & He, H. (2009) · The AAPS Journal · doi:10.1208/s12248-009-9136-x · Cited by 36
Kamiya, N., Iwao, E., Hiraga, N., Tsuge, M., Imamura, M., Takahashi, S., Miyoshi, S., Tateno, C., Yoshizato, K., & Chayama, K. (2010) · Journal of General Virology · doi:10.1099/vir.0.019315-0 · Cited by 35
Beaumont, K. C., & Smith, D. A. (2009) · PubMed · Cited by 34
Raje, S. V., Cornish, J. L., Newman, A. H., Cao, J., Katz, J. L., & Eddington, N. D. (2005) · Pharmaceutical Research · doi:10.1007/s11095-005-2488-8 · Cited by 31
Amore, B. M., Gibbs, J. P., & Emery, M. G. (2010) · Combinatorial Chemistry & High Throughput Screening · doi:10.2174/138620710790596808 · Cited by 23
Bender, G., Gosset, J., Florian, J., Tan, K., Field, M. J., Marshall, S. F., DeJongh, J., Bies, R. R., & Danhof, M. (2009) · Pharmaceutical Research · doi:10.1007/s11095-009-9942-y · Cited by 16
Geldof, M., Freijer, J. I., van Beijsterveldt, L., Vermote, P. C. M., Megens, A. A. H. P., & Danhof, M. (2007) · European Journal of Pharmaceutical Sciences · doi:10.1016/j.ejps.2007.07.004 · Cited by 5
Mechanism-Based PKPD Projections in Exploratory Drug Development
Kawai, R. (2009) · Drug Metabolism and Pharmacokinetics · doi:10.2133/dmpk.24.1 · Cited by 1
Cited by
Sorted by citations
Artificial Intelligence in Pharmaceutical Technology and Drug Delivery Design
Vora, L. K., Gholap, A. D., Jetha, K. L., Singh, T. R. R., Solanki, H. K., & Chavda, V. P. (2023) · Pharmaceutics · doi:10.3390/pharmaceutics15071916 · Cited by 1,193
A multi-organ chip with matured tissue niches linked by vascular flow
Ronaldson-Bouchard, K., Teles, D., Yeager, K., Tavakol, D. N., Zhao, Y., Chramiec, A., Tagore, S., Summers, M., Stylianos, S., Tamargo, M., et al. (2022) · Nature Biomedical Engineering · doi:10.1038/s41551-022-00882-6 · Cited by 512
“1% EDTA (w/v) in deionized (DI) water overnight at 4 °C, (3) 10 mM Tris, 0.”
BackgroundMethodInfluentialMarques, L., Costa, B., Pereira, M., Silva, A., Santos, J., Saldanha, L., da Silva, I. C. B., Magalhães, P., Schmidt, S., & Vale, N. (2024) · Pharmaceutics · doi:10.3390/pharmaceutics16030332 · Cited by 444
“Even at the initial stages, during the discovery of novel compounds phase, these strategies can be effectively implemented [97].”
BackgroundThe Bioavailability of Drugs—The Current State of Knowledge
Stielow, M., Witczyńska, A., Kubryń, N., Fijałkowski, Ł., Nowaczyk, J., & Nowaczyk, A. (2023) · Molecules · doi:10.3390/molecules28248038 · Cited by 454
“Therefore, pharmacokinetic studies, which measure bioavailability, are required before a drug can be marketed [20].”
BackgroundInfluentialAhmad, A., Imran, M., & Ahsan, H. (2023) · Pharmaceutics · doi:10.3390/pharmaceutics15061630 · Cited by 420
“These ar biomarkers that pr sent concentrations of pharm cological drugs in the blood r other b dy fluids under circulating body fluids and/or at localities of their pharmacological actions, and which are significant for the calculations of their doses, required for the induction of some pharmacological responses [27,…”
Background
Metadata
- Authors
- Tuntland, T., Ethell, B., Kosaka, T., Blasco, F., Zang, R. X., Jain, M., Gould, T., & Hoffmaster, K.
- Affiliations
- Genomics Institute of the Novartis Research Foundation (US)
- Novartis (Singapore) (SG)
- Corresponding author
- Tuntland, Tove
- Venue
- Frontiers in Pharmacology
- Publisher
- Frontiers Media SA
- Published
- 2014-07-28
- Volume
- 5
- Pages
- 174-174
- ISSN
- 1663-9812 (ISSN-L)
- PMC
- PMC4112793
- OpenAlex
- W2070719925
- Cited by
- 239
- References
- 70
- Citations by year
- 2026: 23 · 2025: 25 · 2024: 26 · 2023: 25 · 2022: 24 · 2021: 25 · 2020: 28 · 2019: 16 · 2018: 11 · 2017: 17 · 2016: 10 · 2015: 8
- FWCI
- 1.48
- Type
- journal article
- Language
- en
- Open access
- gold
- doi.org
- Licence
- cc-by
- Locations
- Frontiers in Pharmacology (publishedVersion, cc-by)
- PubMed Central (publishedVersion, cc-by)
- PubMed (publishedVersion)
- DOAJ (DOAJ: Directory of Open Access Journals) (submittedVersion, cc-by-sa)
- Topics
- Physical Sciences › Mathematics › Statistics and Probability › Statistical Methods in Clinical Trials
- Health Sciences › Medicine › Pediatrics, Perinatology and Child Health › Pharmaceutical studies and practices
- Life Sciences › Pharmacology, Toxicology and Pharmaceutics › Pharmacology › Pharmacogenetics and Drug Metabolism
- Keywords
- pharmacokinetics, pharmacodynamics, pharmacokinetic-pharmacodynamic modeling, drug discovery, research design, data analysis and interpretation, mechanism of drug action, in vitro to in vivo translation, preclinical to clinical translation, compound design, inter-agency cooperation
About these checks
Registry, retraction, Cites and statistics results are computed, not judged, with one exception: a printed reference that no index lists is read once by a model before it counts as a citation error. Claims are extracted by a model and kept only when their quote appears verbatim in the text; each cited source is then checked, with a model’s help, for whether it says what the claim relies on. Those verdicts can be wrong — read the claim’s quote and the cited source before relying on one.
Statistics and arithmetic are recomputed, not judged.
Confidence bands are shown only for fields calibrated on our annotated test set. None is calibrated yet, so no band is shown.
What counts as a claim ›How we measure confidence ›How we check this ›
Are you an author, or do you see a problem with this page? Request a review
