

The DOI matches its Crossref record; 37 of the 38 references it cites were found in a registry or an index.
Efficacy and Safety of Berberine Alone for Several Metabolic Disorders: A Systematic Review and Meta-Analysis of Randomized Clinical Trials
Open accessAbstract
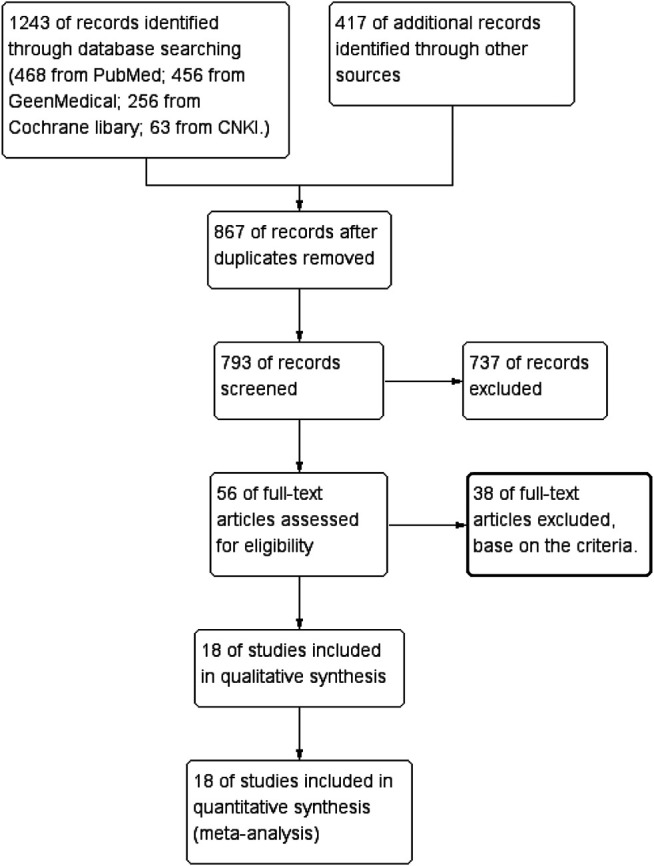
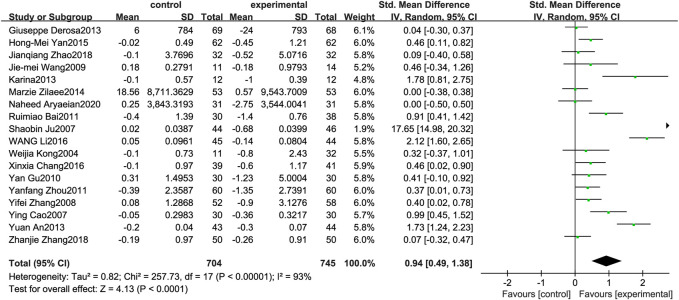
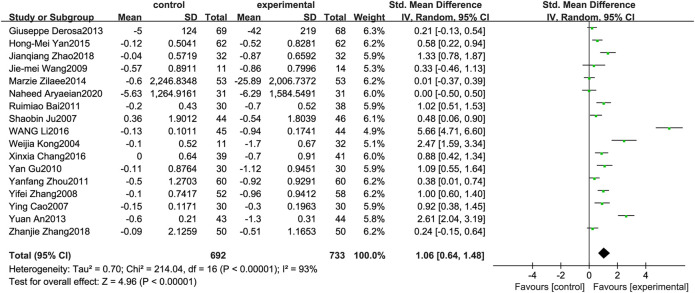
Background: Metabolic activity is the basic life activity of organisms and the fundamental for maintaining body functions. With the improvement of living standards, the incidence of metabolic disorder is also increasing. At present, most of the clinical treatment strategies and meta-analysis for metabolic disorder uncover that combined medicines with berberine ameliorate several metabolic disorders. However, evidence to disclose the therapeutic effect of berberine treatment alone and the possible factors affecting the efficacy is limited. Therefore, we have formulated strict inclusion criteria and selected more reliable data for meta-analysis through more refined screening strategies to provide evidence and guidance for clinical decision-making and understand the effect of berberine treatment alone and the factors affecting its efficacy. Methods and results: Using meta-analysis of “Cochrane Handbook for Systematic Reviews of Interventions” as guidelines, we searched PubMed, GeenMedical, Cochrane library, and china national knowledge infrastructure (CNKI) for trials reporting clinical treatment data of berberine. Another 417 trials were included through other sources to increase confidence in results. Among the 1,660 related documents retrieved from the four databases, 18 eligible documents were selected for analysis. Given the differences in trial design and measurement units, we used the standardized mean difference (SMD) method to eliminate the differences and then summarize the data for analysis. The main factors are triglyceride (TG), total cholesterol (TC), low-density lipoprotein (LDL), high-density lipoprotein (HDL), homeostasis model assessment-insulin resistance (HOMA-IR), and fasting plasma glucose (FPG). Random-effect model analysis was performed: TG (SMD: 0.94; 95%CI: 0.49,1.38; p = 0.00), TC (SMD: 1.06; 95%CI: 0.64, 1.48; p = 0.00), LDL (SMD: 1.77; 95%CI: 1.11,2.44; p = 0.00), HDL (SMD: −1.59; 95%CI: −2.32, −0.85; p = 0.00), HOMA-IR (SMD: 1.25; 95%CI: 0.25,2.24; p = 0.01), and FPG (SMD: 0.65; 95%CI: 0.28,1.03; p = 0.00). This study aimed to conduct a systematic review and meta-analysis of the literature to evaluate the therapeutic effect of berberine singly on metabolic diseases. Conclusion: Berberine can improve obesity and hyperlipidemia by reducing TG, TC, and LDL and increasing HDL; reduce insulin resistance to improve type Ⅱ diabetes; and prevent diabetic encephalopathy.
Overview
The claims and statistics of this paper haven’t been checked yet.
Run the check — free, no account needed. It reads the open-access text and checks the sources it cites.
Integrity signals
Registry
Cites
Statistics
Figures
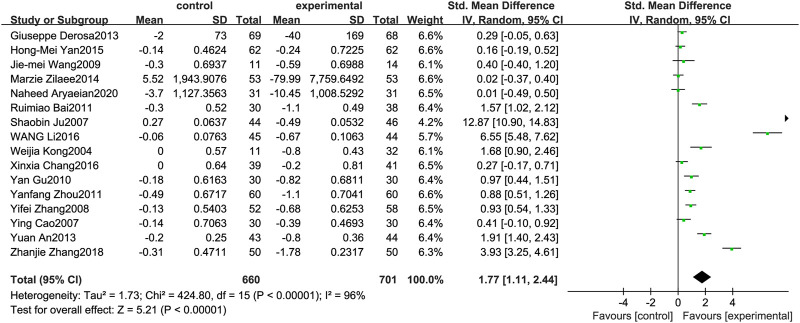
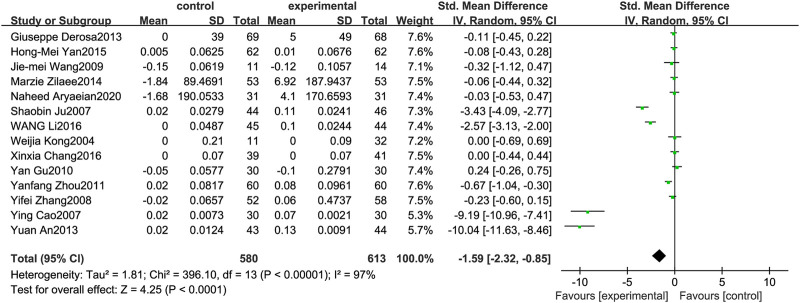
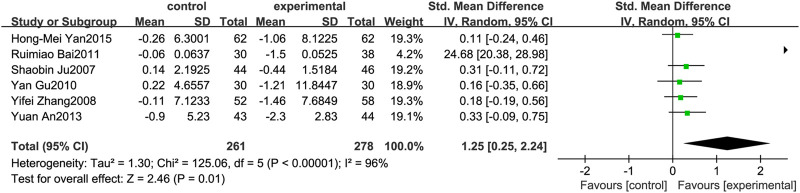
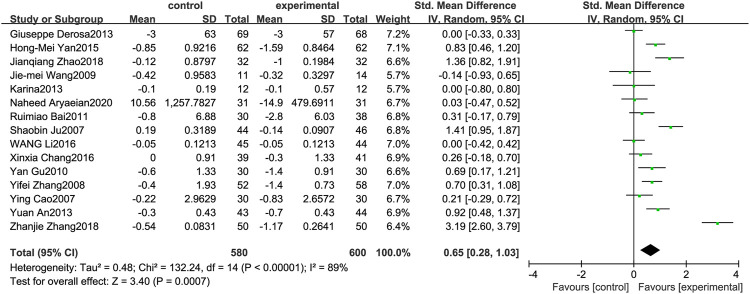
Verification
Claims the paper makes
The claims and statistics of this paper haven’t been checked yet.
Run the check — free, no account needed. It reads the open-access text and checks the sources it cites.
Claims other papers make about this one
Each is checked against this paper’s own text: does it say what the citing paper says it does?
The source backs part of the claim, not all of it — or backs it for a different population, condition or comparison.
In the citing paper
“Prior reviews of berberine have several limitations as they included studies that did not make comparisons to placebo, compared berberine to diverse controls (e.g., statins, oral hypoglycemics, lifestyle modification), assessed extracts from the barberry plant or defined the intervention as combination nutraceutical products containing berberine such as Armolipid Plus®.(7-13)”
From Overall and sex-specific effect of berberine for dyslipidemia: systematic review and meta-analysis of placebo-controlled trials (2022) · cites this paper as [13]
Experimental — accuracy not yet measuredThe check wasn’t confident either way, so it gives no verdict — never disputed.
In the citing paper
“The anti-inflammatory effects of adiponectin in skeletal muscle are largely attributed to its ability to induce macrophage polarization toward an anti-inflammatory phenotype, characterized by the secretion of interleukin-10 (IL-10)”
From Exercise-Induced Muscle–Fat Crosstalk: Molecular Mediators and Their Pharmacological Modulation for the Maintenance of Metabolic Flexibility in Aging (2025) · cites this paper as [105]
Experimental — accuracy not yet measuredIn the citing paper
“Whether used alone or combined with other therapies, meta-analyses [16, 72] suggested that berberine improve obesity and hyperlipidemia by reducing TG, TC, and LDL and increasing HDL in the setting of several metabolic disorders along with improving glucose metabolism.”
From The Effect of Berberine on Metabolic Profiles in Type 2 Diabetic Patients: A Systematic Review and Meta‐Analysis of Randomized Controlled Trials (2021) · cites this paper as [16]
In the citing paper
“Systematic reviews have previously reported the efficacy of berberine on the regulation of glycemic and lipid metabolisms [16, 18].”
From The Effect of Berberine on Metabolic Profiles in Type 2 Diabetic Patients: A Systematic Review and Meta‐Analysis of Randomized Controlled Trials (2021) · cites this paper as [16]
In the citing paper
“Whether used alone or combined with other therapies, meta-analyses [16, 72] suggested that berberine improve obesity and hyperlipidemia by reducing TG, TC, and LDL and increasing HDL in the setting of several metabolic disorders along with improving glucose metabolism.”
From The Effect of Berberine on Metabolic Profiles in Type 2 Diabetic Patients: A Systematic Review and Meta‐Analysis of Randomized Controlled Trials (2021) · cites this paper as [16]
Self-check
Percentages, sums and reported differences re-computed from the paper’s own numbers.
The self-check needs the paper’s full text.
Citations
Cites
The Cochrane Collaboration's tool for assessing risk of bias in randomised trials
Higgins, J. P. T., Altman, D. G., Gotzsche, P. C., Juni, P., Moher, D., Oxman, A. D., Savovic, J., Schulz, K. F., Weeks, L., Sterne, J. A. C., et al. (2011) · BMJ · doi:10.1136/bmj.d5928 · Cited by 33,817
Interpretation of random effects meta-analyses
Riley, R. D., Higgins, J. P. T., & Deeks, J. J. (2011) · BMJ · doi:10.1136/bmj.d549 · Cited by 2,884
Kong, W., Wei, J., Abidi, P., Lin, M., Inaba, S., Li, C., Wang, Y., Wang, Z., Si, S., Pan, H., et al. (2004) · Nature Medicine · doi:10.1038/nm1135 · Cited by 1,391
Lee, Y. S., Kim, W. S., Kim, K. H., Yoon, M. J., Cho, H. J., Shen, Y., Ye, J.-M., Lee, C. H., Oh, W. K., Kim, C. T., et al. (2006) · Diabetes · doi:10.2337/db06-0006 · Cited by 1,054
Treatment of Type 2 Diabetes and Dyslipidemia with the Natural Plant Alkaloid Berberine
Zhang, Y., Li, X., Zou, D., Liu, W., Yang, J., Zhu, N., Huo, L., Wang, M., Hong, J., Wu, P., et al. (2008) · The Journal of Clinical Endocrinology & Metabolism · doi:10.1210/jc.2007-2404 · Cited by 573
Neag, M. A., Mocan, A., Echeverría, J., Pop, R. M., Bocsan, C. I., Crişan, G., & Buzoianu, A. D. (2018) · Frontiers in Pharmacology · doi:10.3389/fphar.2018.00557 · Cited by 562
Nonalcoholic fatty liver disease and the metabolic syndrome
Marchesini, G., Marzocchi, R., Agostini, F., & Bugianesi, E. (2005) · Current Opinion in Lipidology · doi:10.1097/01.mol.0000174153.53683.f2 · Cited by 421
Srivastava, R. A. K., Pinkosky, S. L., Filippov, S. I., Hanselman, J. C., Cramer, C. T., & Newton, R. S. (2012) · Journal of Lipid Research · doi:10.1194/jlr.r025882 · Cited by 308
The Metabolic Syndrome and Alzheimer Disease
Razay, G., Vreugdenhil, A., & Wilcock, G. K. (2007) · Archives of Neurology · doi:10.1001/archneur.64.1.93 · Cited by 272
The Role of Nutraceuticals in Statin Intolerant Patients
Banach, M., Patti, A. M., Giglio, R. V., Cicero, A. F. G., Atanasov, A. G., Bajraktari, G., Bruckert, E., Descamps, O., Djuric, D. M., Ezhov, M., et al. (2018) · Journal of the American College of Cardiology · doi:10.1016/j.jacc.2018.04.040 · Cited by 272
Research works printed but not linked: 6
- Cao, 2007, A Clinical Study of Multi-Factor Intervention to Improve Insulin Resistance in Type 2 Diabetes (Chinese). Master’s Degree
- Huang, 2011, Clinical Observation on 60 Cases of Hyperlipemia Treated by Berberine (Chinese), Chin. J. Clin. Rational Drug Use, 4, 76, 10.3969/j.issn.1674-3296.2011.22.058 · DOI
- Ju, 2007, Interventioal Effect of Berberine Liposome on Impaired Glucose Tolerance Accompanied with Hyperlipemia, J. Pract. Trad. Chin. Med., 23, 490
- Liu, 2015, Effect of Metabolic Diseases on Emotional and Cognitive Functions and its Potential Mechanisms: Research Progress, Chin. J. Pharmacol. Toxicol., 29, 847, 10.3867/j.issn.1000-3002.2015.05.063 · DOI
- Zhang, 2018, Clinical Study of Berberine Intervention in Patients with Impaired Fasting Blood Glucose (Chinese), Zhejiang J. Traditional Chin. Med., 53, 393, 10.3969/j.issn.0411-8421.2018.06.002 · DOI
- Zhao, 2018, Clinical Study of Berberine Intervention in Delaying the Development of Diabetes in Pre-diabetic Population (Chinese), J. Pract. Diabetol., 14, 31
Cited by
Sorted by citations
Guo, J., Chen, H., Zhang, X., Lou, W., Zhang, P., Qiu, Y., Zhang, C., Wang, Y., & Liu, W. J. (2021) · Oxidative Medicine and Cellular Longevity · doi:10.1155/2021/2074610 · Cited by 110
Berberine and Its Study as an Antidiabetic Compound
Utami, A. R., Maksum, I. P., & Deawati, Y. (2023) · Biology · doi:10.3390/biology12070973 · Cited by 110
Berberine and health outcomes: An umbrella review
Li, Z., Yang, W., Xu, Q., Ma, J., Li, X., Yan, J., Tian, Y., Wen, Y., & Chen, T. (2023) · Phytotherapy Research · doi:10.1002/ptr.7806 · Cited by 109
Luján, L. M. L., McCarty, M. F., Nicolantonio, J. J. D., Galvez-Ruiz, J. C., Rosas‐Burgos, E. C., Plascencia‐Jatomea, M., & Assanga, S. B. I. (2022) · Nutrients · doi:10.3390/nu14091985 · Cited by 66
Vascular smooth muscle cell dysfunction in neurodegeneration
Hayes, G., Pinto, J., Sparks, S., Wang, C., Suri, S., & Bulte, D. P. (2022) · Frontiers in Neuroscience · doi:10.3389/fnins.2022.1010164 · Cited by 64
Barrea, L., Vetrani, C., Verde, L., Frías-Toral, E., Ceriani, F., Cernea, S., Docimo, A., Graziadio, C., Tripathy, D., Savastano, S., et al. (2023) · Antioxidants · doi:10.3390/antiox12040904 · Cited by 61
The development of nanocarriers for natural products
Huang, L., Luo, S., Tong, S., Lv, Z., & Wu, J. (2024) · Wiley Interdisciplinary Reviews Nanomedicine and Nanobiotechnology · doi:10.1002/wnan.1967 · Cited by 58
Addressing the preventive and therapeutic perspective of berberine against diabetes
Shrivastava, S., Sharma, A., Saxena, N. V., Bhamra, R., & Kumar, S. (2023) · Heliyon · doi:10.1016/j.heliyon.2023.e21233 · Cited by 50
Solnier, J., Zhang, Y., Kuo, Y., Du, M., Roh, K., Gahler, R., Wood, S., & Chang, C. (2023) · Pharmaceutics · doi:10.3390/pharmaceutics15112567 · Cited by 47
Tero-Vescan, A., Degens, H., Matsakas, A., Ștefănescu, R., Ősz, B. E., & Slevin, M. (2025) · Pharmaceuticals · doi:10.3390/ph18081222 · Cited by 44
Achi, I. T., Sarbadhikary, P., George, B. P. A., & Abrahamse, H. (2022) · Cells · doi:10.3390/cells11213433 · Cited by 42
Qin, Z., Tang, R., Liang, J., & Jia, X. (2024) · International Immunopharmacology · doi:10.1016/j.intimp.2024.112422 · Cited by 40
Kong, Y., Yang, H., Nie, R., Zhang, X., Zhang, H., & Nian, X. (2025) · European journal of medical research · doi:10.1186/s40001-025-02738-6 · Cited by 40
Jin, H., Li, J., Zhang, M., Luo, R., Lu, P., Zhang, W., Zhang, J., Pi, J., Zheng, W., Mai, Z., et al. (2021) · Frontiers in Pharmacology · doi:10.3389/fphar.2021.724525 · Cited by 39
Self-citationThe therapeutic effects of berberine for gastrointestinal cancers
Davoodvandi, A., Sadeghi, S., Alavi, S. M. A., Alavi, S. S., Jafari, A., Khan, H. Z., Aschner, M., Mirzaei, H., Sharifi, M., & Asemi, Z. (2023) · Asia-Pacific Journal of Clinical Oncology · doi:10.1111/ajco.13941 · Cited by 33
Review of potential medical treatments for middle ear cholesteatoma
Schürmann, M., Goon, P. K. C., & Sudhoff, H. H. (2022) · Cell Communication and Signaling · doi:10.1186/s12964-022-00953-w · Cited by 31
Zamani, M., Zarei, M., Nikbaf-Shandiz, M., Hosseini, S., Shiraseb, F., & Asbaghi, O. (2022) · Frontiers in Nutrition · doi:10.3389/fnut.2022.1013055 · Cited by 28
Pierro, F. D., Sultana, R., Eusaph, A. Z., Abrar, S., Bugti, M., Afridi, F., Farooq, U., Iqtadar, S., Ghauri, F., Makhduma, S., et al. (2023) · Frontiers in Pharmacology · doi:10.3389/fphar.2023.1269605 · Cited by 29
Zhang, C.-W., Huang, D., Rajoka, M. S. R., Wu, Y., He, Z.-D., Ye, L., Wang, Y., & Song, X. (2024) · Molecules · doi:10.3390/molecules29215079 · Cited by 25
Clinically Effective Molecules of Natural Origin for Obesity Prevention or Treatment
Hidalgo-Lozada, G. M., Villarruel‐López, A., Nuño, K., García, A. G., Sánchez-Nuño, Y. A., & Ramos-García, C. O. (2024) · International Journal of Molecular Sciences · doi:10.3390/ijms25052671 · Cited by 28
Fang, W., Huang, X., Wu, K., Zong, Y., Yu, J., Xu, H., Shi, J., Wei, J., Zhou, X., & Jiang, C. (2022) · Frontiers in Molecular Neuroscience · doi:10.3389/fnmol.2022.930599 · Cited by 24
Anti-obesity Properties of Phytochemicals: Highlighting their Molecular Mechanisms against Obesity
Poulios, E., Koukounari, S., Psara, E., Vasios, G. K., Sakarikou, C., & Giaginis, C. (2023) · Current Medicinal Chemistry · doi:10.2174/0929867330666230517124033 · Cited by 24
Nazari, A., Ghotbabadi, Z. R., Kazemi, K. S., Metghalchi, Y., Tavakoli, R., Rahimabadi, R. Z., & Ghaheri, M. (2023) · Clinical Therapeutics · doi:10.1016/j.clinthera.2023.10.019 · Cited by 25
Jacobo‐Velázquez, D. A. (2025) · Nutrients · doi:10.3390/nu17162648 · Cited by 21
Nrf2‐Mediated Ferroptosis Is Involved in Berberine‐Induced Alleviation of Diabetic Kidney Disease
Gao, K., Liu, Y., Li, K., Liu, L., Cai, Y., Zhang, X., & Zhao, Z. (2025) · Phytotherapy Research · doi:10.1002/ptr.8498 · Cited by 20
Anticancer Mechanisms of Berberine: A Good Choice for Glioblastoma Multiforme Therapy
Bibak, B., Shakeri, F., Keshavarzi, Z., Mollazadeh, H., Javid, H., Jalili‐Nik, M., Sathyapalan, T., Afshari, A. R., & Sahebkar, A. (2022) · Current Medicinal Chemistry · doi:10.2174/0929867329666220224112811 · Cited by 20
Bandala, C., Carro-Rodríguez, J., Cárdenas-Rodríguez, N., Peña-Montero, I., Gómez-López, M., Hernández-Roldán, A. P., Huerta-Cruz, J. C., Muñoz-González, F., Ignacio-Mejía, I., Domínguez, B., et al. (2024) · Nutrients · doi:10.3390/nu16142284 · Cited by 18
Ożarowski, M., Karpiński, T. M. M., Czerny, B., Kamiński, A., & Seremak‐Mrozikiewicz, A. (2025) · Molecules · doi:10.3390/molecules30071561 · Cited by 18
Nematollahi, S., Pishdad, G. R., Zakerkish, M., Namjoyan, F., Angali, K. A., & Borazjani, F. (2022) · Diabetology & Metabolic Syndrome · doi:10.1186/s13098-022-00888-9 · Cited by 17
Kavyani, Z., shahhosseini, E., Moridpour, A. H., Falahatzadeh, M., Vajdi, M., Musazadeh, V., & Askari, G. (2023) · PharmaNutrition · doi:10.1016/j.phanu.2023.100364 · Cited by 17
Berberine alleviates diabetic retinopathy by regulating the Th17/Treg ratio
Yang, Y., Wen, Z., Zhang, Y., Li, P., Zhao, J., Sun, Y., Wang, P., & Lin, W. (2024) · Immunology Letters · doi:10.1016/j.imlet.2024.106862 · Cited by 17
EPH/Ephrin-Targeting Treatment in Breast Cancer: A New Chapter in Breast Cancer Therapy
Psilopatis, I., Souferi-Chronopoulou, E., Vrettou, K., Troungos, C., & Theocharis, S. E. (2022) · International Journal of Molecular Sciences · doi:10.3390/ijms232315275 · Cited by 15
Wang, J., Chang, X., Li, C., Gao, J., Guo, Z., Zhuang, H., Wang, L., Huang, Y., Wang, W., Li, C., et al. (2025) · Advanced Science · doi:10.1002/advs.202412698 · Cited by 16
Self-citationTouny, A. A., Venkataraman, B., Ojha, S. K., Pessia, M., Subramanian, V. S., gowdru, S. N. H., & Subramanya, S. B. (2024) · Nutrients · doi:10.3390/nu16213633 · Cited by 15
A Comprehensive Review Highlighting the Prospects of Phytonutrient Berberine as an Anticancer Agent
Haque, S., Mathkor, D. M., Bhat, S. A., Musayev, A., Khituova, L., Ramniwas, S., Phillips, E., Swamy, N., Kumar, S., Yerer, M. B., et al. (2024) · Journal of Biochemical and Molecular Toxicology · doi:10.1002/jbt.70073 · Cited by 15
Bhattacharjee, K., Nath, M., & Choudhury, Y. (2021) · Phytomedicine Plus · doi:10.1016/j.phyplu.2021.100098 · Cited by 14
Nutraceutical Aid for Allergies – Strategies for Down-Regulating Mast Cell Degranulation
McCarty, M. F., Lerner, A., DiNicolantonio, J. J., & Benzvi, C. (2021) · Journal of Asthma and Allergy · doi:10.2147/jaa.s332307 · Cited by 14
Wang, J., Bi, C., Xi, H., & Wei, F. (2024) · Frontiers in Pharmacology · doi:10.3389/fphar.2024.1455534 · Cited by 13
Self-citationPérez‐Martínez, P., Ros, E., Pedro‐Botet, J., Civeira, F., Pascual, V., Garcés, C., Solà, R., Pérez‐Jiménez, F., & Mostaza, J. M. (2023) · Clínica e Investigación en Arteriosclerosis (English Edition) · doi:10.1016/j.artere.2023.09.003 · Cited by 13
Lack of berberine effect on bone mechanical properties in rats with experimentally induced diabetes
Londzin, P., Kocik, S., Kisiel-Nawrot, E., Janas, A., Skoczyńska, A., Krivošíková, Z., Stefikova, K., Gajdoš, M., Cegieła, U., & Folwarczna, J. (2021) · Biomedicine & Pharmacotherapy · doi:10.1016/j.biopha.2021.112562 · Cited by 13
Tehrani, S. D., Shojaei, M., Bagherniya, M., Pirro, M., & Sahebkar, A. (2023) · Phytotherapy Research · doi:10.1002/ptr.7763 · Cited by 14
Pierro, F. D., Rabbani, F., Tareen, M., Nigar, R., Khan, A. P., Zerbinati, N., Tanda, M. L., Cazzaniga, M., Bertuccioli, A., Falasca, P., et al. (2025) · Frontiers in Nutrition · doi:10.3389/fnut.2025.1519459 · Cited by 12
Mansour, A., Sajjadi‐Jazi, S. M., Gerami, H., Khorasanian, A. S., Moalemzadeh, B., Karimi, S., Afrakoti, N. M., Mofid, V., Mohajeri‐Tehrani, M. R., & Hekmatdoost, A. (2025) · European Journal of Nutrition · doi:10.1007/s00394-025-03618-9 · Cited by 12
Zhao, J. V., Huang, X., Zhang, J., Chan, Y., Tse, H., & Blais, J. E. (2023) · Journal of Nutrition · doi:10.1016/j.tjnut.2023.08.016 · Cited by 12
Ruíz-Herrera, V. V., Navarro-Lara, S. A., Andrade-Villanueva, J. F., Álvarez-Zavala, M., Sánchez-Reyes, K., Toscano-Piña, M., Méndez-Clemente, A. S., Martínez-Ayala, P., Valle-Rodríguez, A., & González-Hernández, L. A. (2023) · International Journal of STD & AIDS · doi:10.1177/09564624231196600 · Cited by 10
Wade, U., Pascual-Figal, D. A., Rabbani, F., Ernst, M., Albert, A., Janssens, I., Dierckxsens, Y., Iqtadar, S., Khokhar, N. A., Kanwal, A., et al. (2024) · Nutrients · doi:10.3390/nu16081204 · Cited by 10
Hyaluronic Acid/Gelatin Coaxial Nanofibers Incorporated with Berberine–Arginine for Wound Healing
Koohzad, F., & Asoodeh, A. (2024) · ACS Applied Nano Materials · doi:10.1021/acsanm.4c02174 · Cited by 10
Zyryanov, S. K., & Butranova, O. I. (2022) · Russian Journal of Cardiology · doi:10.15829/1560-4071-2022-5271 · Cited by 10
Lei, L., Li, J.-K., & Wang, B. (2023) · Cardiology Discovery · doi:10.1097/cd9.0000000000000087 · Cited by 9
The effect of berberine on obesity indices: a systematic review and meta-analysis
Vahed, I. E., Shahir-Roudi, E., Nojumi, S., Golmohammadi, S., Shahrebabak, M. M., Moghadam, N. S. T., Bagheryan, A. S., Moftakhar, M., Shamsipour, F., Jafari, M., et al. (2025) · International Journal of Obesity · doi:10.1038/s41366-025-01943-x · Cited by 9
Wang, Q., Shi, H., Zhuang, H., Dong, G., Gao, K., Liu, L., Zhou, H., Nie, Y., Wang, J., & Liu, L. (2025) · International Journal of Medical Sciences · doi:10.7150/ijms.101520 · Cited by 9
Self-citationZhang, R., Xiao, Y., Yan, J., Wen, Y., Wu, X., Mei, Z., & Zhou, Z. (2022) · Frontiers in Endocrinology · doi:10.3389/fendo.2022.876657 · Cited by 9
Ibi, A., Chang, C., Kuo, Y. C., Zhang, Y., Du, M., Roh, Y. S., Gahler, R. J., Hardy, M. L., & Solnier, J. (2025) · Metabolites · doi:10.3390/metabo15040240 · Cited by 8
Pérez‐Martínez, P., Ros, E., Pedro‐Botet, J., Civeira, F., Pascual, V., Garcés, C., Solà, R., Pérez‐Jiménez, F., & Mostaza, J. M. (2023) · Clínica e Investigación en Arteriosclerosis · doi:10.1016/j.arteri.2023.02.002 · Cited by 11
Anti-seizure Effects and Mechanisms of Berberine: A Systematic Review
Jivad, N., Heidari-Soureshjani, S., Bagheri, H., Sherwin, C. M. T., & Rostamian, S. (2024) · Current Pharmaceutical Biotechnology · doi:10.2174/0113892010283237240107121749 · Cited by 8
Alzhrani, R. F., Alhowyan, A., Taha, E. I., Attia, S. M., Salama, S. A., & Harisa, G. I. (2025) · Experimental Cell Research · doi:10.1016/j.yexcr.2025.114647 · Cited by 7
Liu, X., Zhang, W., Miao, X., & Hu, Y. (2025) · Frontiers in Pharmacology · doi:10.3389/fphar.2025.1656751 · Cited by 7
Self-citationAdeniji, O. O., Akinmoladun, O. F., & Njobeh, P. B. (2025) · Food Safety and Risk · doi:10.1186/s40550-025-00120-2 · Cited by 6
Chang, C., Roh, Y. S., Du, M., Kuo, Y. C., Zhang, Y., Hardy, M. L., Gahler, R. J., & Solnier, J. (2024) · International Journal of Molecular Sciences · doi:10.3390/ijms25115625 · Cited by 6
Menteşe, A., Demir, S., Yuluğ, E., Alemdar, N. T., Durmus, T. B., Demir, E. A., & Aliyazıcıoğlu, Y. (2025) · Kuwait Journal of Science · doi:10.1016/j.kjs.2025.100519 · Cited by 5
Brechtel, J., Lietz, C., Adscheid, S. A., & Friedland, K. (2026) · Pharmacological Research · doi:10.1016/j.phrs.2026.108227 · Cited by 5
Recent studies on berberine and its biological and pharmacological activities
Nadalin, P., Kim, Y., & Park, S. U. (2023) · EXCLI journal · doi:10.17179/excli2023-5898 · Cited by 5
A Review of the Antiviral Activity of Berberine
Forouzanfar, F., & Meshkat, Z. (2025) · Current Drug Discovery Technologies · doi:10.2174/0115701638360834250113111936 · Cited by 5
Natural Compounds Exert Anti‐Obesity Effects by Regulating Cytokines
Zhang, Y., Feng, G., Zhang, W., & Liu, X. (2025) · Phytotherapy Research · doi:10.1002/ptr.8508 · Cited by 5
Self-citationMechanistic pathway of herbs in the amelioration of NAFLD: A systematic review
Jayanti, N. E., Said, R. M., Jofrry, S. M., & Choo, C. (2024) · World Academy of Sciences Journal · doi:10.3892/wasj.2024.245 · Cited by 5
Jia, D., Zhang, X., Guo, Q., Yang, R., Yu, H., Zhao, M., Liu, S., Liu, M., Wu, A., & Zhang, D. (2022) · Journal of Cardiovascular Pharmacology · doi:10.1097/fjc.0000000000001308 · Cited by 4
Wang, X., Hou, R., Chen, Z., Wang, X., Malek, M., & Wang, H. (2025) · Food Science & Nutrition · doi:10.1002/fsn3.70563 · Cited by 5
Dobre, M.-Z., Vîrgolici, B., Doicin, I.-C., Vîrgolici, H., & Stănescu-Spînu, I.-I. (2025) · International Journal of Molecular Sciences · doi:10.3390/ijms262010183 · Cited by 6
Profiling the Complexity of Resistance Factors in Cancer Cells Towards Berberine and Its Derivatives
Özenver, N., Ali, N. T., Yücer, R., Lei, X., Bringmann, G., Efferth, T., & Dawood, M. (2025) · Pharmaceuticals · doi:10.3390/ph19010027 · Cited by 3
Berberine Ameliorates Pulmonary Fibrosis via Downregulating the TGFBR2 ‐Mediated Signaling
Zhao, Y., Li, Q., Zhu, H., Jiang, C., Chen, M., Ye, X., Hou, S., Cui, S., Huang, X., & Cao, M. (2026) · Chemical Biology & Drug Design · doi:10.1111/cbdd.70264 · Cited by 3
Berberine for Adjunct/Alternative Treatment of Dyslipidemia: A Literature Review
Evbayekha, E. O., Nwachukwu, E. U., Nikravesh, E., Rosas, V., Onuegbu, C. A., Egwuonwu, O. F., Eguagie, O., Chioma, O. E., Agho, A. V., Samuels, K. A., et al. (2023) · Cureus · doi:10.7759/cureus.39261 · Cited by 3
Sharma, R., & Sharma, A. (2024) · Translational Medicine of Aging · doi:10.1016/j.tma.2024.09.001 · Cited by 3
Gliozzi, M., Coppoletta, A. R., Cardamone, A., Carresi, C., Mollace, R., Musolino, V., & Mollace, V. (2025) · Pharmacological Research · doi:10.1016/j.phrs.2025.107744 · Cited by 3
Victoria‐Montesinos, D., Cerdá, B., Zafrilla, P., Ballester, P., & García‐Muñoz, A. M. (2025) · International Journal of Molecular Sciences · doi:10.3390/ijms26125565 · Cited by 3
Charge balanced aggregation: A universal approach to aqueous organic nanocrystals
Zhao, W., Li, Q., He, P. L., Li, C., Aryal, M., Fabiilli, M. L., & Xiao, H. (2024) · Journal of Controlled Release · doi:10.1016/j.jconrel.2024.09.017 · Cited by 3
McCarty, M. F., & DiNicolantonio, J. J. (2021) · Healthcare · doi:10.3390/healthcare10010003 · Cited by 3
Blais, J. E., Huang, X., & Zhao, J. V. (2022) · medRxiv · doi:10.1101/2022.06.20.22276676 · Cited by 31
“hypoglycemics, lifestyle modification), assessed extracts from the barberry plant or defined the intervention as combination nutraceutical products containing berberine such as Armolipid Plus®.(7-13) Moreover, the bioavailability of the different berberine preparations is a matter of .”
BackgroundMethodActive immunization: A novel therapeutic strategy for treating Alzheimer's disease
Mazahir, F. (2025) · European Journal of Pharmacology · doi:10.1016/j.ejphar.2025.178288 · Cited by 3
Papadopoulou, P., & Theoharides, T. C. (2026) · Biomedicines · doi:10.3390/biomedicines14051073 · Cited by 2
Synergistic Potential of Berberine and Metformin: Unlocking Enhanced Anti‐Diabetic Efficacy
Bhushan, R., Rehman, M. T., Alajmi, M. F., Alam, M. R., Rahman, S., & Dubey, P. K. (2026) · Chemical Biology & Drug Design · doi:10.1111/cbdd.70317 · Cited by 2
Exploring Pharmacological Mechanisms, Clinical Trials and Patent Landscapes of Berberine: A Review
Saini, V., Deswal, G., Dhingra, A. K., Singh, J., Kumar, J., & Saini, A. (2024) · The Natural Products Journal · doi:10.2174/0122103155324599241028163050 · Cited by 2
(EFSA), E. F. S. A. (2023) · EFSA Supporting Publications · doi:10.2903/sp.efsa.2023.en-8246 · Cited by 2
Ye, J., Chen, S., Mao, S., Jaffrezic-Renault, N. J., & Guo, Z. (2025) · Electroanalysis · doi:10.1002/elan.70021 · Cited by 2
Integrative natural health solutions for midlife women
Dahia, V., Shannon, W., Suraev, A. S., Villella, S., Münch, G. W., Chan-Lau, D., & Hunter, D. J. (2025) · Frontiers in Nutrition · doi:10.3389/fnut.2025.1629648 · Cited by 1
Jiang, Y., 陶大云, Jin, Z., Li, Z., He, X., Zhou, H., Zhu, H., & Ren, L. (2026) · Acta Diabetologica · doi:10.1007/s00592-026-02660-1 · Cited by 1
Qasim, Q. A., Ibrahim, A. Y., Hadi, A. M., & Al-Hussaniy, H. A. (2026) · Clinical Diabetology · doi:10.5603/cd.110850 · Cited by 1
Mazahir, F., Rahi, V., Kumar, A., Kaundal, R. K., & Yadav, A. K. (2026) · Nanomedicine Nanotechnology Biology and Medicine · doi:10.1016/j.nano.2026.102934 · Cited by 1
Sahariah, P., Saikia, L., Bharali, A., Law, D., Sen, S., Sivasamugham, L. A., & Dutta, P. P. (2026) · Inflammation Research · doi:10.1007/s00011-026-02253-2 · Cited by 1
Safety and metabolic effects of HTD1801 in type 2 diabetes and MASLD: a phase Ib randomized trial
Mai, J., Zhang, H., Wu, M., Meng, Y., LIU, K., Wang, G., & Ding, Y. X. (2026) · Diabetology & Metabolic Syndrome · doi:10.1186/s13098-026-02202-3 · Cited by 1
The inhibition of pathological IgE in allergic diseases by natural compounds
Carnazza, M. A., Begley, M., Tiwari, R. K., Geliebter, J., Yang, N., Zhan, J., & Li, X.-M. (2026) · Natural Products and Bioprospecting · doi:10.1007/s13659-026-00596-1 · Cited by 1
Chang, C., Du, M., Roh, K., Kuo, Y. C., Zhang, Y., Hardy, M. L., Gahler, R. J., & Solnier, J. (2023) · Journal of Natural Health Product Research · doi:10.1515/jnhpr-2023-050201 · Cited by 1
Natural products from selected medicinal plants as potential therapeutics in Alzheimer's disease
Nair, P. G., Dixit, A. K., Dixit, D., Rotwar, D. S., & Sharma, M. K. (2024) · Studies in natural products chemistry · doi:10.1016/b978-0-443-15628-1.00008-8 · Cited by 1
Clement, Y. N., Liwa, A. C., Barton, E. N., Cole, W. C., & Nwokocha, C. R. (2023) · Elsevier eBooks · doi:10.1016/b978-0-443-18657-8.00033-5
Effects of common supplements on human platelet aggregation in vitro
Prabhakar, N., & Prabhakar, A. (2025) · Journal of Emerging Investigators · doi:10.59720/24-128
Permana, N. J. (2025) · PREPOTIF Jurnal Kesehatan Masyarakat · doi:10.31004/prepotif.v9i1.43929
Lawati, A. A., Alhabsi, A. N., Sabti, A. A., Krishnan, R. S., Alkindi, S., Das, S., & Al-Abri, M. (2025) · Metabolism Open · doi:10.1016/j.metop.2025.100387
Jiang, C., & Martirosyan, D. M. (2025) · Agriculture and Food Bioactive Compounds · doi:10.31989/afbc.v2i9.1755
Nematollahi, S., Pishdad, G. R., Zakerkish, M., Namjoyan, F., Angali, K. A., & Borazjani, F. (2022) · Figshare · doi:10.6084/m9.figshare.20579778
Additional file 3 of Review of potential medical treatments for middle ear cholesteatoma
Schürmann, M., Goon, P. K. C., & Sudhoff, H. (2022) · Figshare · doi:10.6084/m9.figshare.21162819
Metadata
- Authors
- Ye, Y., Liu, X., Wu, N., Han, Y., Wang, J., Yu, Y., & Chen, Q.
- Affiliations
- Hubei University of Science and Technology (CN)
- Hubei University of Medicine (CN)
- Corresponding author
- Yu, Yuandong
- Chen, Qingjie
- Venue
- Frontiers in Pharmacology
- Publisher
- Frontiers Media SA
- Published
- 2021-04-26
- Volume
- 12
- Pages
- 653887-653887
- ISSN
- 1663-9812 (ISSN-L)
- PMC
- PMC8107691
- OpenAlex
- W3160298538
- Cited by
- 109
- References
- 38
- Citations by year
- 2026: 18 · 2025: 28 · 2024: 18 · 2023: 24 · 2022: 15 · 2021: 6
- FWCI
- 1.99
- Type
- journal article
- Language
- en
- Open access
- gold
- doi.org
- Licence
- Locations
- Frontiers in Pharmacology (publishedVersion, cc-by)
- PubMed Central (publishedVersion, cc-by)
- PubMed (publishedVersion)
- DOAJ (DOAJ: Directory of Open Access Journals) (submittedVersion, cc-by-sa)
- Funders
- Hubei Provincial Department of Education (BK202009, D20202803)
- Natural Science Foundation of Hubei Province (2020CFB851)
- Hubei University
- Hubei University of Science and Technology
- Topics
- Health Sciences › Medicine › Pharmacology (medical) › Berberine and alkaloids research
- Health Sciences › Medicine › Endocrinology, Diabetes and Metabolism › Natural Antidiabetic Agents Studies
- Life Sciences › Biochemistry, Genetics and Molecular Biology › Molecular Biology › Metabolism, Diabetes, and Cancer
- Keywords
- berberine, metabolic disorders, triglycerides, total cholesterol, LDL cholesterol, HDL cholesterol, insulin resistance, fasting blood glucose, serum lipids, treatment efficacy and safety
About these checks
Registry, retraction, Cites and statistics results are computed, not judged, with one exception: a printed reference that no index lists is read once by a model before it counts as a citation error. Claims are extracted by a model and kept only when their quote appears verbatim in the text; each cited source is then checked, with a model’s help, for whether it says what the claim relies on. Those verdicts can be wrong — read the claim’s quote and the cited source before relying on one.
Statistics and arithmetic are recomputed, not judged.
Confidence bands are shown only for fields calibrated on our annotated test set. None is calibrated yet, so no band is shown.
What counts as a claim ›How we measure confidence ›How we check this ›
Are you an author, or do you see a problem with this page? Request a review
