

The DOI matches its Crossref record; 2 of the 2 references it cites were found in a registry or an index.
Photodynamic Therapy Activity of New Porphyrin-Xylan-Coated Silica Nanoparticles in Human Colorectal Cancer
Abstract
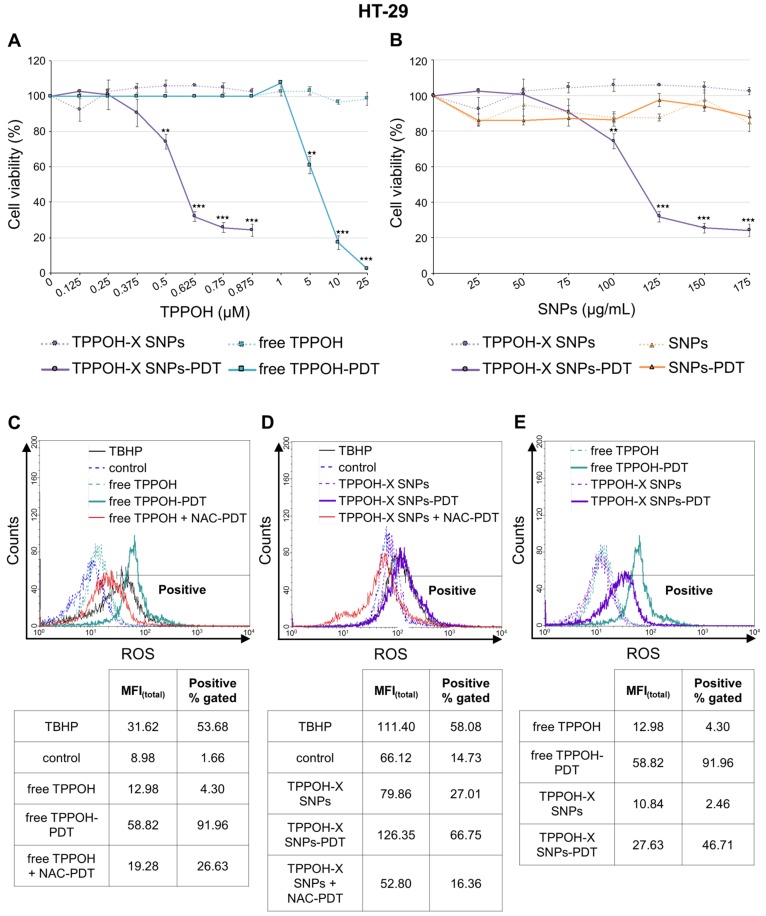
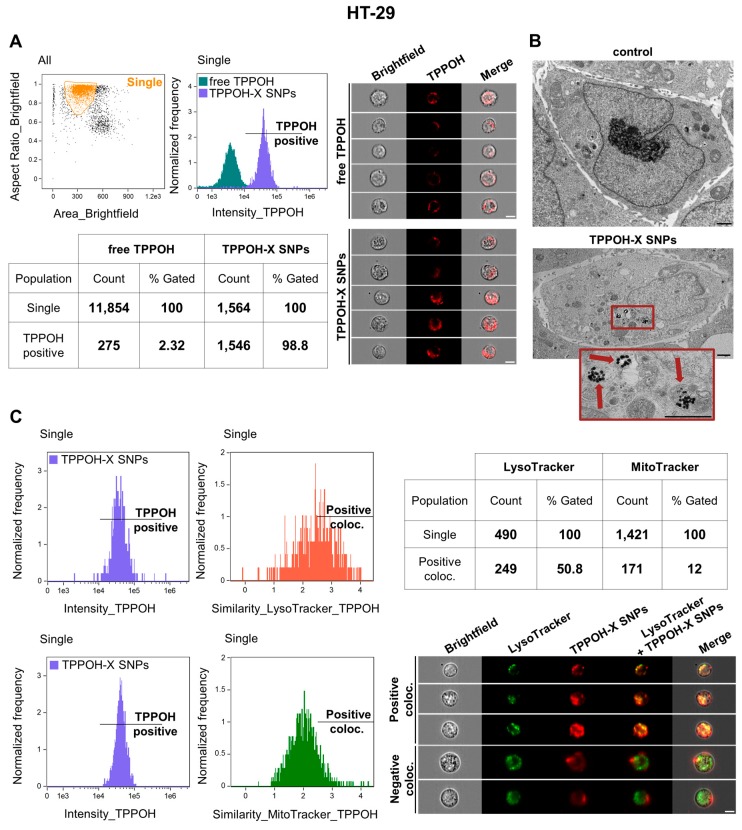
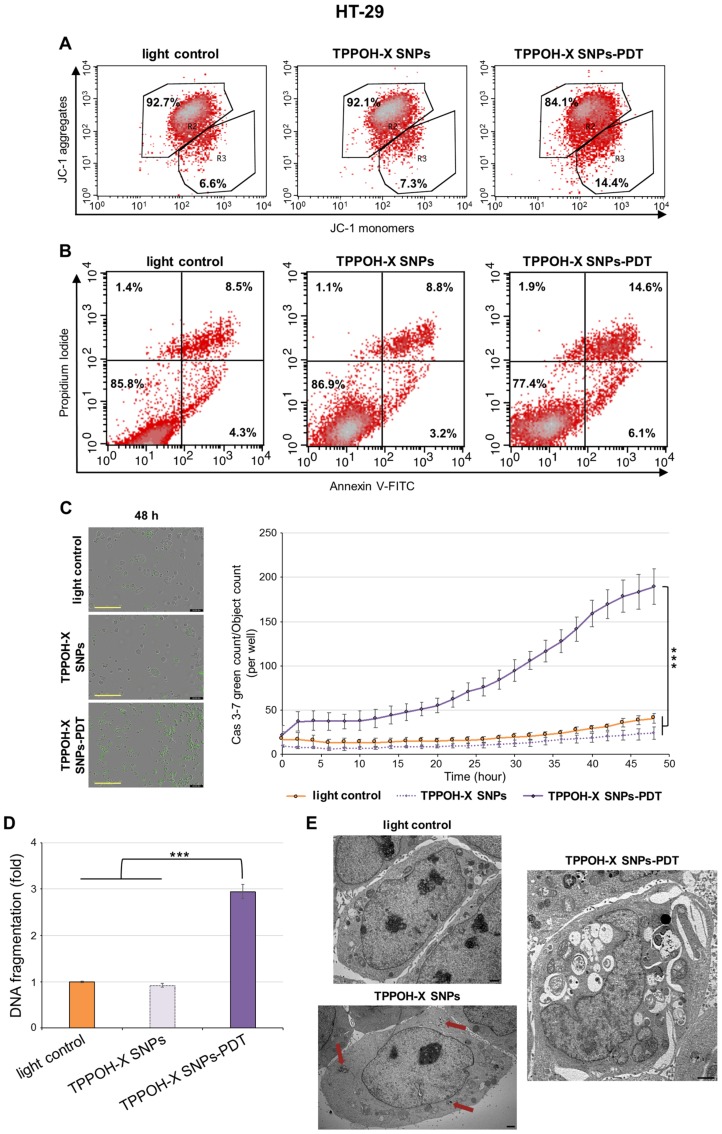
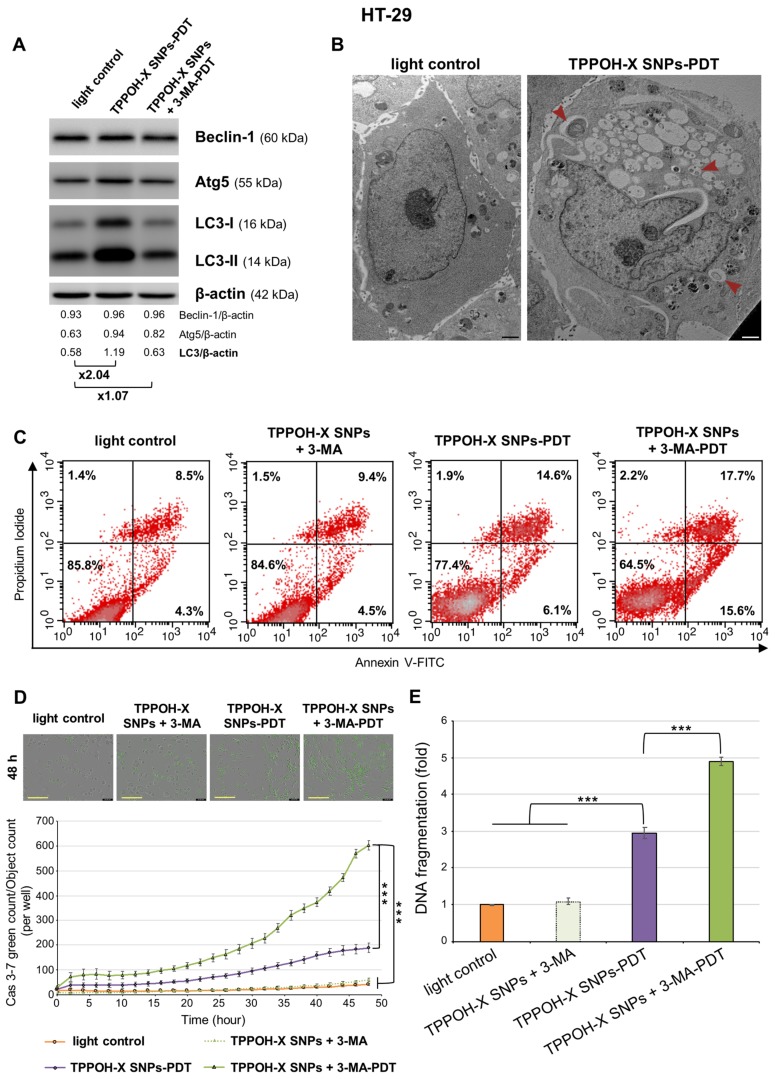
Photodynamic therapy (PDT) using porphyrins has been approved for treatment of several solid tumors due to the generation of cytotoxic reactive oxygen species (ROS). However, low physiological solubility and lack of selectivity towards tumor sites are the main limitations of their clinical use. Nanoparticles are able to spontaneously accumulate in solid tumors through an enhanced permeability and retention (EPR) effect due to leaky vasculature, poor lymphatic drainage, and increased vessel permeability. Herein, we proved the added value of nanoparticle vectorization on anticancer efficacy and tumor-targeting by 5-(4-hydroxyphenyl)-10,15,20-triphenylporphyrin (TPPOH). Using 80 nm silica nanoparticles (SNPs) coated with xylan-TPPOH conjugate (TPPOH-X), we first showed very significant phototoxic effects of TPPOH-X SNPs mediated by post-PDT ROS generation and stronger cell uptake in human colorectal cancer cell lines compared to free TPPOH. Additionally, we demonstrated apoptotic cell death induced by TPPOH-X SNPs-PDT and the interest of autophagy inhibition to increase anticancer efficacy. Finally, we highlighted in vivo, without toxicity, elevated anticancer efficacy of TPPOH-X SNPs through improvement of tumor-targeting compared to a free TPPOH protocol. Our work demonstrated for the first time the strong anticancer efficacy of TPPOH in vitro and in vivo and the merit of SNPs vectorization.
Overview
The claims and statistics of this paper haven’t been checked yet.
Run the check — free, no account needed. It reads the open-access text and checks the sources it cites.
Integrity signals
Registry
Cites
Statistics
Figures
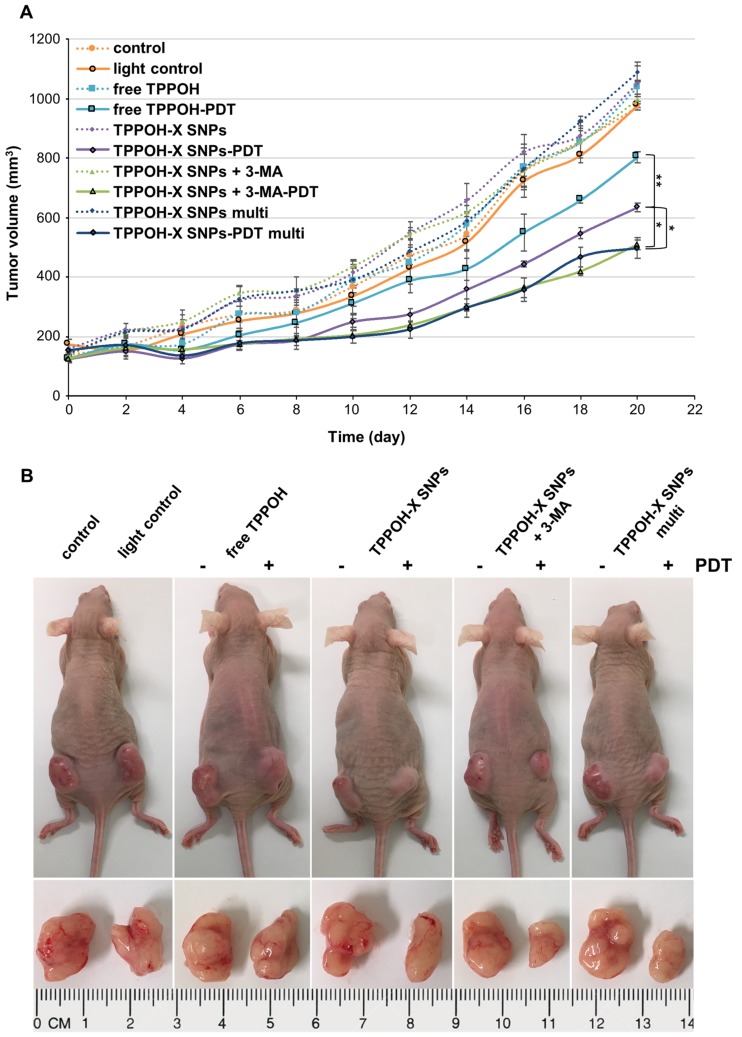
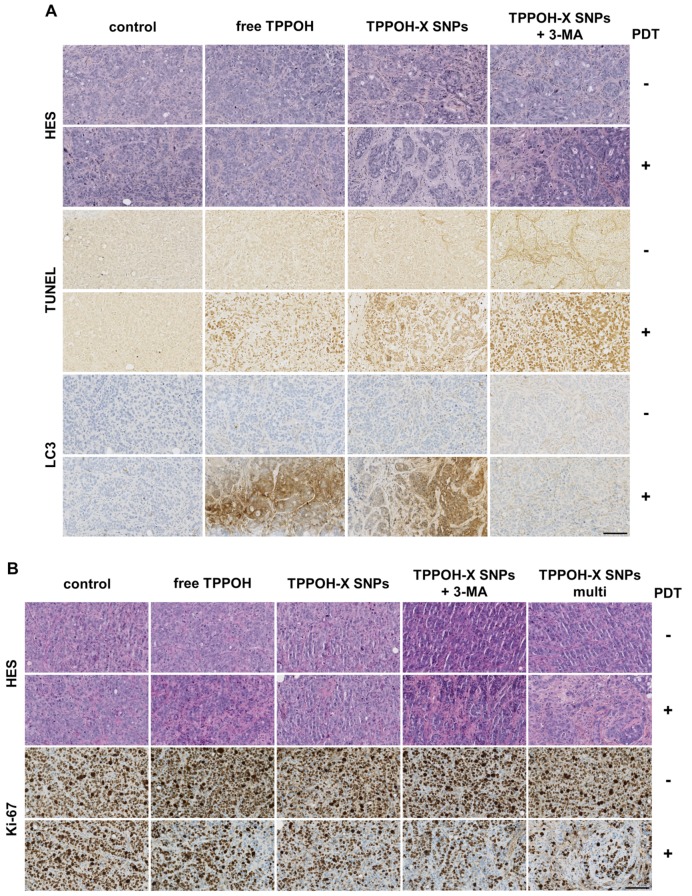
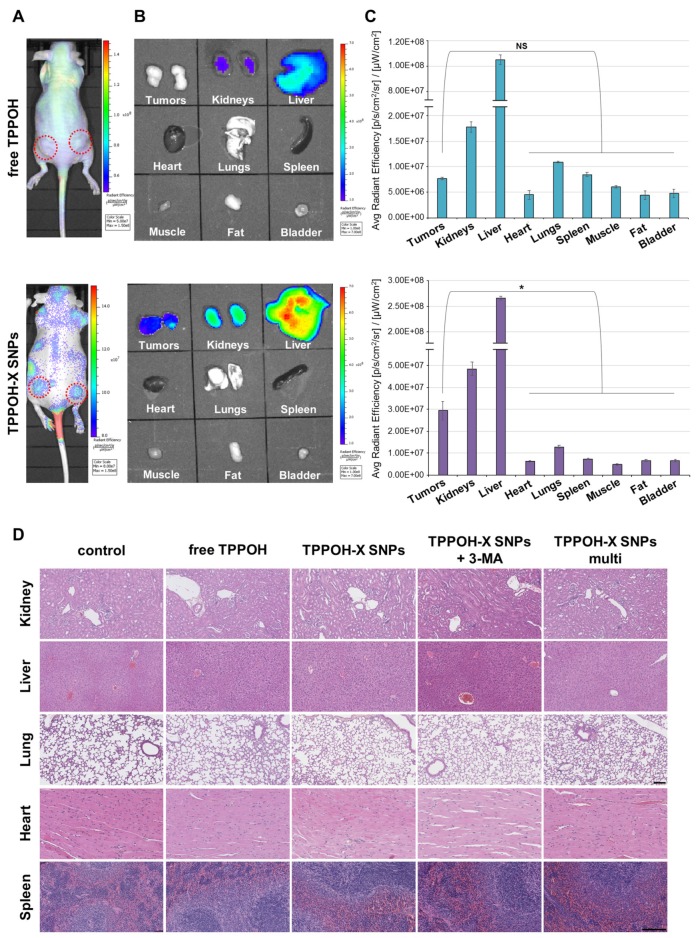
Verification
Claims the paper makes
The claims and statistics of this paper haven’t been checked yet.
Run the check — free, no account needed. It reads the open-access text and checks the sources it cites.
Claims other papers make about this one
Each is checked against this paper’s own text: does it say what the citing paper says it does?
In the citing paper
“However, to date, reports on the application of xylan for anti-cancer drug delivery have only investigated ordinary nanocarriers to increase the water dispersibility of hydrophobic drugs and use the enhanced permeability and retention effects of tumors19,20.”
From Combining gut microbiota modulation and chemotherapy by capecitabine-loaded prebiotic nanoparticle improves colorectal cancer therapy (2023) · cites this paper as [20]
Self-check
Percentages, sums and reported differences re-computed from the paper’s own numbers.
The self-check needs the paper’s full text.
Citations
Cites
Photodynamic therapy – mechanisms, photosensitizers and combinations
Kwiatkowski, S., Knap, B., Przystupski, D., Saczko, J., Kędzierska, E., Knap-Czop, K., Kotlińska, J., Michel, O., Kotowski, K., & Kulbacka, J. (2018) · Biomedicine & Pharmacotherapy · doi:10.1016/j.biopha.2018.07.049 · Cited by 2,173 · cited 1×
“Relative to traditional therapies, PDT has several advantages including non-invasive therapy, non-cytotoxic molecules without light activation, and site-specific light treatment which decreases the side effects, thus accelerating the healing process [8,9].”
BackgroundLi, X., Zhu, F., Jiang, J., Sun, C., Wang, X., Shen, M., Tian, R., Shi, C., Xu, M., Peng, F., et al. (2015) · Cancer Letters · doi:10.1016/j.canlet.2014.11.026 · Cited by 116 · cited 1×
“PDT-induced ROS-generation triggers mitochondrial pore-opening leading to caspase activation and thus induces apoptotic cell death [50,51].”
Background
Research works printed but not linked: 61
- Xue, 2018, An Update on Colorectal Cancer, Curr. Probl. Surg., 5555, 76, 10.1067/j.cpsurg.2018.02.003 · DOI
- Matsuda, 2018, Recent updates in the surgical treatment of colorectal cancer, Ann. Gastroenterol. Surg., 22, 129, 10.1002/ags3.12061 · DOI
- Wolpin, 2008, Systemic Treatment of Colorectal Cancer, Gastroenterology, 134134, 1296, 10.1053/j.gastro.2008.02.098 · DOI
- Lee, 2018, Molecular targeted therapy: Treating cancer with specificity, Eur. J. Pharmacol., 834, 188, 10.1016/j.ejphar.2018.07.034 · DOI
- Xu, 2018, Drug resistance and new therapies in colorectal cancer, World J. Gastroenterol., 2424, 3834
- Bugaj, 2016, Photodynamic therapy in colorectal cancer treatment-The state of the art in preclinical research, Photodiagnosis Photodyn. Ther., 13, 158, 10.1016/j.pdpdt.2015.07.175 · DOI
- Dolmans, 2003, Photodynamic therapy for cancer, Nat. Rev. Cancer, 33, 380, 10.1038/nrc1071 · DOI
- DeRosa, 2002, Photosensitized singlet oxygen and its applications, Coord. Chem. Rev., 233, 351, 10.1016/S0010-8545(02)00034-6 · DOI
- Mroz, 2011, Cell Death Pathways in Photodynamic Therapy of Cancer, Cancers, 33, 2516, 10.3390/cancers3022516 · DOI
- Plaetzer, 2003, The Modes of Cell Death Induced by PDT: An Overview, Med. Laser Appl., 1818, 7, 10.1078/1615-1615-00082 · DOI
- Abrahamse, 2016, New photosensitizers for photodynamic therapy, Biochem. J., 473473, 347, 10.1042/BJ20150942 · DOI
- Saini, 2012, Strategies of Targeting Tumors and Cancers, J. Cancer Res. Updates, 1, 129
- Huang, 2012, Can nanotechnology potentiate photodynamic therapy?, Nanotechnol. Rev., 11, 111, 10.1515/ntrev-2011-0005 · DOI
- Iyer, 2006, Exploiting the enhanced permeability and retention effect for tumor targeting, Drug. Discov. Today, 1111, 812, 10.1016/j.drudis.2006.07.005 · DOI · Paper page
- Zhou, 2016, Porphyrin-loaded nanoparticles for cancer theranostics, Nanoscale, 8, 12394, 10.1039/C5NR07849K · DOI
- Debele, 2015, Drug Carrier for Photodynamic Cancer Therapy, Int. J. Mol. Sci., 16, 22094, 10.3390/ijms160922094 · DOI
- Wu, 2014, Recent Development of Silica Nanoparticles as Delivery Vectors for Cancer Imaging and Therapy, Nanomedicine, 10, 297, 10.1016/j.nano.2013.08.008 · DOI
- Couleaud, 2010, Silica-based nanoparticles for photodynamic therapy applications, Nanoscale, 2, 1083, 10.1039/c0nr00096e · DOI
- Chen, 2013, In Vivo Bio-Safety Evaluations and Diagnostic/Therapeutic Applications of Chemically Designed Mesoporous Silica Nanoparticles, Adv. Mater., 25, 3144, 10.1002/adma.201205292 · DOI
- Lemarchand, 2004, Polysaccharide-decorated nanoparticles, Eur. J. Pharm. Biopharm., 58, 327, 10.1016/j.ejpb.2004.02.016 · DOI
- Owens, 2006, Opsonization, biodistribution, and pharmacokinetics of polymeric nanoparticles, Int. J. Pharm., 307, 93, 10.1016/j.ijpharm.2005.10.010 · DOI · Paper page
- Shrotri, 2017, Chapter Two-Catalytic Conversion of Structural Carbohydrates and Lignin to Chemicals, Adv. Catal., 60, 59, 10.1016/bs.acat.2017.09.002 · DOI
- Ma, 2018, Synthesis and characterization of biofunctional quaternized xylan-Fe2O3 core/shell nanocomposites and modification with polylysine and folic acid, Carbohydr. Polym., 199, 382, 10.1016/j.carbpol.2018.07.003 · DOI
- Daus, 2010, Xylan-based nanoparticles: Prodrugs for ibuprofen release, Macromol. Biosci., 10, 211, 10.1002/mabi.200900201 · DOI
- Bouramtane, 2019, Porphyrin-xylan-coated silica nanoparticles for anticancer photodynamic therapy, Carbohydr. Polym., 213, 168, 10.1016/j.carbpol.2019.02.070 · DOI
- Lai, 2014, The significance of autophagy in colorectal cancer pathogenesis and implications for therapy, J. Clin. Pathol., 67, 854, 10.1136/jclinpath-2014-202529 · DOI
- Duan, 2018, Ready player one? Autophagy shapes resistance to photodynamic therapy in cancers, Apoptosis, 23, 587, 10.1007/s10495-018-1489-0 · DOI
- Hackbarth, 2001, Photophysical properties of pheophorbide-a-substituted diaminobutane poly-propylene-imine dendrimer, Chem. Phys., 269, 339, 10.1016/S0301-0104(01)00337-8 · DOI
- Li, 2007, Dendrimer Generation Effects on Photodynamic Efficacy of Dendrimer Porphyrins and Dendrimer-Loaded Supramolecular Nanocarriers, Chem. Mater., 19, 5557, 10.1021/cm071451m · DOI
- Roy, 2003, Ceramic-based nanoparticles entrapping water-insoluble photosensitizing anticancer drugs: A novel drug-carrier system for photodynamic therapy, J. Am. Chem. Soc., 125, 7860, 10.1021/ja0343095 · DOI
- Secret, 2013, Anionic porphyrin-grafted porous silicon nanoparticles for photodynamic therapy, Chem. Commun. (Camb.), 49, 4202, 10.1039/c3cc38837a · DOI
- Youssef, 2018, Titania and silica nanoparticles coupled to Chlorin e6 for anti-cancer photodynamic therapy, Photodiagnosis Photodyn. Ther., 22, 115, 10.1016/j.pdpdt.2018.03.005 · DOI
- Bharathiraja, 2017, Chlorin e6 conjugated silica nanoparticles for targeted and effective photodynamic therapy, Photodiagnosis Photodyn. Ther., 19, 212, 10.1016/j.pdpdt.2017.06.001 · DOI
- Ulbrich, 2018, Silica-based nanoparticles are efficient delivery systems for temoporfin, Photodiagnosis Photodyn. Ther., 21, 275, 10.1016/j.pdpdt.2017.12.014 · DOI
- Simon, 2010, Pp IX silica nanoparticles demonstrate differential interactions with in vitro tumor cell lines and in vivo mouse models of human cancers, Photochem. Photobiol., 86, 213, 10.1111/j.1751-1097.2009.00620.x · DOI
- Kumar, 2019, Lipophilic 5-fluorouracil prodrug encapsulated xylan-stearic acid conjugates nanoparticles for colon cancer therapy, Int. J. Biol. Macromol., 128, 204, 10.1016/j.ijbiomac.2019.01.101 · DOI
- Kumar, 2018, pH-responsive prodrug nanoparticles based on xylan-curcumin conjugate for the efficient delivery of curcumin in cancer therapy, Carbohydr. Polym., 188, 252, 10.1016/j.carbpol.2018.02.006 · DOI
- Liu, 2010, Endothelial cells dysfunction induced by silica nanoparticles through oxidative stress via JNK/P53 and NF-kB pathways, Biomaterials, 31, 8198, 10.1016/j.biomaterials.2010.07.069 · DOI
- Sergent, 2012, Toxicity and genotoxicity of nano-SiO2 on human epithelial intestinal HT-29 cell line, Ann. Occup. Hyg., 56, 622
- Cho, 2009, The impact of size on tissue distribution and elimination by single intravenous injection of silica nanoparticles, Toxicol. Lett., 189, 177, 10.1016/j.toxlet.2009.04.017 · DOI
- Kumar, 2010, In vivo biodistribution and clearance studies using multimodal organically modified silica nanoparticles, ACS Nano, 4, 699, 10.1021/nn901146y · DOI
- Chan, 2017, In vivo toxicologic study of larger silica nanoparticles in mice, Int. J. Nanomedicine, 12, 3421, 10.2147/IJN.S126823 · DOI
- Liu, 2011, Single and repeated dose toxicity of mesoporous hollow silica nanoparticles in intravenously exposed mice, Biomaterials, 32, 1657, 10.1016/j.biomaterials.2010.10.035 · DOI
- Zhou, 1989, Mechanisms of tumor necrosis induced by photodynamic therapy, J. Photochem. Photobiol. B, 3, 299, 10.1016/1011-1344(89)80035-1 · DOI
- Elmore, 2007, Apoptosis: A review of programmed cell death, Toxicol. Pathol., 35, 495, 10.1080/01926230701320337 · DOI · Paper page
- Skulachev, 1999, Mitochondrial physiology and pathology; concepts of programmed death of organelles, cells and organisms, Mol. Asp.S Med., 20, 139, 10.1016/S0098-2997(99)00008-4 · DOI
- Costa, L.D., de Silva, J.A., Fonseca, S.M., Arranja, C.T., Urbano, A.M., and Sobral, A.J.F.N. (2016). Photophysical Characterization and in Vitro Phototoxicity Evaluation of 5,10,15,20-Tetra (quinolin-2-yl) porphyrin as a Potential Sensitizer for Photodynamic Therapy. Molecules, 21. · DOI
- Baldea, 2015, Efficiency of photodynamic therapy on WM35 melanoma with synthetic porphyrins: Role of chemical structure, intracellular targeting and antioxidant defense, J. Photochem. Photobiol. B, 151, 142, 10.1016/j.jphotobiol.2015.07.019 · DOI
- Liao, 2016, Tetraphenylporphyrin derivatives possessing piperidine group as potential agents for photodynamic therapy, J. Photochem. Photobiol. B, 165, 213, 10.1016/j.jphotobiol.2016.10.031 · DOI
- Roby, 2007, Enhanced in vivo antitumor efficacy of poorly soluble PDT agent, meso-tetraphenylporphine, in PEG-PE-based tumor-targeted immunomicelles, Cancer Biol. Ther., 6, 1136, 10.4161/cbt.6.7.4345 · DOI
- Wu, 2019, Self-Luminescing Theranostic Nanoreactors with Intraparticle Relayed Energy Transfer for Tumor Microenvironment Activated Imaging and Photodynamic Therapy, Theranostics, 9, 20, 10.7150/thno.28857 · DOI
- Janku, 2011, Autophagy as a target for anticancer therapy, Nat. Rev. Clin. Oncol., 8, 528, 10.1038/nrclinonc.2011.71 · DOI
- Xue, 2015, Role of p38MAPK in apoptosis and autophagy responses to photodynamic therapy with Chlorin e6, Photodiagnosis Photodyn. Ther., 12, 84, 10.1016/j.pdpdt.2014.12.001 · DOI
- Xiong, 2017, Autophagy inhibition enhances photocytotoxicity of Photosan-II in human colorectal cancer cells, Oncotarget, 8, 6419, 10.18632/oncotarget.14117 · DOI
- Wei, 2014, Autophagy promotes resistance to photodynamic therapy-induced apoptosis selectively in colorectal cancer stem-like cells, Autophagy, 10, 1179, 10.4161/auto.28679 · DOI
- Tu, 2016, Aloe-emodin-mediated photodynamic therapy induces autophagy and apoptosis in human osteosarcoma cell line MG-63 through the ROS/JNK signaling pathway, Oncol. Rep., 35, 3209, 10.3892/or.2016.4703 · DOI
- Zhu, 2018, Inhibition of breast cancer cell growth by methyl pyropheophenylchlorin photodynamic therapy is mediated though endoplasmic reticulum stress-induced autophagy in vitro and vivo, Cancer Med., 7, 1908, 10.1002/cam4.1418 · DOI
- Lepage, 2011, Diosgenin induces death receptor-5 through activation of p38 pathway and promotes TRAIL-induced apoptosis in colon cancer cells, Cancer Lett., 301, 193, 10.1016/j.canlet.2010.12.003 · DOI
- Lu, 2010, Biocompatibility, Biodistribution, and Drug-Delivery Efficiency of Mesoporous Silica Nanoparticles for Cancer Therapy in Animals, Small, 6, 1794, 10.1002/smll.201000538 · DOI
- Li, 2010, Inhibition of autophagy augments 5-fluorouracil chemotherapy in human colon cancer in vitro and in vivo model, Eur. J. Cancer., 46, 1900, 10.1016/j.ejca.2010.02.021 · DOI
- Liagre, 2017, Analysis of the in vitro and in vivo effects of photodynamic therapy on prostate cancer by using new photosensitizers, protoporphyrin IX-polyamine derivatives, Biochim. Biophys. Acta, 1861, 1676, 10.1016/j.bbagen.2017.02.003 · DOI
Cited by
Sorted by citations
Lang, T., Zhu, R., Zhu, X., Yan, W., Li, Y., Zhai, Y., Wu, T., Huang, X., Yin, Q., & Li, Y. (2023) · Nature Communications · doi:10.1038/s41467-023-40439-y · Cited by 133
Acetylxylan‐pheophorbide‐a nanoparticles designed for tumor‐targeted photodynamic therapy
Bouramtane, S., Bretin, L., Pinon, A., Leger, D., Liagre, B., Perez, D. D. S., Launay, Y., Brégier, F., Sol, V., & Chaleix, V. (2021) · Journal of Applied Polymer Science · doi:10.1002/app.50799 · Cited by 20
Self-citation
Metadata
- Authors
- Bretin, L., Pinon, A., Bouramtane, S., Ouk, C., Richard, L., Perrin, M.-L., Chaunavel, A., Carrion, C., Bregier, F., Sol, V., Chaleix, V., Leger, D. Y., & Liagre, B.
- Venue
- Cancers
- Publisher
- MDPI AG
- Published
- 2019-09-30
- Volume
- 11
- Issue
- 10
- Pages
- 1474
- ISSN
- 2072-6694
- PMC
- PMC6826978
- Cited by
- 62
- References
- 2
- Language
- en
About these checks
Registry, retraction, Cites and statistics results are computed, not judged, with one exception: a printed reference that no index lists is read once by a model before it counts as a citation error. Claims are extracted by a model and kept only when their quote appears verbatim in the text; each cited source is then checked, with a model’s help, for whether it says what the claim relies on. Those verdicts can be wrong — read the claim’s quote and the cited source before relying on one.
Statistics and arithmetic are recomputed, not judged.
Confidence bands are shown only for fields calibrated on our annotated test set. None is calibrated yet, so no band is shown.
What counts as a claim ›How we measure confidence ›How we check this ›
Are you an author, or do you see a problem with this page? Request a review
