

The DOI matches its Crossref record; 140 of the 140 references it cites were found in a registry or an index.
The Vav GEF Family: An Evolutionary and Functional Perspective
Abstract
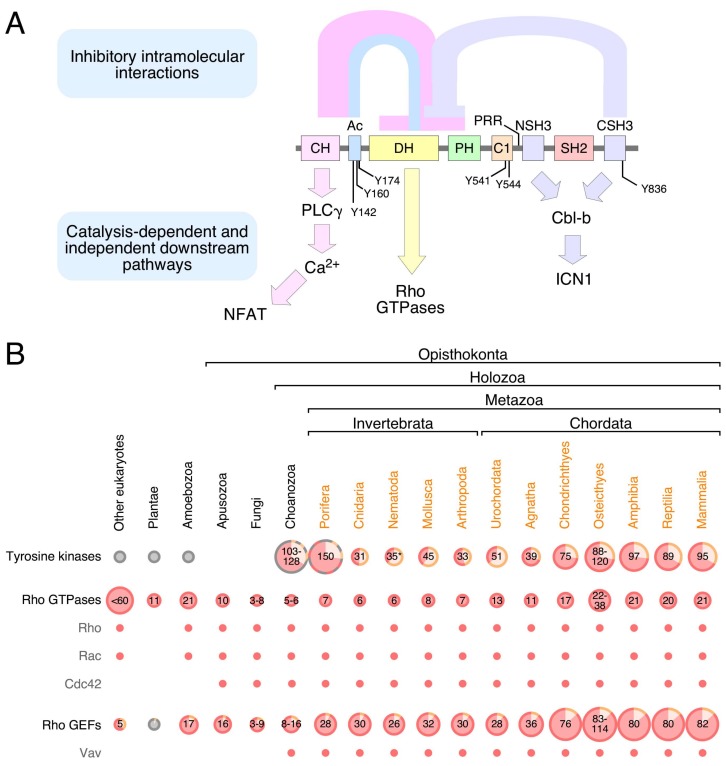
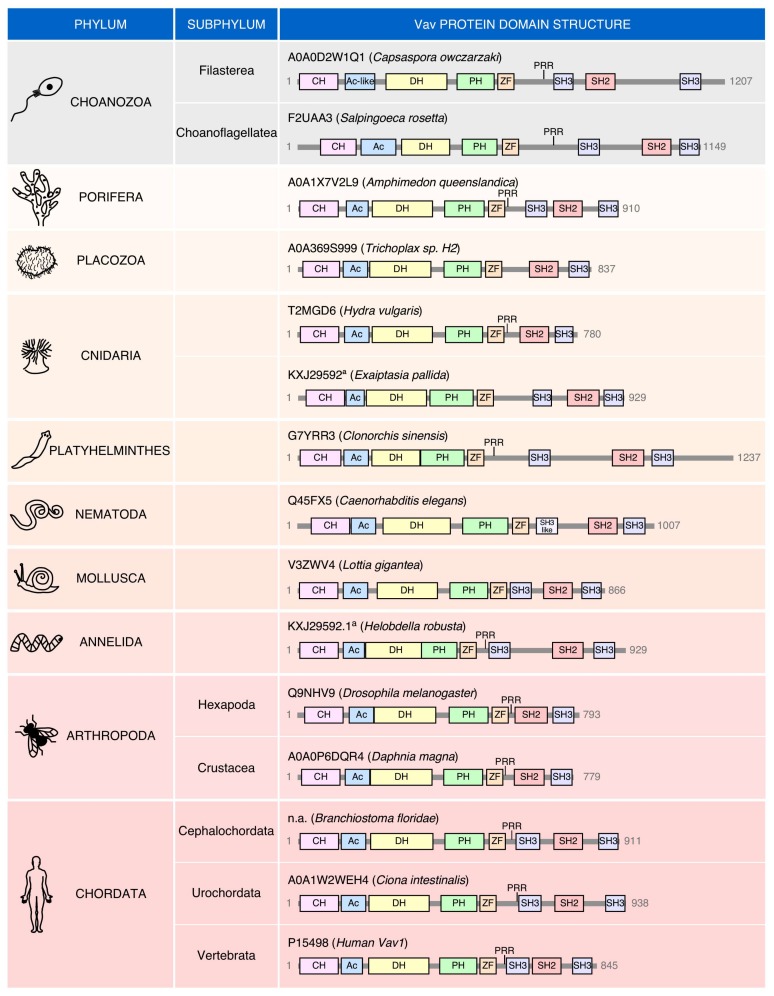
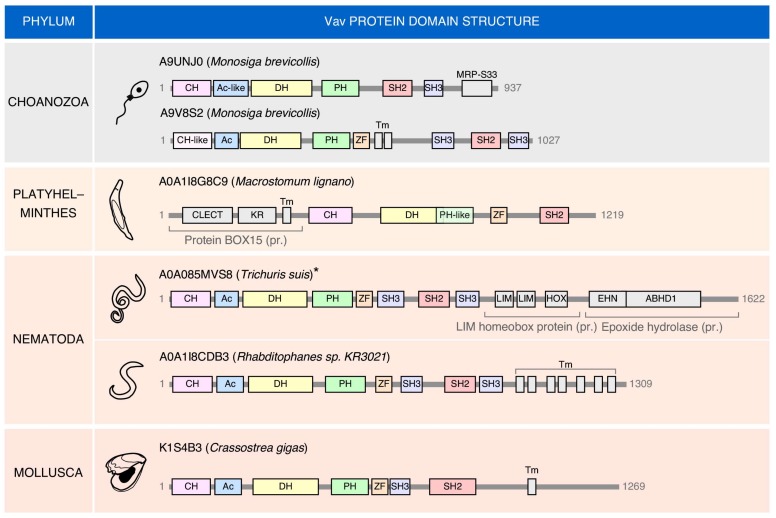
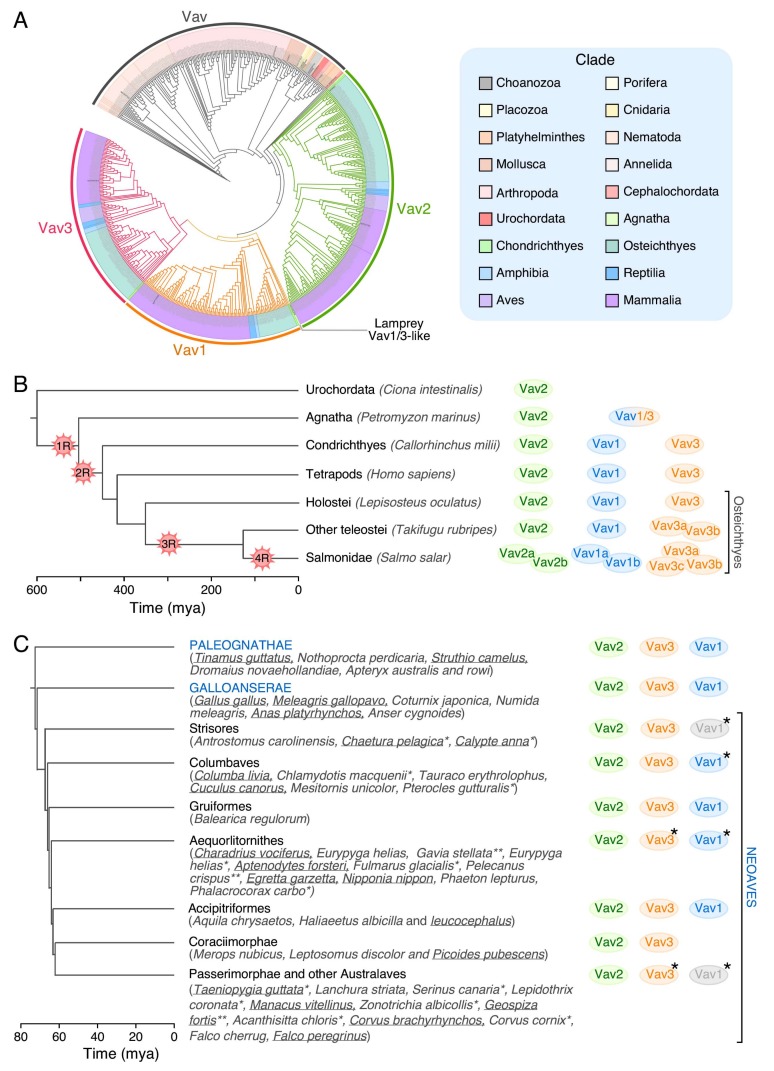
Vav proteins play roles as guanosine nucleotide exchange factors for Rho GTPases and signaling adaptors downstream of protein tyrosine kinases. The recent sequencing of the genomes of many species has revealed that this protein family originated in choanozoans, a group of unicellular organisms from which animal metazoans are believed to have originated from. Since then, the Vav family underwent expansions and reductions in its members during the evolutionary transitions that originated the agnates, chondrichthyes, some teleost fish, and some neoaves. Exotic members of the family harboring atypical structural domains can be also found in some invertebrate species. In this review, we will provide a phylogenetic perspective of the evolution of the Vav family. We will also pay attention to the structure, signaling properties, regulatory layers, and functions of Vav proteins in both invertebrate and vertebrate species.
Overview
The claims and statistics of this paper haven’t been checked yet.
Run the check — free, no account needed. It reads the open-access text and checks the sources it cites.
Integrity signals
Registry
Cites
Statistics
Figures
Verification
Claims the paper makes
The claims and statistics of this paper haven’t been checked yet.
Run the check — free, no account needed. It reads the open-access text and checks the sources it cites.
Claims other papers make about this one
Each is checked against this paper’s own text: does it say what the citing paper says it does?
In the citing paper
“Additionally, Lck regulates another RhoGEF known as Vav1, wherein this regulation may influence RhoA activation [53].”
From The Role of RhoH in TCR Signalling and Its Involvement in Diseases (2021) · cites this paper as [53]
Self-check
Percentages, sums and reported differences re-computed from the paper’s own numbers.
The self-check needs the paper’s full text.
Citations
Cites
Lysine acetylation targets protein complexes and co-regulates major cellular functions
Choudhary, C., Kumar, C., Gnad, F., Nielsen, M. L., Rehman, M., Walther, T. C., Olsen, J. V., & Mann, M. (2009) · Science · doi:10.1126/science.1175371 · Cited by 4,040
The sympathetic control of blood pressure
Guyenet, P. G. (2006) · Nature Reviews Neuroscience · doi:10.1038/nrn1902 · Cited by 1,863
GEF means go: turning on RHO GTPases with guanine nucleotide-exchange factors
Rossman, K. L., Der, C. J., & Sondek, J. (2005) · Nature Reviews Molecular Cell Biology · doi:10.1038/nrm1587 · Cited by 1,697
A comprehensive phylogeny of birds (Aves) using targeted next-generation DNA sequencing
Prum, R. O., Berv, J. S., Dornburg, A., Field, D. J., Townsend, J. P., Lemmon, E. M., & Lemmon, A. R. (2015) · Nature · doi:10.1038/nature15697 · Cited by 1,668
Distinct patterns of somatic genome alterations in lung adenocarcinomas and squamous cell carcinomas
Cancer Genome Atlas Research Network, Campbell, J. D., Alexandrov, A., Kim, J., Wala, J., Berger, A. H., Pedamallu, C. S., Shukla, S. A., Guo, G., Brooks, A. N., et al. (2016) · Nature Genetics · doi:10.1038/ng.3564 · Cited by 1,200
Comparative genomics reveals insights into avian genome evolution and adaptation
Zhang, G., Li, C., Li, Q., Li, B., Larkin, D. M., Lee, C., Storz, J. F., Antunes, A., Greenwold, M. J., Meredith, R. W., et al. (2014) · Science · doi:10.1126/science.1251385 · Cited by 1,055
Origin and evolution of the adaptive immune system: genetic events and selective pressures
Flajnik, M. F., & Kasahara, M. (2010) · Nature Reviews Genetics · doi:10.1038/nrg2703 · Cited by 931
A comprehensive phylogeny of birds (Aves) using targeted next-generation DNA sequencing
Prum, R. O., Berv, J. S., Dornburg, A., Field, D. J., Townsend, J. P., Lemmon, E. M., & Lemmon, A. R. (2016) · Nature · doi:10.1038/nature19417 · Cited by 928
Integrated molecular analysis of adult T cell leukemia/lymphoma
Kataoka, K., Nagata, Y., Kitanaka, A., Shiraishi, Y., Shimamura, T., Yasunaga, J.-I., Totoki, Y., Chiba, K., Sato-Otsubo, A., Nagae, G., et al. (2015) · Nature Genetics · doi:10.1038/ng.3415 · Cited by 794
Phosphotyrosine-dependent activation of Rac-1 GDP/GTP exchange by the vav proto-oncogene product
Crespo, P., Schuebel, K. E., Ostrom, A. A., Gutkind, J. S., & Bustelo, X. R. (1997) · Nature · doi:10.1038/385169a0 · Cited by 755
Self-citation
Research works printed but not linked: 1
- Ksionda, 2012, Mechanism and function of Vav1 localisation in TCR signalling, J. Cell Sci., 125, 5302
Cited by
The Role of RhoH in TCR Signalling and Its Involvement in Diseases
Ahmad Mokhtar, A. M., Hashim, I. F., Mohd Zaini Makhtar, M., Salikin, N. H., & Amin-Nordin, S. (2021) · Cells · doi:10.3390/cells10040950 · Cited by 25
Metadata
- Authors
- Rodríguez-Fdez, S., & Bustelo, X. R.
- Affiliations
- Centro de Investigación del Cáncer, Consejo Superior de Investigaciones Científicas (CSIC) and University of Salamanca, Campus Unamuno, E37007 Salamanca, Spain
- Venue
- Cells
- Publisher
- MDPI AG
- Published
- 2019-05-16
- Volume
- 8
- Issue
- 5
- Pages
- 465
- ISSN
- 2073-4409
- PMC
- PMC6562523
- Cited by
- 63
- References
- 140
- Language
- en
- Funders
- Consejería de Educación, Junta de Castilla y León (CSI049U16, CLC–2017–01)
- Ministerio de Ciencia e Innovación (SAF2015–64556–R, BES–2013–063573)
- Fundación Ramón Areces (N/A)
- Fundación Científica Asociación Española Contra el Cáncer (GC16173472GARC)
About these checks
Registry, retraction, Cites and statistics results are computed, not judged, with one exception: a printed reference that no index lists is read once by a model before it counts as a citation error. Claims are extracted by a model and kept only when their quote appears verbatim in the text; each cited source is then checked, with a model’s help, for whether it says what the claim relies on. Those verdicts can be wrong — read the claim’s quote and the cited source before relying on one.
Statistics and arithmetic are recomputed, not judged.
Confidence bands are shown only for fields calibrated on our annotated test set. None is calibrated yet, so no band is shown.
What counts as a claim ›How we measure confidence ›How we check this ›
Are you an author, or do you see a problem with this page? Request a review
How to cite
Cite CoChat for the checks on this page, and the paper for its own findings.
- This page
- CoChat. (2026). Citation check: The Vav GEF Family: An Evolutionary and Functional Perspective. https://app.cochat.ai/papers/10.3390/cells8050465
- The paper
- Rodríguez-Fdez, S., & Bustelo, X. R. (2019). The Vav GEF Family: An Evolutionary and Functional Perspective. Cells. https://doi.org/10.3390/cells8050465
Data sources
Bibliographic data: Semantic Scholar, OpenAlex, Crossref.
Contains information from the Semantic Scholar Academic Graph Datasets, made available under the ODC Attribution License (ODC-BY 1.0).
Semantic Scholar’s data is described in: Kinney, R., et al. (2023). The Semantic Scholar Open Data Platform. arXiv:2301.10140.
