

The DOI matches its Crossref record; 3 of the 3 references it cites were found in a registry or an index.
Mutation Patterns of Human SARS-CoV-2 and Bat RaTG13 Coronavirus Genomes Are Strongly Biased Towards C>U Transitions, Indicating Rapid Evolution in Their Hosts
Published version of a preprint
Abstract
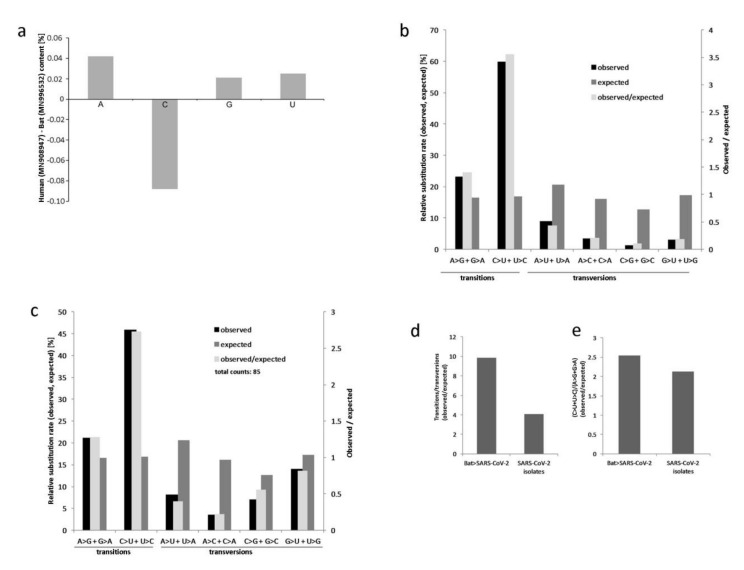
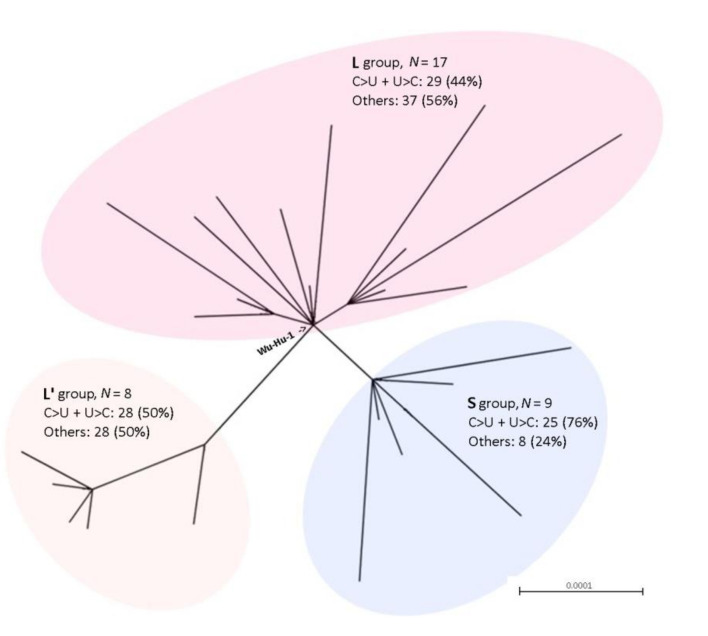
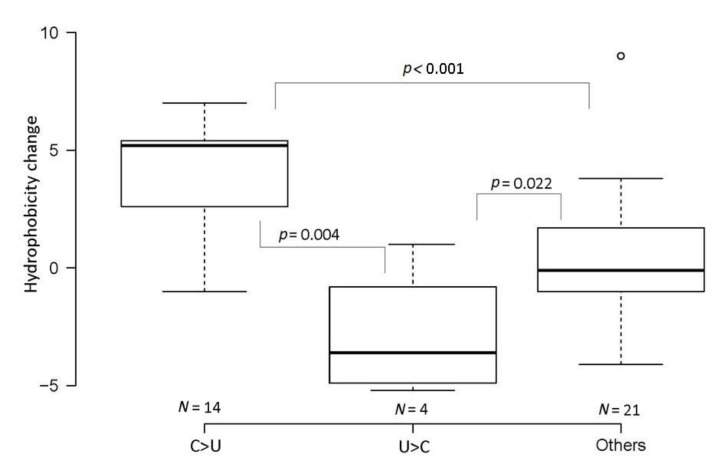
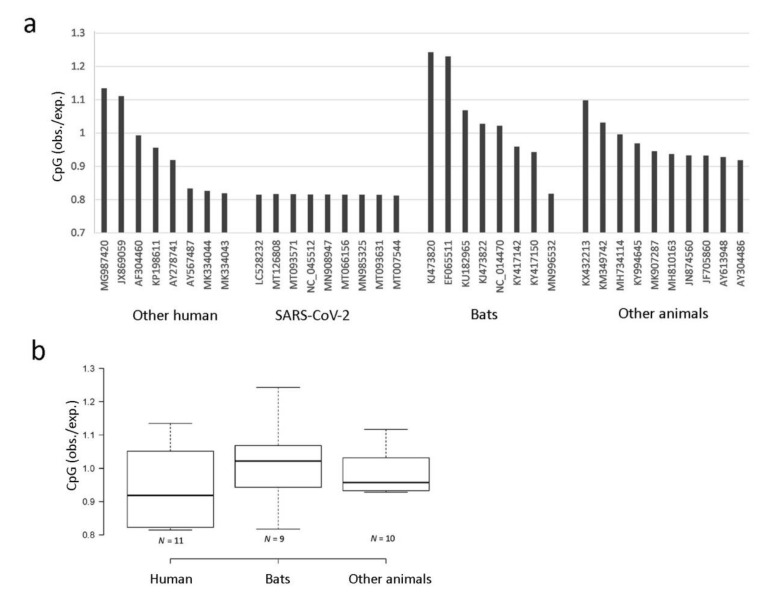
The pandemic caused by the spread of SARS-CoV-2 has led to considerable interest in its evolutionary origin and genome structure. Here, we analyzed mutation patterns in 34 human SARS-CoV-2 isolates and a closely related RaTG13 isolated from Rhinolophus affinis (a horseshoe bat). We also evaluated the CpG dinucleotide contents in SARS-CoV-2 and other human and animal coronavirus genomes. Out of 1136 single nucleotide variations (~4% divergence) between human SARS-CoV-2 and bat RaTG13, 682 (60%) can be attributed to C>U and U>C substitutions, far exceeding other types of substitutions. An accumulation of C>U mutations was also observed in SARS-CoV2 variants that arose within the human population. Globally, the C>U substitutions increased the frequency of codons for hydrophobic amino acids in SARS-CoV-2 peptides, while U>C substitutions decreased it. In contrast to most other coronaviruses, both SARS-CoV-2 and RaTG13 exhibited CpG depletion in their genomes. The data suggest that C-to-U conversion mediated by C deamination played a significant role in the evolution of the SARS-CoV-2 coronavirus. We hypothesize that the high frequency C>U transitions reflect virus adaptation processes in their hosts, and that SARS-CoV-2 could have been evolving for a relatively long period in humans following the transfer from animals before spreading worldwide.
Overview
The claims and statistics of this paper haven’t been checked yet.
Run the check — free, no account needed. It reads the open-access text and checks the sources it cites.
Integrity signals
Registry
Cites
Statistics
Figures
Verification
Claims the paper makes
The claims and statistics of this paper haven’t been checked yet.
Run the check — free, no account needed. It reads the open-access text and checks the sources it cites.
Claims other papers make about this one
Each is checked against this paper’s own text: does it say what the citing paper says it does?
The source backs part of the claim, not all of it — or backs it for a different population, condition or comparison.
In the citing paper
“Interestingly, the database analysis of SARS-CoV-2 genomic variations showed an overwhelmingly high C-to-U mutation rate, account for about 40% of all single nucleotide variations, which was interpreted as a result of RNA editing by host APOBECs rather than random mutations11,12,14,27.”
From The roles of APOBEC-mediated RNA editing in SARS-CoV-2 mutations, replication and fitness (2022) · cites this paper as [14]
Experimental — accuracy not yet measuredThe source backs part of the claim, not all of it — or backs it for a different population, condition or comparison.
In the citing paper
“Recent analysis of SARS-CoV-2 and rubella vaccine virus genome data derived from patients show predominant mutational patterns with specific signatures rather than random genetic variations, suggesting that the host-factor induced mutations play an important role in shaping the viral genomic RNA mutational outcome and evolution11–14.”
From The roles of APOBEC-mediated RNA editing in SARS-CoV-2 mutations, replication and fitness (2022) · cites this paper as [14]
Experimental — accuracy not yet measuredThe source backs part of the claim, not all of it — or backs it for a different population, condition or comparison.
In the citing paper
“Prior bioinformatic analysis of the SARS-CoV-2 sequences suggested that some of the C-to-U mutations may be caused by APOBEC proteins instead of the random mutations caused by viral RNA polymerase during replication or ROS11,12,14,27,51,52.”
From The roles of APOBEC-mediated RNA editing in SARS-CoV-2 mutations, replication and fitness (2022) · cites this paper as [14]
Experimental — accuracy not yet measured
Self-check
Percentages, sums and reported differences re-computed from the paper’s own numbers.
The self-check needs the paper’s full text.
Citations
Cites
Wan, Y., Shang, J., Graham, R., Baric, R. S., & Li, F. (2020) · Journal of Virology · doi:10.1128/jvi.00127-20 · Cited by 4,341
The Galaxy platform for accessible, reproducible and collaborative biomedical analyses: 2018 update
Afgan, E., Baker, D., Batut, B., van den Beek, M., Bouvier, D., Čech, M., Chilton, J., Clements, D., Coraor, N., Grüning, B. A., et al. (2018) · Nucleic Acids Research · doi:10.1093/nar/gky379 · Cited by 3,662
Moderate mutation rate in the SARS coronavirus genome and its implications
Zhao, Z., Li, H., Wu, X., Zhong, Y., Zhang, K., Zhang, Y.-P., Boerwinkle, E., & Fu, Y.-X. (2004) · BMC Evolutionary Biology · doi:10.1186/1471-2148-4-21 · Cited by 286
Research works printed but not linked: 36
- Zhou, 2020, A pneumonia outbreak associated with a new coronavirus of probable bat origin, Nature, 579, 270, 10.1038/s41586-020-2012-7 · DOI · Paper page
- Kandeel, M., Ibrahim, A., Fayez, M., and Al-Nazawi, M. (2020). From SARS and MERS CoVs to SARS-CoV-2: Moving toward more biased codon usage in viral structural and nonstructural genes. J. Med. Virol. · DOI
- Wrapp, 2020, Cryo-EM structure of the 2019-nCoV spike in the prefusion conformation, Science, 367, 1260, 10.1126/science.abb2507 · DOI · Paper page
- Zhang, T., Wu, Q., and Zhang, Z. (2020). Probable pangolin origin of SARS-CoV-2 associated with the COVID-19 outbreak. Curr. Biol. · DOI
- Andersen, 2020, The proximal origin of SARS-CoV-2, Nat. Med., 26, 450, 10.1038/s41591-020-0820-9 · DOI · Paper page
- Frederico, 1993, Cytosine deamination in mismatched base pairs, Biochemistry, 32, 6523, 10.1021/bi00077a005 · DOI
- Poole, 2001, Confounded cytosine! Tinkering and the evolution of DNA, Nat. Rev. Mol. Cell Biol., 2, 147, 10.1038/35052091 · DOI
- Jabbari, 2004, Cytosine methylation and CpG, TpG (CpA) and TpA frequencies, Gene, 333, 143, 10.1016/j.gene.2004.02.043 · DOI
- Stevens, 2013, Estimating absolute methylation levels at single-CpG resolution from methylation enrichment and restriction enzyme sequencing methods, Genome Res., 23, 1541, 10.1101/gr.152231.112 · DOI
- Bird, 2002, DNA methylation patterns and epigenetic memory, Genes Dev., 16, 6, 10.1101/gad.947102 · DOI · Paper page
- Kypr, 1989, Nucleotide composition bias and CpG dinucleotide content in the genomes of HIV and HTLV 1/2, Biochim. Biophys. Acta, 1009, 280, 10.1016/0167-4781(89)90114-0 · DOI
- Cheng, X., Virk, N., Chen, W., Ji, S., Sun, Y., and Wu, X. (2013). CpG usage in RNA viruses: Data and hypotheses. PLoS ONE, 8. · DOI
- Upadhyay, 2013, CpG dinucleotide frequencies reveal the role of host methylation capabilities in parvovirus evolution, J. Virol., 87, 13816, 10.1128/JVI.02515-13 · DOI
- Anwar, 2016, Source of CpG depletion in the HIV-1 genome, Mol. Biol. Evol., 33, 3205, 10.1093/molbev/msw205 · DOI
- Gojobori, 1982, Patterns of nucleotide substitution in pseudogenes and functional genes, J. Mol. Evol., 18, 360, 10.1007/BF01733904 · DOI
- Ochman, 2003, Neutral mutations and neutral substitutions in bacterial genomes, Mol. Biol. Evol., 20, 2091, 10.1093/molbev/msg229 · DOI
- Wang, 2016, Astonishing 35S rDNA diversity in the gymnosperm species Cycas revoluta Thunb, Chromosoma, 125, 683, 10.1007/s00412-015-0556-3 · DOI
- Bulmer, 1986, Neighboring base effects on substitution rates in pseudogenes, Mol. Biol. Evol., 3, 322
- Keller, I., Bensasson, D., and Nichols, R.A. (2007). Transition-transversion bias is not universal: A counter example from grasshopper pseudogenes. PLoS Genet., 3. · DOI
- Duchene, S., Ho, S.Y., and Holmes, E.C. (2015). Declining transition/transversion ratios through time reveal limitations to the accuracy of nucleotide substitution models. BMC Evol. Biol., 15. · DOI
- Rozas, 1997, DnaSP version 2.0: A novel software package for extensive molecular population genetics analysis, Comput. Appl. Biosci., 13, 307
- Pettersen, 2004, UCSF Chimera–A visualization system for exploratory research and analysis, J. Comput. Chem., 25, 1605, 10.1002/jcc.20084 · DOI
- Kyte, 1982, A simple method for displaying the hydropathic character of a protein, J. Mol. Biol., 157, 105, 10.1016/0022-2836(82)90515-0 · DOI
- Gouy, 2010, SeaView version 4: A multiplatform graphical user interface for sequence alignment and phylogenetic tree building, Mol. Biol. Evol., 27, 221, 10.1093/molbev/msp259 · DOI
- Tang, 2020, On the origin and continuing evolution of SARS-CoV-2, Natl. Sci. Rev., 7, 1012, 10.1093/nsr/nwaa036 · DOI
- Anisimova, 2006, Approximate likelihood-ratio test for branches: A fast, accurate, and powerful alternative, Syst. Biol., 55, 539, 10.1080/10635150600755453 · DOI · Paper page
- Nei, 1986, Simple methods for estimating the numbers of synonymous and nonsynonymous nucleotide substitutions, Mol. Biol. Evol., 3, 418
- Duffy, S. (2018). Why are RNA virus mutation rates so damn high?. PLoS Biol., 16. · DOI
- Pachetti, 2020, Emerging SARS-CoV-2 mutation hot spots include a novel RNA-dependent-RNA polymerase variant, J. Transl. Med., 18, 179, 10.1186/s12967-020-02344-6 · DOI
- Minskaia, 2006, Discovery of an RNA virus 3′->5′ exoribonuclease that is critically involved in coronavirus RNA synthesis, Proc. Natl. Acad. Sci. USA, 103, 5108, 10.1073/pnas.0508200103 · DOI
- Sethna, 1991, Minus-strand copies of replicating coronavirus mRNAs contain antileaders, J. Virol., 65, 320, 10.1128/jvi.65.1.320-325.1991 · DOI
- Roberts, 2013, An APOBEC cytidine deaminase mutagenesis pattern is widespread in human cancers, Nat. Genet., 45, 970, 10.1038/ng.2702 · DOI
- Opi, 2006, Monomeric APOBEC3G is catalytically active and has antiviral activity, J. Virol., 80, 4673, 10.1128/JVI.80.10.4673-4682.2006 · DOI
- Upadhyay, M., and Vivekanandan, P. (2015). Depletion of CpG Dinucleotides in papillomaviruses and polyomaviruses: A role for divergent evolutionary pressures. PLoS ONE, 10. · DOI
- Klinman, 1997, Contribution of CpG motifs to the immunogenicity of DNA vaccines, J. Immunol., 158, 3635, 10.4049/jimmunol.158.8.3635 · DOI · Paper page
- Zhang, 2000, Rates of conservative and radical nonsynonymous nucleotide substitutions in mammalian nuclear genes, J. Mol. Evol., 50, 56, 10.1007/s002399910007 · DOI · Paper page
Cited by
Sorted by citations
The roles of APOBEC-mediated RNA editing in SARS-CoV-2 mutations, replication and fitness
Kim, K., Calabrese, P., Wang, S., Qin, C., Rao, Y., Feng, P., & Chen, X. S. (2022) · Scientific Reports · doi:10.1038/s41598-022-19067-x · Cited by 115
SARS-CoV-2's origin should be investigated worldwide for pandemic prevention
Wu, Z., Jin, Q., Wu, G., Lu, J., Li, M., Guo, D., Lan, K., Feng, L., Qian, Z., Ren, L., et al. (2021) · The Lancet · doi:10.1016/s0140-6736(21)02020-1 · Cited by 23
Metadata
- Authors
- Matyášek, R., & Kovařík, A.
- Affiliations
- Laboratory of Molecular Epigenetics, Institute of Biophysics, Academy of Sciences of the Czech Republic, Královopolská 135, 61265 Brno, Czech Republic
- Venue
- Genes
- Publisher
- MDPI AG
- Published
- 2020-07-07
- Volume
- 11
- Issue
- 7
- Pages
- 761
- ISSN
- 2073-4425
- PMC
- PMC7397057
- Cited by
- 78
- References
- 3
- Language
- en
- Funders
- Grantová Agentura České Republiky (20-14133J, 20-28029S)
- Akademie Věd České Republiky (68081707)
About these checks
Registry, retraction, Cites and statistics results are computed, not judged, with one exception: a printed reference that no index lists is read once by a model before it counts as a citation error. Claims are extracted by a model and kept only when their quote appears verbatim in the text; each cited source is then checked, with a model’s help, for whether it says what the claim relies on. Those verdicts can be wrong — read the claim’s quote and the cited source before relying on one.
Statistics and arithmetic are recomputed, not judged.
Confidence bands are shown only for fields calibrated on our annotated test set. None is calibrated yet, so no band is shown.
What counts as a claim ›How we measure confidence ›How we check this ›
Are you an author, or do you see a problem with this page? Request a review
