

Structural Changes in Hippocampal Subfields in Patients with Continuous Remission of Drug-Naive Major Depressive Disorder
Open accessThe DOI matches its Crossref record; 39 of the 39 references it cites were found in a registry or an index.
Abstract
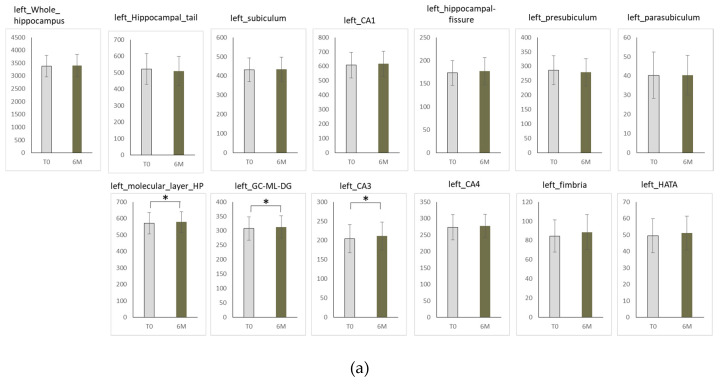
Objective: Hippocampal volume is reduced in patients with major depressive disorder (MDD) compared with healthy controls. The hippocampus is a limbic structure that has a critical role in MDD. The aim of the present study was to investigate the changes in the volume of the hippocampus and its subfields in MDD patients who responded to antidepressants and subsequently were in continuous remission. Subjects and Methods: Eighteen patients who met the following criteria were enrolled in the present study: the DSM-IV-TR criteria for MDD, drug-naïve at least 8 weeks or more, scores on the 17-items of Hamilton Rating Scale for Depression (HAMD) of 14 points or more, and antidepressant treatment response within 8 weeks and continuous remission for at least 6 months. All participants underwent T1-weighted structural MRI and were treated with antidepressants for more than 8 weeks. We compared the volumes of the hippocampus, including its subfields, in responders at baseline to the volumes at 6 months. The volumes of the whole hippocampus and the hippocampal subfields were measured using FreeSurfer v6.0. Results: The volumes of the left cornu Ammonis (CA) 3 (p = 0.016) and the granule cell layer of the dentate gyrus (GC-DG) region (p = 0.021) were significantly increased after 6 months of treatment compared with those at baseline. Conclusions: Increases in volume was observed in MDD patients who were in remission for at least 6 months.
Overview
The claims and statistics of this paper haven’t been checked yet.
Free: it reads the open-access text and checks the first 5 claims that cite a source we can check. Create a free account to check every claim.
Integrity signals
Registry
Cites
Statistics
Figures
Verification
Claims the paper makes
The claims and statistics of this paper haven’t been checked yet.
Free: it reads the open-access text and checks the first 5 claims that cite a source we can check. Create a free account to check every claim.
Claims other papers make about this one
Each is checked against this paper’s own text: does it say what the citing paper says it does?
The cited source says what the claim attributes to it.
In the citing paper
“Treatment with conventional antidepressants diminishes the atrophy in human depression [84], including recent longitudinal studies in previously drug naïve patients [85,86], suggesting that the anatomical changes may underlie functional improvements.”
From Plasticity of synapses and reward circuit function in the genesis and treatment of depression (2023) · cites this paper as [85]
Self-check
Percentages, sums and reported differences re-computed from the paper’s own numbers.
The self-check needs the paper’s full text.
Citations
Cites
Measuring the thickness of the human cerebral cortex from magnetic resonance images
Fischl, B., & Dale, A. M. (2000) · Proceedings of the National Academy of Sciences · doi:10.1073/pnas.200033797 · Cited by 5,818
A nonparametric method for automatic correction of intensity nonuniformity in MRI data
Sled, J. G., Zijdenbos, A. P., & Evans, A. C. (1998) · IEEE Transactions on Medical Imaging · doi:10.1109/42.668698 · Cited by 4,731 · cited 1×
“All the images were corrected for image distortion resulting from gradient nonlinearity using the Grad Warp software program and from intensity inhomogeneity using the “N3” function [36].”
MethodGlucocorticoids and Hippocampal Atrophy in Neuropsychiatric Disorders
Sapolsky, R. M. (2000) · Archives of General Psychiatry · doi:10.1001/archpsyc.57.10.925 · Cited by 2,016
Stress, Depression, and Neuroplasticity: A Convergence of Mechanisms
Pittenger, C., & Duman, R. S. (2008) · Neuropsychopharmacology · doi:10.1038/sj.npp.1301574 · Cited by 1,795 · cited 1×
“Potentially underlying these structural anomalies, chronic stress has been shown to have detrimental effects on hippocampal neurogenesis and neuroplasticity in these individuals [15,16], consequently leading to cognitive and emotional symptoms of depression and anxiety.”
BackgroundIglesias, J. E., Augustinack, J. C., Nguyen, K., Player, C. M., Player, A., Wright, M., Roy, N., Frosch, M. P., McKee, A. C., Wald, L. L., et al. (2015) · NeuroImage · doi:10.1016/j.neuroimage.2015.04.042 · Cited by 1,277
Adult hippocampal neurogenesis in depression
Sahay, A., & Hen, R. (2007) · Nature Neuroscience · doi:10.1038/nn1969 · Cited by 1,206 · cited 1×
“Nevertheless, there is no adequate evidence to establish that hippocampal neurogenesis is necessary for the antidepressant’s efficacy [27,28].”
Backgroundfor the ENIGMA-Major Depressive Disorder Working Group, Schmaal, L., Veltman, D. J., van Erp, T. G. M., Sämann, P. G., Frodl, T., Jahanshad, N., Loehrer, E., Tiemeier, H., Hofman, A., et al. (2016) · Molecular Psychiatry · doi:10.1038/mp.2015.69 · Cited by 1,172
Lower Hippocampal Volume in Patients Suffering From Depression: A Meta-Analysis
Campbell, S., Marriott, M., Nahmias, C., & MacQueen, G. M. (2004) · American Journal of Psychiatry · doi:10.1176/appi.ajp.161.4.598 · Cited by 1,156
A pathophysiological framework of hippocampal dysfunction in ageing and disease
Small, S. A., Schobel, S. A., Buxton, R. B., Witter, M. P., & Barnes, C. A. (2011) · Nature Reviews Neuroscience · doi:10.1038/nrn3085 · Cited by 926
Hippocampal synaptic plasticity, spatial memory and anxiety
Bannerman, D. M., Sprengel, R., Sanderson, D. J., McHugh, S. B., Rawlins, J. N. P., Monyer, H., & Seeburg, P. H. (2014) · Nature Reviews Neuroscience · doi:10.1038/nrn3677 · Cited by 688 · cited 1×
“Potentially underlying these structural anomalies, chronic stress has been shown to have detrimental effects on hippocampal neurogenesis and neuroplasticity in these individuals [15,16], consequently leading to cognitive and emotional symptoms of depression and anxiety.”
BackgroundStress and anxiety: Structural plasticity and epigenetic regulation as a consequence of stress
McEwen, B. S., Eiland, L., Hunter, R. G., & Miller, M. M. (2012) · Neuropharmacology · doi:10.1016/j.neuropharm.2011.07.014 · Cited by 596 · cited 1×
“Brain imaging studies of the hippocampus in patients and stress-induced animal models with either depression or anxiety disorders indicate a remarkable reduction in hippocampal region volume and the number of dendritic spines [13,14].”
BackgroundArnone, D., McIntosh, A. M., Ebmeier, K. P., Munafò, M. R., & Anderson, I. M. (2012) · European Neuropsychopharmacology · doi:10.1016/j.euroneuro.2011.05.003 · Cited by 495
Antidepressant-Induced Neurogenesis in the Hippocampus of Adult Nonhuman Primates
Perera, T. D., Coplan, J. D., Lisanby, S. H., Lipira, C. M., Arif, M., Carpio, C., Spitzer, G., Santarelli, L., Scharf, B., Hen, R., et al. (2007) · The Journal of Neuroscience · doi:10.1523/jneurosci.0237-07.2007 · Cited by 460
Automated segmentation of hippocampal subfields from ultra‐high resolution in vivo MRI
Van Leemput, K., Bakkour, A., Benner, T., Wiggins, G., Wald, L. L., Augustinack, J., Dickerson, B. C., Golland, P., & Fischl, B. (2009) · Hippocampus · doi:10.1002/hipo.20615 · Cited by 405 · cited 3×
“For all scans, “recon-all” and Longitudinal Processing [32,33] were performed first.”
BackgroundMethodRegional brain volume in depression and anxiety disorders
van Tol, M.-J., van der Wee, N. J. A., van den Heuvel, O. A., Nielen, M. M. A., Demenescu, L. R., Aleman, A., Renken, R., van Buchem, M. A., Zitman, F. G., & Veltman, D. J. (2010) · Archives of General Psychiatry · doi:10.1001/archgenpsychiatry.2010.121 · Cited by 370 · cited 1×
“Brain imaging studies of the hippocampus in patients and stress-induced animal models with either depression or anxiety disorders indicate a remarkable reduction in hippocampal region volume and the number of dendritic spines [13,14].”
BackgroundHippocampal volume in primary unipolar major depression: a magnetic resonance imaging study
Vakili, K., Pillay, S. S., Lafer, B., Fava, M., Renshaw, P. F., Bonello-Cintron, C. M., & Yurgelun-Todd, D. A. (2000) · Biological Psychiatry · doi:10.1016/s0006-3223(99)00296-6 · Cited by 363
Novel genetic loci associated with hippocampal volume
Hibar, D. P., Adams, H. H. H., Jahanshad, N., Chauhan, G., Stein, J. L., Hofer, E., Renteria, M. E., Bis, J. C., Arias-Vasquez, A., Ikram, M. K., et al. (2017) · Nature Communications · doi:10.1038/ncomms13624 · Cited by 299
Hallahan, B., Newell, J., Soares, J. C., Brambilla, P., Strakowski, S. M., Fleck, D. E., Kieseppä, T., Altshuler, L. L., Fornito, A., Malhi, G. S., et al. (2011) · Biological Psychiatry · doi:10.1016/j.biopsych.2010.08.029 · Cited by 289
Hallahan, B. P., Newell, J., Soares, J. C., Brambilla, P., Strakowski, S. M., Fleck, D. E., Kieseppä, T., Altshul, L. L., Fornito, A., Malhi, G. S., et al. (2011) · FOCUS The Journal of Lifelong Learning in Psychiatry · doi:10.1176/foc.9.4.foc477 · Cited by 245
Hallahan, B., Newell, J., Soares, J. C., Brambilla, P., Strakowski, S. M., Fleck, D. E., Kieseppä, T., Altshul, L. L., Fornito, A., Malhi, G. S., et al. (2011) · FOCUS: The Journal of Lifelong Learning in Psychiatry · doi:10.1176/appi.focus.9.4.477 · Cited by 243
Morey, R. A., Haswell, C. C., Hooper, S. R., & De Bellis, M. D. (2016) · Neuropsychopharmacology · doi:10.1038/npp.2015.205 · Cited by 237 · cited 2×
“Hippocampal subfields CA (1–3) are reduced by experimental stress in animal studies [17], which is consistent with human behavioral findings of the preferential impact of earlylife maltreatment stress, particularly in high-risk patients [18].”
BackgroundSchmaal, L., Veltman, D. J., van Erp, T. G. M., Sämann, P. G., Frodl, T., Jahanshad, N., Loehrer, E. A., Tiemeier, H. W., Albert Hofman, D., Niessen, W. J., et al. (2015) · QUT ePrints (Queensland University of Technology) · Cited by 207
Activating newborn neurons suppresses depression and anxiety-like behaviors
Tunc-Ozcan, E., Peng, C.-Y., Zhu, Y., Dunlop, S. R., Contractor, A., & Kessler, J. A. (2019) · Nature Communications · doi:10.1038/s41467-019-11641-8 · Cited by 201
Huang, Y., Coupland, N. J., Lebel, R. M., Carter, R., Seres, P., Wilman, A. H., & Malykhin, N. V. (2013) · Biological Psychiatry · doi:10.1016/j.biopsych.2013.01.005 · Cited by 179
Tendolkar, I., van Beek, M., van Oostrom, I., Mulder, M., Janzing, J., Voshaar, R. O., & van Eijndhoven, P. (2013) · Psychiatry Research: Neuroimaging · doi:10.1016/j.pscychresns.2013.09.004 · Cited by 161
Ma, Z., Zang, T., Birnbaum, S. G., Wang, Z., Johnson, J. E., Zhang, C.-L., & Parada, L. F. (2017) · Nature Communications · doi:10.1038/s41467-017-01709-8 · Cited by 141
Brain Structural Effects of Antidepressant Treatment in Major Depression
Dusi, N., Barlati, S., Vita, A., & Brambilla, P. (2015) · Current Neuropharmacology · doi:10.2174/1570159x1304150831121909 · Cited by 131
Cao, B., Luo, Q., Fu, Y., Du, L., Qiu, T., Yang, X., Chen, X., Chen, Q., Soares, J. C., Cho, R. Y., et al. (2018) · Scientific Reports · doi:10.1038/s41598-018-23685-9 · Cited by 114
Atrophy of the hippocampus in posttraumatic stress disorder: How and when?
Sapolsky, R. M. (2001) · Hippocampus · doi:10.1002/hipo.1026 · Cited by 93
Maller, J. J., Broadhouse, K., Rush, A. J., Gordon, E., Koslow, S., & Grieve, S. M. (2018) · Molecular Psychiatry · doi:10.1038/mp.2017.224 · Cited by 87
The prefrontal–limbic network in depression: A core pathology of synapse regression
Bennett, M. R. (2011) · Progress in Neurobiology · doi:10.1016/j.pneurobio.2011.01.001 · Cited by 86
Brown, S. S. G., Rutland, J. W., Verma, G., Feldman, R. E., Alper, J., Schneider, M., Delman, B. N., Murrough, J. M., & Balchandani, P. (2019) · Scientific Reports · doi:10.1038/s41598-019-46687-7 · Cited by 75
Hippocampal subfield volumes in major depressive disorder and bipolar disorder
Han, K.-M., Kim, A., Kang, W., Kang, Y., Kang, J., Won, E., Tae, W.-S., & Ham, B.-J. (2019) · European Psychiatry · doi:10.1016/j.eurpsy.2019.01.016 · Cited by 68
Fluoxetine Regulates Neurogenesis In Vitro Through Modulation of GSK-3 / -Catenin Signaling
Hui, J., Zhang, J., Kim, H., Tong, C., Ying, Q., Li, Z., Mao, X., Shi, G., Yan, J., Zhang, Z., et al. (2015) · International Journal of Neuropsychopharmacology · doi:10.1093/ijnp/pyu099 · Cited by 64
Hippocampal subfield analysis in medication-naïve female patients with major depressive disorder
Han, K.-M., Won, E., Sim, Y., & Tae, W.-S. (2016) · Journal of Affective Disorders · doi:10.1016/j.jad.2016.01.019 · Cited by 63 · cited 1×
“In addition, we calculated hippocampal subfield volumes using longitudinal segmentation [24,34].”
MethodBoldrini, M., Butt, T. H., Santiago, A. N., Tamir, H., Dwork, A. J., Rosoklija, G. B., Arango, V., Hen, R., & Mann, J. J. (2014) · The International Journal of Neuropsychopharmacology · doi:10.1017/s1461145714000844 · Cited by 59
Critical periods regulating the circuit integration of adult-born hippocampal neurons
Jahn, H. M., & Bergami, M. (2017) · Cell and Tissue Research · doi:10.1007/s00441-017-2677-x · Cited by 20
Otsuka, Y., Kakeda, S., Sugimoto, K., Katsuki, A., Nguyen, L., Igata, R., Watanabe, K., Ueda, I., Kishi, T., Iwata, N., et al. (2019) · Neuropsychiatric Disease and Treatment · doi:10.2147/ndt.s199598 · Cited by 14
Self-citationShort-term escitalopram treatment and hippocampal volume
Godlewska, B. R., Hasselmann, H., Igoumenou, A., Norbury, R., & Cowen, P. J. (2014) · Psychopharmacology · doi:10.1007/s00213-014-3771-3 · Cited by 11
Cited by
Haukvik, U. K., Gurholt, T. P., Nerland, S., Elvsåshagen, T., Akudjedu, T. N., Alda, M., Alnæs, D., Alonso-Lana, S., Bauer, J., Baune, B. T., et al. (2020) · Human Brain Mapping · doi:10.1002/hbm.25249 · Cited by 88
Xu, M., Zhang, X., Li, Y., Chen, S., Zhang, Y., Zhou, Z., Lin, S., Dong, T., Hou, G., & Qiu, Y. (2022) · Translational Psychiatry · doi:10.1038/s41398-022-02147-x · Cited by 50
Plasticity of synapses and reward circuit function in the genesis and treatment of depression
Thompson, S. M. (2023) · Neuropsychopharmacology · doi:10.1038/s41386-022-01422-1 · Cited by 40
“Treatment with conventional antidepressants diminishes the atrophy in human depression [84], including recent longitudinal studies in previously drug naïve patients [85, 86], suggesting that the anatomical changes may underlie functional improvements.”
BackgroundInvestigating the potential mechanisms of depression induced-by COVID-19 infection in patients
Mohammadkhanizadeh, A., & Nikbakht, F. (2021) · Journal of Clinical Neuroscience · doi:10.1016/j.jocn.2021.07.023 · Cited by 41
Bracht, T., Walther, S., Breit, S., Mertse, N., Federspiel, A., Meyer, A., Soravia, L. M., Wiest, R., & Denier, N. (2023) · Translational Psychiatry · doi:10.1038/s41398-022-02304-2 · Cited by 25
Metadata
- Authors
- Katsuki, A., Watanabe, K., Nguyen, L., Otsuka, Y., Igata, R., Ikenouchi, A., Kakeda, S., Korogi, Y., & Yoshimura, R.
- Affiliations
- University of Occupational and Environmental Health Japan (JP)
- Hirosaki University (JP)
- Corresponding author
- Yoshimura, Reiji
- ORCID
- Venue
- International Journal of Molecular Sciences
- Publisher
- MDPI AG
- Published
- 2020-04-25
- Volume
- 21
- Issue
- 9
- Pages
- 3032
- ISSN
- 1422-0067 (ISSN-L)
- PMC
- PMC7246866
- OpenAlex
- W3018690753
- Cited by
- 15
- References
- 38
- Citations by year
- 2025: 2 · 2024: 2 · 2023: 4 · 2022: 3 · 2021: 3 · 2020: 1
- FWCI
- 1.65
- Type
- journal article
- Language
- en
- Open access
- gold
- dx.doi.org
- Licence
- Locations
- International Journal of Molecular Sciences (publishedVersion, cc-by)
- PubMed Central (publishedVersion, cc-by)
- PubMed (publishedVersion)
- DOAJ (DOAJ: Directory of Open Access Journals) (submittedVersion, cc-by-sa)
- Funders
- Japan Society for the Promotion of Science (18K07654)
- Topics
- Health Sciences › Medicine › Pharmacology (medical) › Treatment of Major Depression
- Life Sciences › Neuroscience › Behavioral Neuroscience › Stress Responses and Cortisol
- Life Sciences › Neuroscience › Cognitive Neuroscience › Neural and Behavioral Psychology Studies
- Keywords
- major depressive disorder, hippocampal subfields, hippocampal volume, antidepressant response
- MeSH terms
- Adult, Antidepressive Agents, Depressive Disorder, Major, Major Depressive Disorder, Female, Follow-Up Studies, Humans, Magnetic Resonance Imaging, Male, Middle Aged, Organ Size, Psychiatric Status Rating Scales, Remission Induction, Dentate Gyrus, CA3 Region, Hippocampal, Neuroimaging
About these checks
Registry, retraction, Cites and statistics results are computed, not judged, with one exception: a printed reference that no index lists is read once by a model before it counts as a citation error. Claims are extracted by a model and kept only when their quote appears verbatim in the text; each cited source is then checked, with a model’s help, for whether it says what the claim relies on. Those verdicts can be wrong — read the claim’s quote and the cited source before relying on one.
Statistics and arithmetic are recomputed, not judged.
Confidence bands are shown only for fields calibrated on our annotated test set. None is calibrated yet, so no band is shown.
What counts as a claim ›How we measure confidence ›How we check this ›
Are you an author, or do you see a problem with this page? Request a review
Data sources
Bibliographic data: Semantic Scholar, OpenAlex, Crossref.
Contains information from the Semantic Scholar Academic Graph Datasets, made available under the ODC Attribution License (ODC-BY 1.0).
Semantic Scholar’s data is described in: Kinney, R., et al. (2023). The Semantic Scholar Open Data Platform. arXiv:2301.10140.
