

The DOI matches its Crossref record; 58 of the 59 references it cites were found in a registry or an index.
Gene Expression Analysis of Yeast Strains with a Nonsense Mutation in the eRF3-Coding Gene Highlights Possible Mechanisms of Adaptation
Open accessAbstract
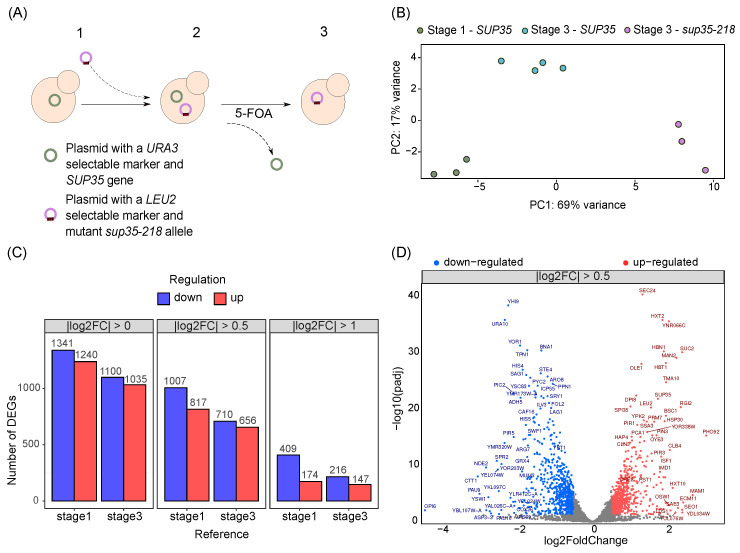
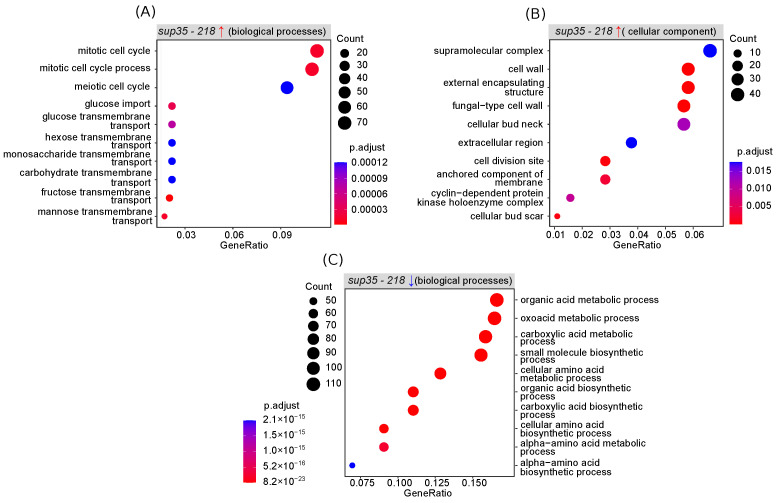
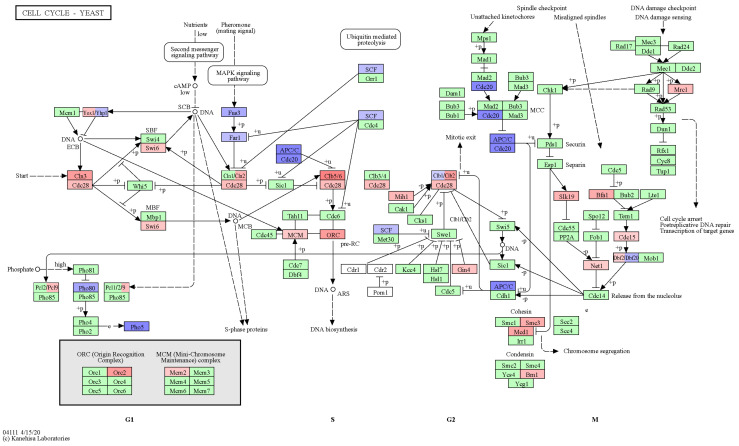
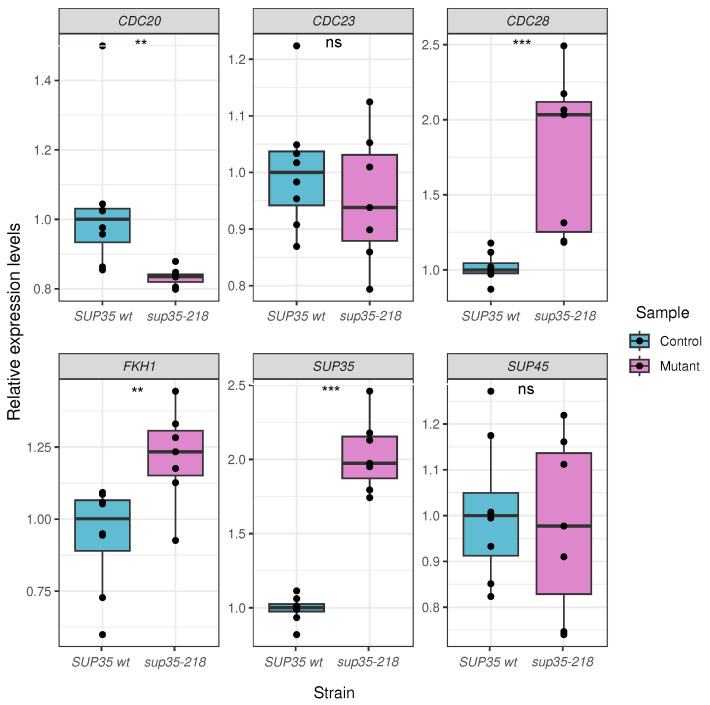
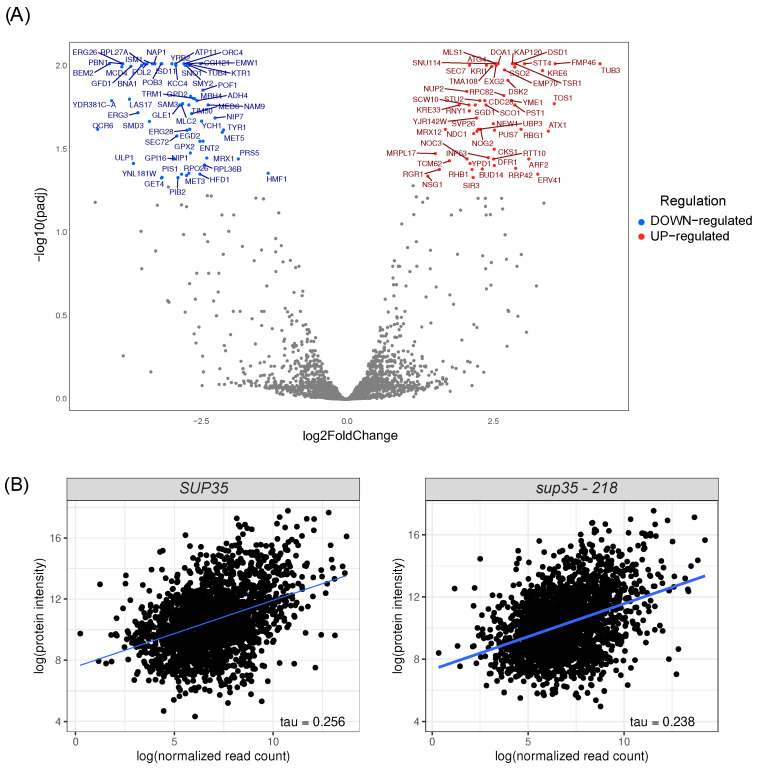
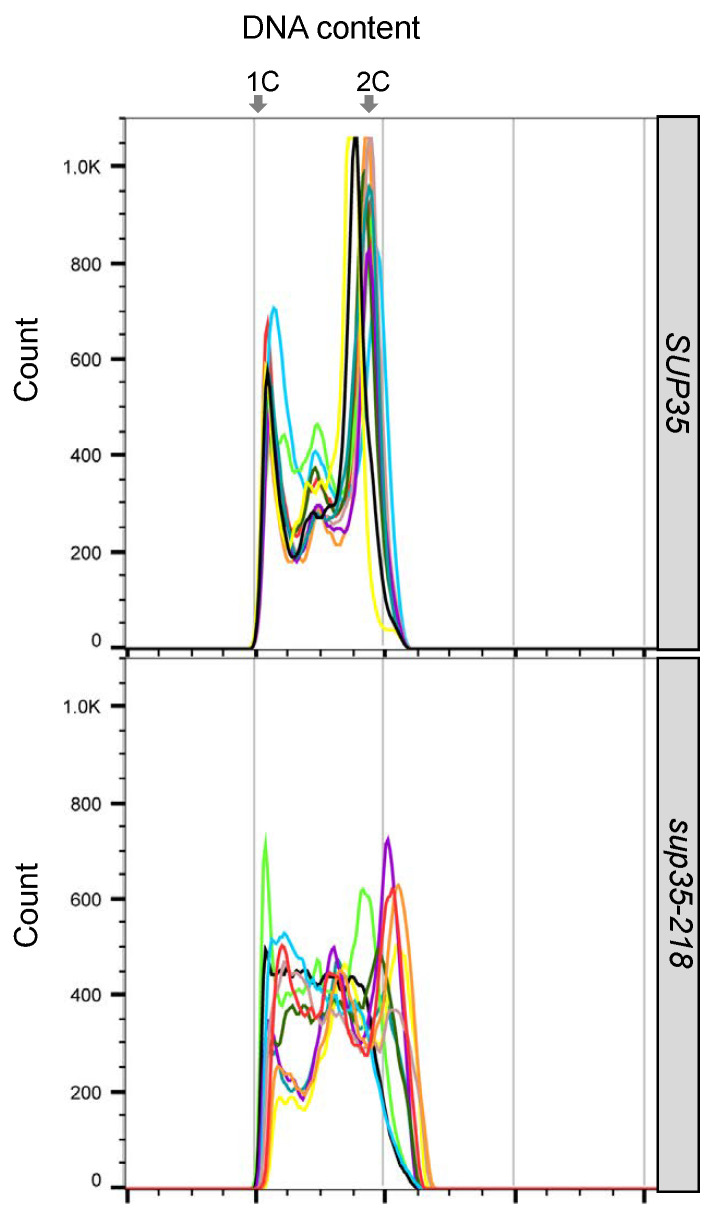
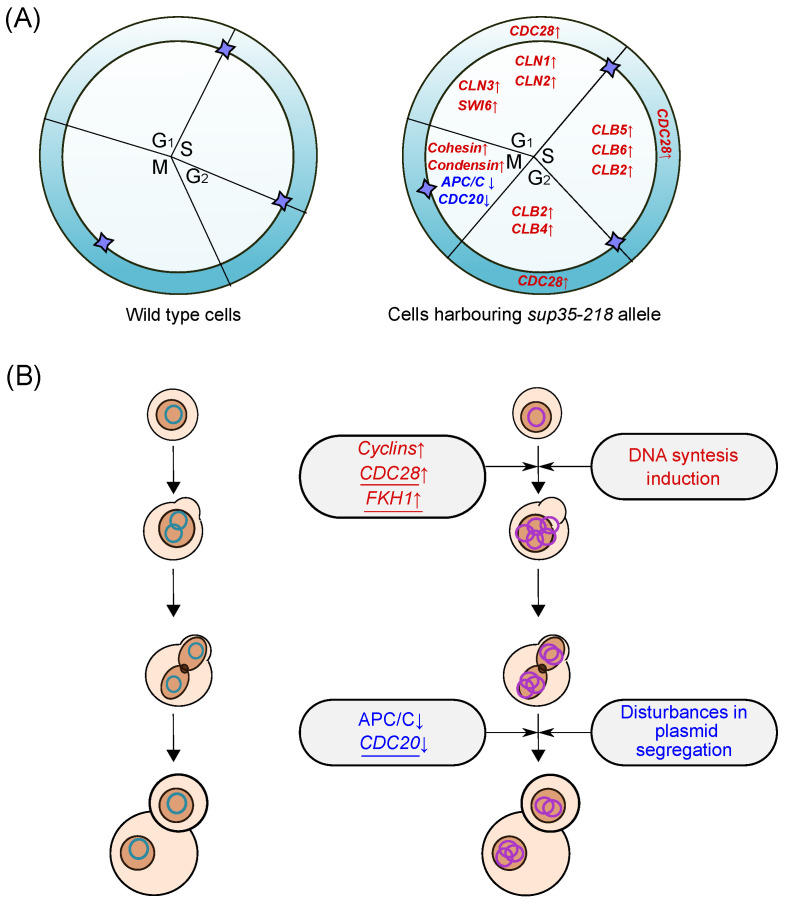
In yeast Saccharomyces cerevisiae, there are two translation termination factors, eRF1 (Sup45) and eRF3 (Sup35), which are essential for viability. Previous studies have revealed that presence of nonsense mutations in these genes leads to amplification of mutant alleles (sup35-n and sup45-n), which appears to be necessary for the viability of such cells. However, the mechanism of this phenomenon remained unclear. In this study, we used RNA-Seq and proteome analysis to reveal the complete set of gene expression changes that occur during cellular adaptation to the introduction of the sup35-218 nonsense allele. Our analysis demonstrated significant changes in the transcription of genes that control the cell cycle: decreases in the expression of genes of the anaphase promoting complex APC/C (APC9, CDC23) and their activator CDC20, and increases in the expression of the transcription factor FKH1, the main cell cycle kinase CDC28, and cyclins that induce DNA biosynthesis. We propose a model according to which yeast adaptation to nonsense mutations in the translation termination factor genes occurs as a result of a delayed cell cycle progression beyond the G2-M stage, which leads to an extension of the S and G2 phases and an increase in the number of copies of the mutant sup35-n allele.
Overview
The claims and statistics of this paper haven’t been checked yet.
Run the check — free, no account needed. It reads the open-access text and checks the sources it cites.
Integrity signals
Registry
Cites
Statistics
Figures
Verification
Claims the paper makes
The claims and statistics of this paper haven’t been checked yet.
Run the check — free, no account needed. It reads the open-access text and checks the sources it cites.
Claims other papers make about this one
Each is checked against this paper’s own text: does it say what the citing paper says it does?
The source backs part of the claim, not all of it — or backs it for a different population, condition or comparison.
In the citing paper
“Beyond its primary function in translation termination, loss of gSPt1 disrupted key cellular pathways including cell cycle regulation, cytoskeletal organization and mtOR signaling (valouev et al. 2002;chauvin et al. 2007;Maksiutenko et al. 2024).”
From From serendipity to strategy: molecular glue degraders in cancer therapeutics (2025) · cites this paper as Maksiutenko et al. 2024
Experimental — accuracy not yet measured
Self-check
Percentages, sums and reported differences re-computed from the paper’s own numbers.
The self-check needs the paper’s full text.
Citations
Cites
Analysis of Relative Gene Expression Data Using Real-Time Quantitative PCR and the 2−ΔΔCT Method
Livak, K. J., & Schmittgen, T. D. (2001) · Methods · doi:10.1006/meth.2001.1262 · Cited by 180,860
Moderated estimation of fold change and dispersion for RNA-seq data with DESeq2
Love, M. I., Huber, W., & Anders, S. (2014) · Genome Biology · doi:10.1186/s13059-014-0550-8 · Cited by 95,106
KEGG: Kyoto Encyclopedia of Genes and Genomes
Kanehisa, M. (2000) · Nucleic Acids Research · doi:10.1093/nar/28.1.27 · Cited by 37,077
KEGG: Kyoto Encyclopedia of Genes and Genomes
Ogata, H., Goto, S., Sato, K., Fujibuchi, W., Bono, H., & Kanehisa, M. (1999) · Nucleic Acids Research · doi:10.1093/nar/27.1.29 · Cited by 31,232
featureCounts: an efficient general purpose program for assigning sequence reads to genomic features
Liao, Y., Smyth, G. K., & Shi, W. (2014) · Bioinformatics · doi:10.1093/bioinformatics/btt656 · Cited by 27,219
Graph-based genome alignment and genotyping with HISAT2 and HISAT-genotype
Kim, D., Paggi, J. M., Park, C., Bennett, C., & Salzberg, S. L. (2019) · Nature Biotechnology · doi:10.1038/s41587-019-0201-4 · Cited by 15,022
Sikorski, R. S., & Hieter, P. (1989) · Genetics · doi:10.1093/genetics/122.1.19 · Cited by 8,590
Rappsilber, J., Mann, M., & Ishihama, Y. (2007) · Nature Protocols · doi:10.1038/nprot.2007.261 · Cited by 4,641
Mutation of the mouse klotho gene leads to a syndrome resembling ageing
Kuro-o, M., Matsumura, Y., Aizawa, H., Kawaguchi, H., Suga, T., Utsugi, T., Ohyama, Y., Kurabayashi, M., Kaname, T., Kume, E., et al. (1997) · Nature · doi:10.1038/36285 · Cited by 3,837
Correlation between Protein and mRNA Abundance in Yeast
Gygi, S. P., Rochon, Y., Franza, B. R., & Aebersold, R. (1999) · Molecular and Cellular Biology · doi:10.1128/mcb.19.3.1720 · Cited by 3,819
Research works printed but not linked: 1
- Kaiser, C., Michaelis, S., and Mitchell, A. (1994). Methods in Yeast Genetics: A Cold Spring Harbor Laboratory Course Manual, Cold Spring Harbor Laboratory Press.
Cited by
Sorted by citations
From serendipity to strategy: molecular glue degraders in cancer therapeutics
Darling, S., Bajrami, I., & West, S. C. (2025) · Critical Reviews in Biochemistry and Molecular Biology · doi:10.1080/10409238.2025.2564068 · Cited by 9
“Notably, one of the most affected protein groups were the cDKs which are key regulators of the g2/M cell cycle transition (Maksiutenko et al. 2024). gSPt1 was identified from a large-scale phenotypic screen designed to uncover cRBN-targeting compounds with broad anti-proliferative activity across…”
Identification and Validation of Telomere-Related Gene Signature in Intervertebral Disc Degeneration
Xie, S., Xiao, H., Zhang, F., Lan, Y., & Luo, M. (2024) · Cureus · doi:10.7759/cureus.71735
Metadata
- Authors
- Maksiutenko, E. M., Barbitoff, Y. A., Danilov, L. G., Matveenko, A. G., Zemlyanko, O. M., Efremova, E. P., Moskalenko, S. E., & Zhouravleva, G. A.
- Affiliations
- Russian Academy of Sciences (RU)
- St Petersburg University (RU)
- Corresponding author
- Zhouravleva, Galina A.
- ORCID
- Venue
- International Journal of Molecular Sciences
- Publisher
- MDPI AG
- Published
- 2024-06-07
- Volume
- 25
- Issue
- 12
- Pages
- 6308
- ISSN
- 1422-0067 (ISSN-L)
- PMC
- PMC11203930
- OpenAlex
- W4399434292
- Cited by
- 2
- References
- 59
- Citations by year
- 2025: 1 · 2024: 1
- FWCI
- 0.27
- Type
- journal article
- Language
- en
- Open access
- gold
- doi.org
- Licence
- Locations
- International Journal of Molecular Sciences (publishedVersion, cc-by)
- PubMed Central (publishedVersion, cc-by)
- PubMed (publishedVersion)
- Funders
- Russian Science Foundation (23-14-00063)
- Topics
- Life Sciences › Biochemistry, Genetics and Molecular Biology › Molecular Biology › Fungal and yeast genetics research
- Life Sciences › Biochemistry, Genetics and Molecular Biology › Molecular Biology › RNA and protein synthesis mechanisms
- Life Sciences › Biochemistry, Genetics and Molecular Biology › Molecular Biology › RNA Research and Splicing
- Keywords
- eRF3, SUP45, translation termination factor, cellular adaptation, gene expression changes, cell cycle regulation, anaphase-promoting complex, CDC20, Fkh1, Cdc28, cyclins, DNA synthesis, Saccharomyces cerevisiae
- MeSH terms
- Adaptation, Physiological, Cell Cycle, Peptide Termination Factors, Saccharomyces cerevisiae, Gene Expression Regulation, Fungal, Codon, Nonsense, Saccharomyces cerevisiae Proteins
About these checks
Registry, retraction, Cites and statistics results are computed, not judged, with one exception: a printed reference that no index lists is read once by a model before it counts as a citation error. Claims are extracted by a model and kept only when their quote appears verbatim in the text; each cited source is then checked, with a model’s help, for whether it says what the claim relies on. Those verdicts can be wrong — read the claim’s quote and the cited source before relying on one.
Statistics and arithmetic are recomputed, not judged.
Confidence bands are shown only for fields calibrated on our annotated test set. None is calibrated yet, so no band is shown.
What counts as a claim ›How we measure confidence ›How we check this ›
Are you an author, or do you see a problem with this page? Request a review
