

The DOI matches its Crossref record; 71 of the 71 references it cites were found in a registry or an index.
SenolyticSynergy: An Attention-Based Network for Discovering Novel Senolytic Combinations via Human Aging Genomics
Open accessPublished version of a preprint
Abstract
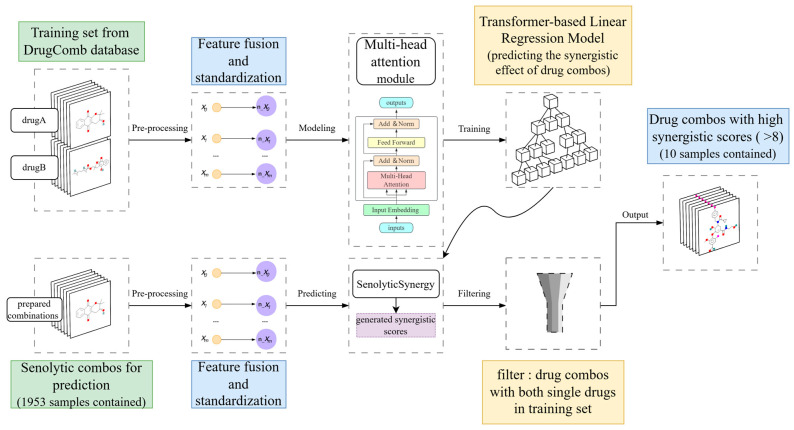
Senolytics, a category of drugs targeting aging processes, have garnered significant attention since their emergence in 2015. Unlike traditional drug development approaches that rely on randomized screening, research on aging-related pharmaceuticals has employed mechanism-based strategies, resulting in the discovery of the pioneering combination therapy of dasatinib (D) and quercetin (Q). Although preliminary studies with senolytic drug combinations have shown promising outcomes, the predictive capabilities of the research in this field remain limited by the extensive experimental data requirements. In this study, we employed differential gene expression analysis and machine learning techniques to investigate the combinatorial effects of senolytic drugs. We identified 1624 core aging-related genes and used this dataset to retrain a multimodal attention mechanism model, creating a specialized framework, SenolyticSynergy, for predicting effective senolytic drug combinations. We then utilized 63 established senolytic compounds as starting points for combination testing, developing a comprehensive dataset of 1953 potential drug combinations for aging interventions. Following rigorous filtration, we identified 190 high-confidence drug combinations and predicted their synergistic scores. Among these combinations, ten demonstrated exceptionally high synergistic scores, exceeding 8. The combination of temsirolimus and nitazoxanide ranked first and may be the most promising candidate. The analysis of the literature data and computational studies of molecular structures using 3D modeling validated the accuracy of these predictions. This framework paves the way for large-scale research into anti-aging drug combinations, advancing research capabilities in this field.
Overview
The claims and statistics of this paper haven’t been checked yet.
Run the check — free, no account needed. It reads the open-access text and checks the sources it cites.
Integrity signals
Registry
Cites
Statistics
Figures
Verification
Claims the paper makes
The claims and statistics of this paper haven’t been checked yet.
Run the check — free, no account needed. It reads the open-access text and checks the sources it cites.
Self-check
Percentages, sums and reported differences re-computed from the paper’s own numbers.
The self-check needs the paper’s full text.
Citations
Cites
Vaswani, A., Shazeer, N., Parmar, N., Uszkoreit, J., Jones, L., Gomez, A. N., Kaiser, L., & Polosukhin, I. (2017) · arXiv · doi:10.48550/arxiv.1706.03762 · Cited by 120,404
Moderated estimation of fold change and dispersion for RNA-seq data with DESeq2
Love, M. I., Huber, W., & Anders, S. (2014) · Genome Biology · doi:10.1186/s13059-014-0550-8 · Cited by 95,106
Subramanian, A., Tamayo, P., Mootha, V. K., Mukherjee, S., Ebert, B. L., Gillette, M. A., Paulovich, A., Pomeroy, S. L., Golub, T. R., Lander, E. S., et al. (2005) · Proceedings of the National Academy of Sciences · doi:10.1073/pnas.0506580102 · Cited by 53,625
KEGG: Kyoto Encyclopedia of Genes and Genomes
Kanehisa, M. (2000) · Nucleic Acids Research · doi:10.1093/nar/28.1.27 · Cited by 37,077
Hallmarks of Cancer: New Dimensions
Hanahan, D. (2022) · Cancer Discovery · doi:10.1158/2159-8290.cd-21-1059 · Cited by 9,887
AutoDock Vina 1.2.0: New Docking Methods, Expanded Force Field, and Python Bindings
Eberhardt, J., Santos‐Martins, D., Tillack, A. F., & Forli, S. (2021) · Journal of Chemical Information and Modeling · doi:10.1021/acs.jcim.1c00203 · Cited by 8,292
Hallmarks of aging: An expanding universe
López-Otín, C., Blasco, M. A., Partridge, L., Serrano, M., & Kroemer, G. (2023) · Cell · doi:10.1016/j.cell.2022.11.001 · Cited by 6,549
Wnt/β-Catenin Signaling in Development and Disease
Clevers, H. (2006) · Cell · doi:10.1016/j.cell.2006.10.018 · Cited by 5,568
SRplot: A free online platform for data visualization and graphing
Tang, D., Chen, M., Huang, X., Zhang, G., Zeng, L., Zhang, G., Wu, S., & Wang, Y. (2023) · PLoS ONE · doi:10.1371/journal.pone.0294236 · Cited by 2,592
The Achilles' heel of senescent cells: from transcriptome to senolytic drugs
Zhu, Y., Tchkonia, T., Pirtskhalava, T., Gower, A. C., Ding, H., Giorgadze, N., Palmer, A. K., Ikeno, Y., Hubbard, G. B., Lenburg, M., et al. (2015) · Aging Cell · doi:10.1111/acel.12344 · Cited by 2,584
DrugBank 6.0: the DrugBank Knowledgebase for 2024
Knox, C., Wilson, M., Klinger, C. M., Franklin, M., Oler, E., Wilson, A., Pon, A., Cox, J., Chin, N. E., Strawbridge, S., et al. (2023) · Nucleic Acids Research · doi:10.1093/nar/gkad976 · Cited by 1,894
Li, N., Ragheb, K., Lawler, G., Sturgis, J., Rajwa, B. P., Melendez, J. A., & Robinson, J. P. (2003) · Journal of Biological Chemistry · doi:10.1074/jbc.m210432200 · Cited by 1,465
Hickson, L. J., Langhi Prata, L. G. P., Bobart, S. A., Evans, T. K., Giorgadze, N., Hashmi, S. K., Herrmann, S. M., Jensen, M. D., Jia, Q., Jordan, K. L., et al. (2019) · EBioMedicine · doi:10.1016/j.ebiom.2019.08.069 · Cited by 1,383 · cited 2×
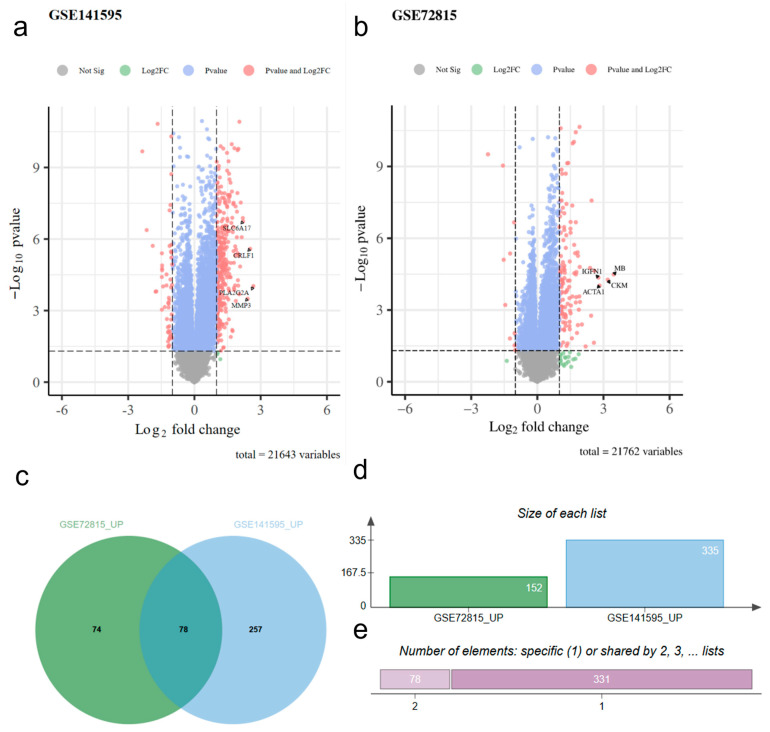
“In this study, we utilized various R (Version 4.2.2) packages and methods [11] to analyze and process GSE141595 [12] and GSE72815 [13], accurately identifying significantly differentially expressed genes (DEGs) between the two groups.”
InfluentialZhu, Y., Tchkonia, T., Fuhrmann‐Stroissnigg, H., Dai, H. M., Ling, Y. Y., Stout, M. B., Pirtskhalava, T., Giorgadze, N., Johnson, K. O., Giles, C. B., et al. (2016) · Aging Cell · doi:10.1111/acel.12445 · Cited by 1,148
Directed elimination of senescent cells by inhibition of BCL-W and BCL-XL
Yosef, R., Pilpel, N., Tokarsky-Amiel, R., Biran, A., Ovadya, Y., Cohen, S., Vadai, E., Dassa, L., Shahar, E., Condiotti, R., et al. (2016) · Nature Communications · doi:10.1038/ncomms11190 · Cited by 1,032
Fisetin is a senotherapeutic that extends health and lifespan
Yousefzadeh, M. J., Zhu, Y., McGowan, S. J., Angelini, L., Fuhrmann-Stroissnigg, H., Xu, M., Ling, Y. Y., Melos, K. I., Pirtskhalava, T., Inman, C. L., et al. (2018) · EBioMedicine · doi:10.1016/j.ebiom.2018.09.015 · Cited by 1,032
Identification of HSP90 inhibitors as a novel class of senolytics
Fuhrmann-Stroissnigg, H., Ling, Y. Y., Zhao, J., McGowan, S. J., Zhu, Y., Brooks, R. W., Grassi, D., Gregg, S. Q., Stripay, J. L., Dorronsoro, A., et al. (2017) · Nature Communications · doi:10.1038/s41467-017-00314-z · Cited by 701
TREM2 in Neurodegenerative Diseases
Jay, T. R., von Saucken, V. E., & Landreth, G. E. (2017) · Molecular Neurodegeneration · doi:10.1186/s13024-017-0197-5 · Cited by 427
Identification and characterization of Cardiac Glycosides as senolytic compounds
Triana-Martínez, F., Picallos-Rabina, P., Da Silva-Álvarez, S., Pietrocola, F., Llanos, S., Rodilla, V., Soprano, E., Pedrosa, P., Ferreirós, A., Barradas, M., et al. (2019) · Nature Communications · doi:10.1038/s41467-019-12888-x · Cited by 384
Cardiac glycosides are broad-spectrum senolytics
Guerrero, A., Herranz, N., Sun, B., Wagner, V., Gallage, S., Guiho, R., Wolter, K., Pombo, J., Irvine, E. E., Innes, A. J., et al. (2019) · Nature Metabolism · doi:10.1038/s42255-019-0122-z · Cited by 359
Aging Atlas: a multi-omics database for aging biology
Liu, G., Bào, Y., Qu, J. T., Zhang, W., Zhāng, T., Kang, W., Yang, F., Ji, Q., Jiang, X., Ma, Y., et al. (2020) · Nucleic Acids Research · doi:10.1093/nar/gkaa894 · Cited by 333
Fisetin and Quercetin: Promising Flavonoids with Chemopreventive Potential
Kashyap, D., Garg, V. K., Tuli, H. S., Yerer, M. B., Sak, K., Sharma, A. K., Kumar, M., Aggarwal, V., & Sandhu, S. S. (2019) · Biomolecules · doi:10.3390/biom9050174 · Cited by 285
Subcellular Organization of the cAMP Signaling Pathway
Zaccolo, M., Zerio, A., & Lobo, M. J. (2020) · Pharmacological Reviews · doi:10.1124/pharmrev.120.000086 · Cited by 281
Discovery of piperlongumine as a potential novel lead for the development of senolytic agents
Wang, Y., Chang, J., Liu, X., Zhang, X., Zhang, S., Zhang, X., Zhou, D., & Zheng, G. (2016) · Aging · doi:10.18632/aging.101100 · Cited by 274
Lin, S., Wang, Y., Zhang, L., Chu, Y., Liu, Y., Fang, Y., Jiang, M., Wang, Q., Zhao, B., Xiong, Y., et al. (2021) · Briefings in Bioinformatics · doi:10.1093/bib/bbab421 · Cited by 209
Malyutina, A., Majumder, M. M., Wang, W., Pessia, A., Heckman, C. A., & Tang, J. P. (2019) · PLoS Computational Biology · doi:10.1371/journal.pcbi.1006752 · Cited by 207
PI3K/Akt/mTOR Signaling Pathway as a Target for Colorectal Cancer Treatment
Leiphrakpam, P., & Are, C. (2024) · International Journal of Molecular Sciences · doi:10.3390/ijms25063178 · Cited by 193
A Novel Indication for Panobinostat as a Senolytic Drug in NSCLC and HNSCC
Samaraweera, L., Adomako, A., Rodriguez-Gabin, A., & McDaid, H. M. (2017) · Scientific Reports · doi:10.1038/s41598-017-01964-1 · Cited by 183
Galactose‐modified duocarmycin prodrugs as senolytics
Guerrero, A., Guiho, R., Herranz, N., Uren, A., Withers, D. J., Martínez‐Barbera, J. P., Tietze, L. F., & Gil, J. (2020) · Aging Cell · doi:10.1111/acel.13133 · Cited by 172
The curcumin analog EF24 is a novel senolytic agent
Li, W., He, Y., Zhang, R., Zheng, G., & Zhou, D. (2019) · Aging · doi:10.18632/aging.101787 · Cited by 164
Human Ageing Genomic Resources: updates on key databases in ageing research
de Magalhães, J. P., Abidi, Z., dos Santos, G. A., Avelar, R. A., Barardo, D., Chatsirisupachai, K., Clark, P. A., De‐Souza, E. A., Johnson, E. J., Lopes, I., et al. (2023) · Nucleic Acids Research · doi:10.1093/nar/gkad927 · Cited by 143
Discovery of senolytics using machine learning
Smer-Barreto, V., Quintanilla, A., Elliott, R. J. R., Dawson, J. C., Sun, J., Campa, V. M., Lorente-Macías, Á., Unciti-Broceta, A., Carragher, N. O., Acosta, J. C., et al. (2023) · Nature Communications · doi:10.1038/s41467-023-39120-1 · Cited by 139
Ozsvari, B., Nuttall, J. R., Sotgia, F., & Lisanti, M. P. (2018) · Aging · doi:10.18632/aging.101633 · Cited by 138
Integrative view of serpins in health and disease: the contribution of serpinA3
Sánchez‐Navarro, A., González‐Soria, I., Bohn, R. I. C., & Bobadilla, N. A. (2020) · American Journal of Physiology-Cell Physiology · doi:10.1152/ajpcell.00366.2020 · Cited by 134
Regulation and therapy, the role of JAK2/STAT3 signaling pathway in OA: a systematic review
Chen, B., Ning, K., Sun, M., & Zhang, X. (2023) · Cell Communication and Signaling · doi:10.1186/s12964-023-01094-4 · Cited by 117
Higher sensitivity of Adamts12-deficient mice to tumor growth and angiogenesis
Hour, M. E., Moncada-Pazos, Á., Blacher, S., Masset, A., Cal, S., Berndt, S., Detilleux, J., Host, L., Obaya, Á. J., Maillard, C., et al. (2010) · Oncogene · doi:10.1038/onc.2010.49 · Cited by 116
LongevityMap: a database of human genetic variants associated with longevity
Budovsky, A., Craig, T., Wang, J., Tăcutu, R., Csordás, A., Lourenço, J., Fraifeld, V. E., & de Magalhães, J. P. (2013) · Trends in Genetics · doi:10.1016/j.tig.2013.08.003 · Cited by 111
Nrf2–ARE Signaling Acts as Master Pathway for the Cellular Antioxidant Activity of Fisetin
Zhang, H., Zheng, W., Feng, X., Yang, F., Qin, H., Wu, S., Hou, D., & Chen, J. (2019) · Molecules · doi:10.3390/molecules24040708 · Cited by 82
Discovering small-molecule senolytics with deep neural networks
Wong, F., Omori, S., Donghia, N. M., Zheng, E. J., & Collins, J. J. (2023) · Nature Aging · doi:10.1038/s43587-023-00415-z · Cited by 82
Effects of Age and Estrogen on Skeletal Gene Expression in Humans as Assessed by RNA Sequencing
Farr, J. N., Roforth, M. M., Fujita, K., Nicks, K. M., Cunningham, J. M., Atkinson, E. J., Therneau, T. M., McCready, L. K., Peterson, J. M., Drake, M. T., et al. (2015) · PLOS ONE · doi:10.1371/journal.pone.0138347 · Cited by 75
DFFNDDS: prediction of synergistic drug combinations with dual feature fusion networks
Xu, M., Zhao, X., Wang, J., Feng, W. Q., Wen, N., Wang, C., Wang, J., Liu, Y., & Zhao, L. (2023) · Journal of Cheminformatics · doi:10.1186/s13321-023-00690-3 · Cited by 74
SynergyX: a multi-modality mutual attention network for interpretable drug synergy prediction
Guo, Y., Hu, H., Chen, W., Yin, H., Wu, J., Hsieh, C., He, Q., & Cao, J. (2024) · Briefings in Bioinformatics · doi:10.1093/bib/bbae015 · Cited by 68
Long noncoding RNA H19: functions and mechanisms in regulating programmed cell death in cancer
Xia, Y., Pei, T., Zhao, J., Wang, Z., Shen, Y., Yang, Y., & Liang, J. (2024) · Cell Death Discovery · doi:10.1038/s41420-024-01832-8 · Cited by 60
Senolytic Targeting of Bcl-2 Anti-Apoptotic Family Increases Cell Death in Irradiated Sarcoma Cells
Lafontaine, J., Cardin, G. B., Malaquin, N., Boisvert, J.-S., Rodier, F., & Wong, P. (2021) · Cancers · doi:10.3390/cancers13030386 · Cited by 54
Sun, Y., Qin, H., Zhang, H., Feng, X., Yang, L., Hou, D., & Chen, J. (2021) · Food & Nutrition Research · doi:10.29219/fnr.v65.6355 · Cited by 51
Fan, L., Qiu, X., Zhu, Z., Lv, J., Lu, J., Mao, F., Zhu, J., Wang, J., Guan, X., Chen, J., et al. (2019) · Acta Pharmacologica Sinica · doi:10.1038/s41401-019-0220-1 · Cited by 46
High-throughput screening unveils nitazoxanide as a potent PRRSV inhibitor by targeting NMRAL1
Cui, Z., Liu, J., Xie, C., Wang, T., Sun, P., Wang, J., Li, J., Li, G., Qiu, J., Zhang, Y., et al. (2024) · Nature Communications · doi:10.1038/s41467-024-48807-y · Cited by 45
Jaśkiewicz, M., Moszyńska, A., Serocki, M., Króliczewski, J., Bartoszewska, S., Collawn, J. F., & Bartoszewski, R. (2022) · IfADo - Leibniz Research Centre for Working Environment and Human Factors, Dortmund · doi:10.17179/excli2021-4622 · Cited by 37
The GenoPred pipeline: a comprehensive and scalable pipeline for polygenic scoring
Pain, O., Al‐Chalabi, A., & Lewis, C. M. (2024) · Bioinformatics · doi:10.1093/bioinformatics/btae551 · Cited by 36
Qin, G., Li, Y., Xu, X., Wang, X., Zhang, K., Tang, Y., Qiu, H., Shi, D., Zhang, C., Qian, L., et al. (2019) · Cellular Signalling · doi:10.1016/j.cellsig.2019.03.014 · Cited by 35
Liu, C., Ye, Y., Zhou, Q., Zhang, R., Zhang, H., Liu, W., Xu, C., Liu, L., Huang, S., & Chen, L. (2016) · Oncotarget · doi:10.18632/oncotarget.7183 · Cited by 32
Self-citationKhan, S. A., & Lee, T. K. (2022) · Frontiers in Pharmacology · doi:10.3389/fphar.2022.968148 · Cited by 24
Benchmarking enrichment analysis methods with the disease pathway network
Buzzao, D., Castresana-Aguirre, M., Guala, D., & Sonnhammer, E. L. L. (2024) · Briefings in Bioinformatics · doi:10.1093/bib/bbae069 · Cited by 24
Ren, J., Li, G., Zhao, W., Lin, L., & Tao, Y. (2016) · World Journal of Gastroenterology · doi:10.3748/wjg.v22.i15.3962 · Cited by 24
Schwab, M. (2008) · Springer eBooks · doi:10.1007/978-3-540-47648-1 · Cited by 21
Prystowsky, M. B., Feeney, K. M., Kawachi, N., Montagna, C., Willmott, M., Wasson, C. W., Antkowiak, M. K., Loudig, O. D., & Parish, J. L. (2013) · Scientific Reports · doi:10.1038/srep02640 · Cited by 18
A Deep Neural Network for Predicting Synergistic Drug Combinations on Cancer
Yan, S., & Ding, Z. (2024) · Interdisciplinary Sciences Computational Life Sciences · doi:10.1007/s12539-023-00596-6 · Cited by 18
Dual-view jointly learning improves personalized drug synergy prediction
Li, X., Shen, B., Feng, F., Li, K., Tang, Z., Ma, L., & Li, H. (2024) · Bioinformatics · doi:10.1093/bioinformatics/btae604 · Cited by 18
Jia, X., Zheng, Y.-S., Guo, Y., & Chen, K. (2019) · Molecular Genetics & Genomic Medicine · doi:10.1002/mgg3.613 · Cited by 16
The role of CBFβ in AML1-ETO's activity
Park, S., Speck, N. A., & Bushweller, J. H. (2009) · Blood · doi:10.1182/blood-2009-07-231233 · Cited by 16
Oh, Y., Park, J. H., Djunadi, T. A., Shah, Z., Chung, L. I., & Chae, Y. K. (2024) · Frontiers in Endocrinology · doi:10.3389/fendo.2024.1304188 · Cited by 15
Monem, S., Hassanien, A. E., & Abdel‐Hamid, A. H. (2024) · BMC Bioinformatics · doi:10.1186/s12859-024-05925-0 · Cited by 14
Sun, B., Du, H., Hou, S., Hu, Q., Pang, X., Wei, D., & Wang, X. (2025) · IEEE Journal of Biomedical and Health Informatics · doi:10.1109/jbhi.2025.3561887 · Cited by 13
Shuna, X., Xing, J., Zheng, L., Su, H., Zou, Y., Niu, Y., & Di, H. (2024) · International Immunopharmacology · doi:10.1016/j.intimp.2024.112426 · Cited by 12
Wang, H., Zhuang, L., Ding, Y., Tiwari, P., & Cheng, L. (2024) · Artificial Intelligence in Medicine · doi:10.1016/j.artmed.2024.103029 · Cited by 9
A multilayer dynamic perturbation analysis method for predicting ligand–protein interactions
Gu, L., Ли, Б., & Ming, D. (2022) · BMC Bioinformatics · doi:10.1186/s12859-022-04995-2 · Cited by 6
Self-citationShao, L., Wang, N., Yan, Y., Tan, Y., Wu, Q., Lei, L., Wang, M., & Liu, L. (2024) · PubMed Central · doi:10.22038/ijbms.2024.72049.15662 · Cited by 5
Predicting Synergistic Drug Combinations Based on Fusion of Cell and Drug Molecular Structures
Yan, S., Yu, G., Yang, J., & Chen, L. (2025) · Interdisciplinary Sciences Computational Life Sciences · doi:10.1007/s12539-025-00695-6 · Cited by 3
Inducing Apoptosis of Norcantharidin in Combination with ABT-737 on Cervical Cancer Cells
Wang, N. (2014) · Journal of International Reproductive Health/Family Planning · Cited by 1
Panobinostat Inhibits JAK2/STAT3 Pathway in Multiple Myeloma.
Perrone, G., Calabrese, E., Hideshima, T., Görgün, G., Hiroshi, I., Cristea, D., Santo, L., Hu, Y., & Anderson, K. C. (2009) · Blood · doi:10.1182/blood.v114.22.2849.2849 · Cited by 1
Dancey, J. E. (2008) · Springer eBooks · doi:10.1007/978-3-540-47648-1_5724 · Cited by 1
Research works printed but not linked: 1
- Frezzato, 2020, Strategies to Fight Ibrutinib-Resistance in Chronic Lymphocytic Leukemia, Haematologica, 105, S97
Cited by
Sorted by citations
Ignatova, E., & Likhter, M. (2026) · bioRxiv (Cold Spring Harbor Laboratory) · doi:10.64898/2026.09.23.753774
Metadata
- Authors
- Ye, Y., Su, T., Gao, J., & Ming, D.
- Affiliations
- Nanjing Tech University (CN)
- Corresponding author
- Ming, Dengming
- Venue
- International Journal of Molecular Sciences
- Publisher
- MDPI AG
- Published
- 2025-09-16
- Volume
- 26
- Issue
- 18
- Pages
- 9004
- ISSN
- 1422-0067 (ISSN-L)
- PMC
- PMC12469854
- OpenAlex
- W4414244012
- Cited by
- 0
- References
- 71
- FWCI
- 0.00
- Type
- journal article
- Language
- en
- Open access
- gold
- doi.org
- Licence
- Locations
- International Journal of Molecular Sciences (publishedVersion, cc-by)
- bioRxiv (Cold Spring Harbor Laboratory) (acceptedVersion)
- Europe PMC (PubMed Central) (publishedVersion, cc-by)
- PubMed (publishedVersion)
- PubMed Central (publishedVersion, cc-by)
- Topics
- Life Sciences › Pharmacology, Toxicology and Pharmaceutics › Drug Discovery › Computational Drug Discovery Methods
- Life Sciences › Biochemistry, Genetics and Molecular Biology › Cell Biology › Telomeres, Telomerase, and Senescence
- Life Sciences › Biochemistry, Genetics and Molecular Biology › Aging › Genetics, Aging, and Longevity in Model Organisms
- Keywords
- senolytics, drug combination prediction, drug synergy, aging, dasatinib, quercetin, temsirolimus, nitazoxanide, aging-related genes, differential gene expression
- MeSH terms
- Dasatinib, Machine Learning, Senotherapeutics, Aging, Drug Combinations, Drug Synergism, Humans, Quercetin, Genomics
About these checks
Registry, retraction, Cites and statistics results are computed, not judged, with one exception: a printed reference that no index lists is read once by a model before it counts as a citation error. Claims are extracted by a model and kept only when their quote appears verbatim in the text; each cited source is then checked, with a model’s help, for whether it says what the claim relies on. Those verdicts can be wrong — read the claim’s quote and the cited source before relying on one.
Statistics and arithmetic are recomputed, not judged.
Confidence bands are shown only for fields calibrated on our annotated test set. None is calibrated yet, so no band is shown.
What counts as a claim ›How we measure confidence ›How we check this ›
Are you an author, or do you see a problem with this page? Request a review
