

The DOI matches its Crossref record; 75 of the 76 references it cites were found in a registry or an index, and 1 are not checked yet; none of the 70 sources its claims cite is checked for support yet.
Energy Expenditure, Dietary Energy Intake, and Nutritional Supplements in Adolescent Volleyball Athletes versus Nonathletic Controls
Open accessAbstract
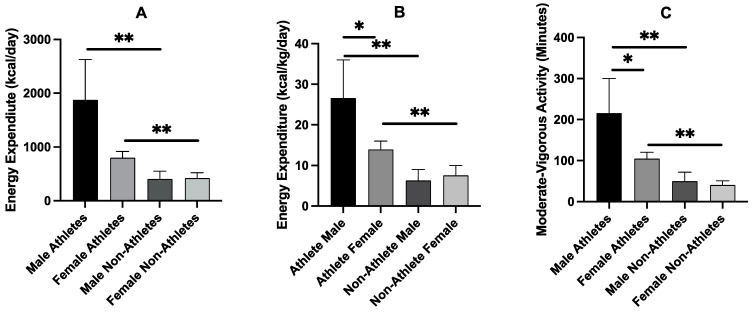
Evidence suggests that athletes competing in team sports do not follow dietary recommendations. However, only few studies have investigated energy needs and supplement use in adolescent athletes, and whether they are meeting their energy requirements. This observational study examined energy expenditure, dietary energy intake, and use of nutritional supplements in 58 adolescent (14–17 years old) volleyball athletes (15 males, 43 females) and 58 age-matched nonathletic controls (13 males, 45 females). Participants completed an online survey including questions on demographic information, body mass, and a series of standardized questionnaires assessing energy expenditure, dietary energy, macronutrient, micronutrient, and supplement intake. Energy expenditure relative to body mass was higher in athletes than nonathletes by 13 kcal/kg/day (group effect, p < 0.001), and in males compared to females by 5.7 kcal/kg/day (sex effect, p = 0.004). Athletes had higher energy intake than nonathletes (+6.4 kcal/kg/day, p = 0.019) and greater consumption of fruits (p = 0.034), vegetables (p = 0.047), grains (p = 0.016), dairy (p = 0.038), meats and meat alternatives (p < 0.001), as well as higher intakes of fat (p < 0.001), carbohydrates, protein, sugar, fiber, vitamin C, calcium, and sodium (p = 0.05) compared to nonathletes. The average protein intakes exceeded the upper recommendations in all groups, suggesting that this is not a nutrient of concern for young volleyball athletes. However, athletes were only meeting 60% of the estimated energy requirements (EER) for their age, height, body mass, and physical activity score, (3322 ± 520 kcal/day), while nonathletes were meeting 74% of the EER (p < 0.001). The relative energy balance of male athletes was lower compared to both female athletes (p = 0.006) and male nonathletes (p = 0.004). Finally, more athletes reported using performance-related supplements than nonathletes, but there were no differences in the consumption of other dietary supplements. Overall, when compared to nonathletic controls, both male and female adolescent volleyball athletes were found to match their higher energy expenditure with a greater dietary energy intake; however, all adolescents were below the estimated energy requirements, a finding more profound among the volleyball athletes.
Checked 2026-11-14 · 1 reference not checked yet
Overview
CoChat Summary
TL;DR
This observational study compared energy expenditure, dietary intake, and supplement use in 58 adolescent volleyball athletes and 58 age-matched nonathletic controls. Athletes matched their higher energy expenditure with greater energy intake than nonathletes, but all adolescents were below estimated energy requirements, with athletes meeting only 60% of EER versus 74% in nonathletes.
Key findings
- Energy expenditure relative to body mass was higher in athletes than nonathletes by 13 kcal/kg/day (p < 0.001), and in males than females by 5.7 kcal/kg/day (p = 0.004).
- Athletes had higher relative energy intake than nonathletes (+6.4 kcal/kg/day, p = 0.019; absolute +517 kcal/day, p < 0.001) and greater intakes of fruits, vegetables, grains, dairy, meats/alternatives, fat, carbohydrates, protein, sugar, fiber, vitamin C, calcium, and sodium (p ≤ 0.05).
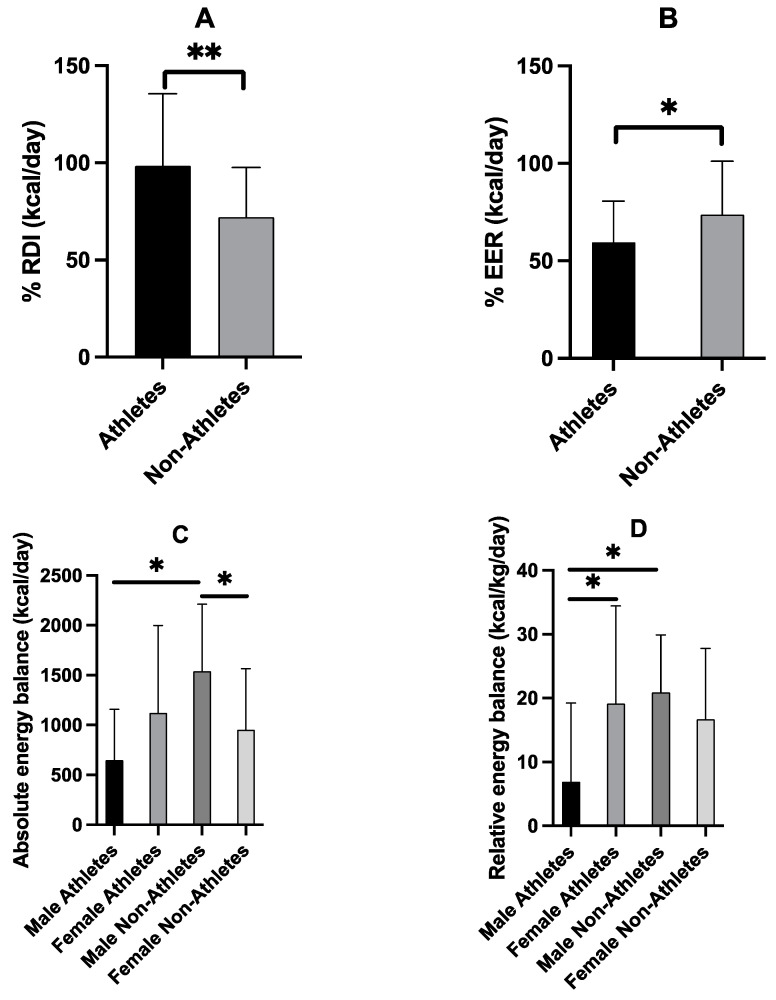
- Athletes met only 60% of estimated energy requirements (EER; 3322 ± 520 kcal/day), while nonathletes met 74% (2021 ± 510 kcal/day; p = 0.001); relative energy balance of male athletes was lower than female athletes (p = 0.006) and male nonathletes (p = 0.004).
- Average protein intakes exceeded upper recommendations in all groups; more athletes reported performance-related supplement use than nonathletes, with no differences in other dietary supplements; females more often used vitamin D and vitamin C than males (38% vs 14%, both p = 0.022).
Methods
- Observational cross-sectional online survey conducted in Ontario, Canada, from June 2022 to October 2022.
- Participants: 116 adolescents aged 14–17 years: 58 volleyball athletes (15 male, 43 female; elite club players training ≥6 h/week) and 58 age-matched nonathletic controls (13 male, 45 female; not participating in competitive sports).
- Measures and analysis: Block 2014 Food Frequency and Activity Questionnaire over the past 6 months for energy intake, diet quality, and physical activity; EER equations with assigned physical activity levels; supplement-use questions; two-way ANOVAs, independent t-tests, and chi-square tests, with significance set at p = 0.05.
Limitations
- The paper states the sample consisted heavily of females, so it cannot be considered representative of the general volleyball population and results should be interpreted with caution.
- The paper states data are self-reported and subject to recall error and social desirability bias, and energy expenditure was not measured physiologically; future studies should use standard physiological methods such as direct calorimetry.
- Evident from the text: the cross-sectional design cannot establish causality or temporal relationships, and the convenience sampling plus recruitment via Canada Games/clubs for athletes versus social media for nonathletes may introduce selection bias; BMI also relied on self-reported height and body mass.
Model-written summary. Check it against the paper before relying on it.
Integrity signals
Registry
Cites
Statistics
Figures
Verification
Claims the paper makes
0 Valid · 0 Not valid · 30 Not checked · 120 Own results and interpretations
A result the paper reports from its own data — it cites no other source for it, so there is none to check. The quote shows it is in the paper.
In the paper
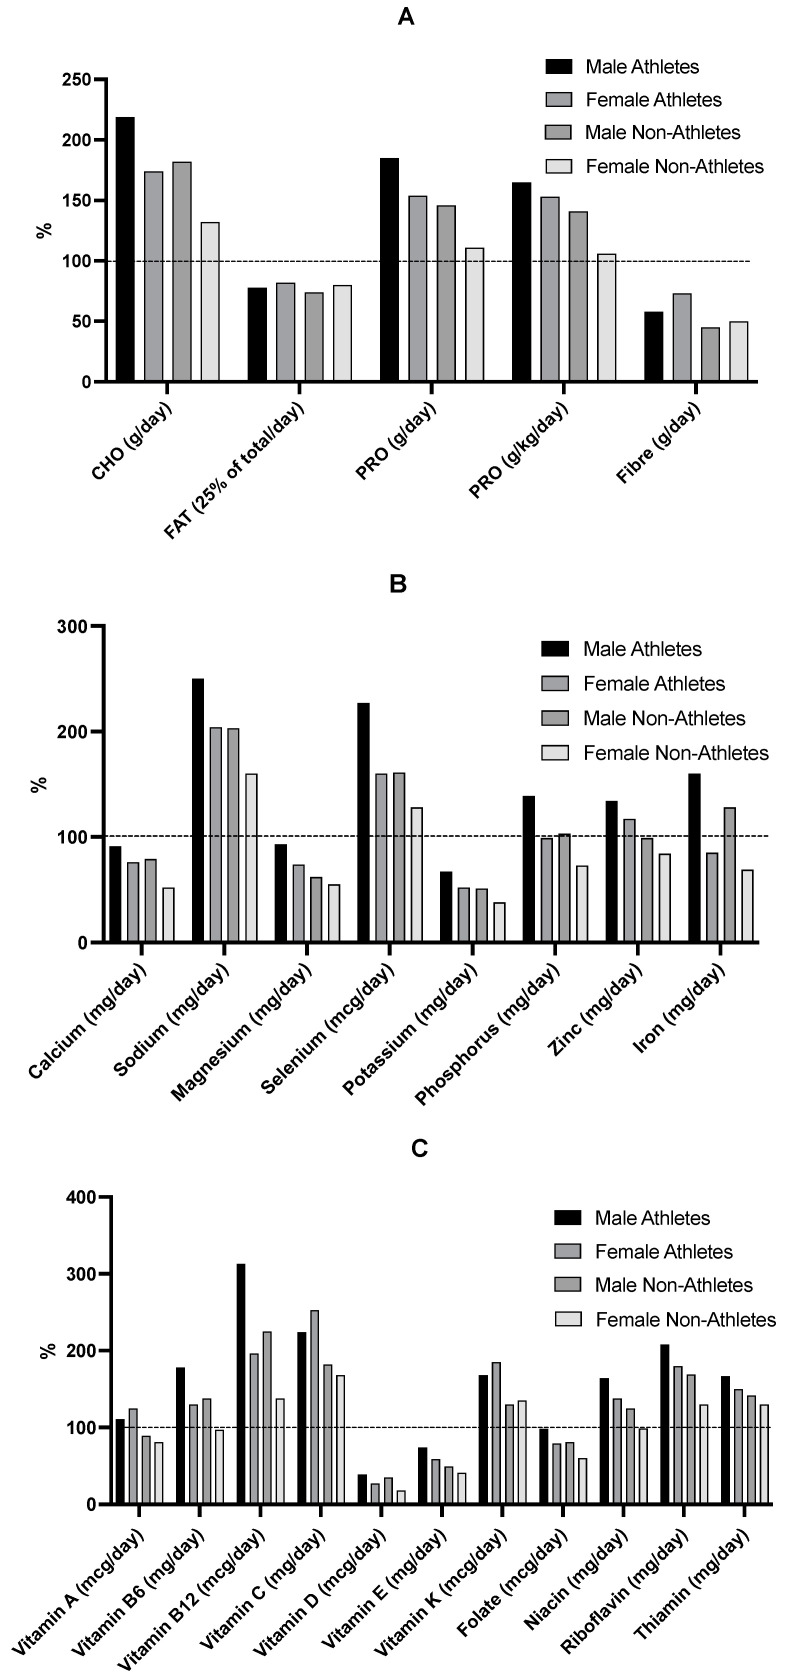
“The average protein intakes exceeded the upper recommendations in all groups, suggesting that this is not a nutrient of concern for young volleyball athletes.”
§ Energy Expenditure, Dietary Energy Intake, and Nutritional Supplements in Adolescent Volleyball Athletes versus Nonathletic Controls > Abstract
plainn = 58- Asserted: passes — The authors put it forward as true.
- Checkable: passes — It can be checked against evidence.
- Load-bearing: passes — The paper’s conclusions depend on it.
- Based: passes — The paper gives a reason why it holds.
A result the paper reports from its own data — it cites no other source for it, so there is none to check. The quote shows it is in the paper.
In the paper
“There was no sex-by-group interaction in either absolute or relative energy intake.”
§ Energy Expenditure, Dietary Energy Intake, and Nutritional Supplements in Adolescent Volleyball Athletes versus Nonathletic Controls > 3. Results
plain- Asserted: passes — The authors put it forward as true.
- Checkable: passes — It can be checked against evidence.
- Load-bearing: unclear — It is unclear whether the paper’s conclusions depend on it.
- Based: passes — The paper gives a reason why it holds.
A result the paper reports from its own data — it cites no other source for it, so there is none to check. The quote shows it is in the paper.
In the paper
“The relative energy balance of male athletes was lower compared to both female athletes (p = 0.006) and male nonathletes (p = 0.004).”
- Also stated in: § 3. Results · boosted
“Importantly, Figure 4D shows male athletes having significantly lower relative energy balance than female athletes (F = 1.628, p = 0.006) and male nonathletes (F = 0.156, p = 0.004).”
§ Energy Expenditure, Dietary Energy Intake, and Nutritional Supplements in Adolescent Volleyball Athletes versus Nonathletic Controls > Abstract
boosted- Asserted: passes — The authors put it forward as true.
- Checkable: passes — It can be checked against evidence.
- Load-bearing: passes — The paper’s conclusions depend on it.
- Based: passes — The paper gives a reason why it holds.
- Also stated in: § 3. Results · boosted
A result the paper reports from its own data — it cites no other source for it, so there is none to check. The quote shows it is in the paper.
In the paper
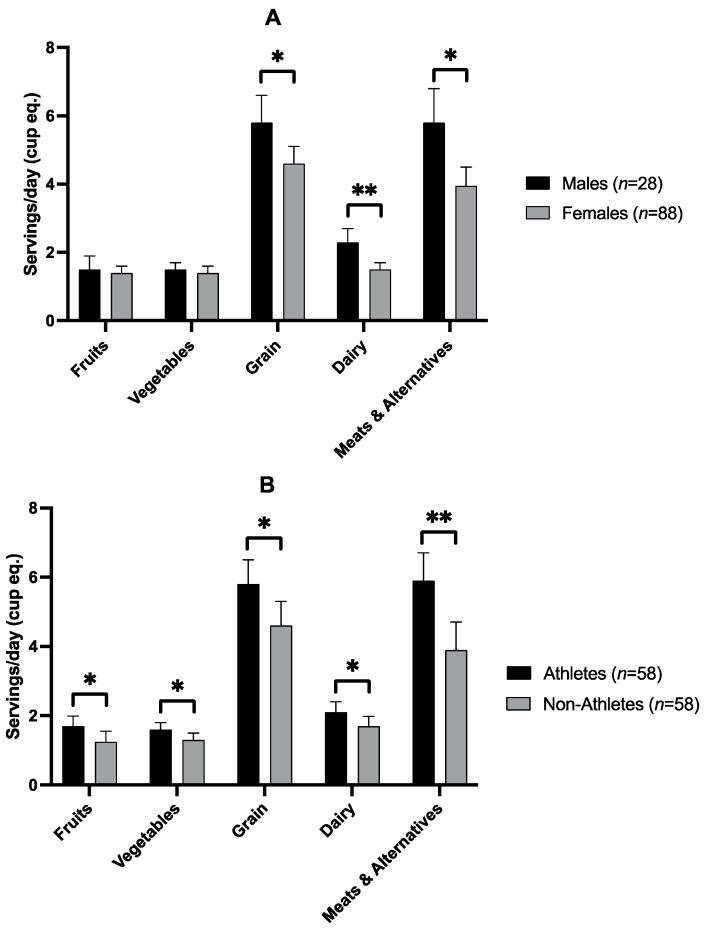
“Athletes had higher energy intake than nonathletes (+6.4 kcal/kg/day, p = 0.019) and greater consumption of fruits (p = 0.034), vegetables (p = 0.047), grains (p = 0.016), dairy (p = 0.038), meats and meat alternatives (p < 0.001), as well as higher intakes of fat (p < 0.001), carbohydrates, protein, sugar, fiber, vitamin C, calcium, and sodium (p = 0.05) compared to nonathletes.”
- Also stated in: § 3. Results · plain
“Athletes had a greater intake of carbohydrates (54.5 g/day difference, F = 7.8, p = 0.006), fats (21.7 g/day difference, F = 13.6, p < 0.001), protein (20.5 g/day difference, F = 11.1, p = 0.001), and fiber (5.5 g/day difference, F = 9.7, p = 0.002) compared to nonathletes.”
§ Energy Expenditure, Dietary Energy Intake, and Nutritional Supplements in Adolescent Volleyball Athletes versus Nonathletic Controls > Abstract
plainstates an associationn = 58 ·- Asserted: passes — The authors put it forward as true.
- Checkable: passes — It can be checked against evidence.
- Load-bearing: unclear — It is unclear whether the paper’s conclusions depend on it.
- Based: passes — The paper gives a reason why it holds.
- Also stated in: § 3. Results · plain
A result the paper reports from its own data — it cites no other source for it, so there is none to check. The quote shows it is in the paper.
In the paper
“Athletes had higher energy intake than nonathletes (+6.4 kcal/kg/day, p = 0.019) and greater consumption of fruits (p = 0.034), vegetables (p = 0.047), grains (p = 0.016), dairy (p = 0.038), meats and meat alternatives (p < 0.001), as well as higher intakes of fat (p < 0.001), carbohydrates, protein, sugar, fiber, vitamin C, calcium, and sodium (p = 0.05) compared to nonathletes.”
§ Energy Expenditure, Dietary Energy Intake, and Nutritional Supplements in Adolescent Volleyball Athletes versus Nonathletic Controls > Abstract
plainstates an associationn = 58 ·- Asserted: passes — The authors put it forward as true.
- Checkable: passes — It can be checked against evidence.
- Load-bearing: unclear — It is unclear whether the paper’s conclusions depend on it.
- Based: passes — The paper gives a reason why it holds.
108 more claims
Create a free account to see all 150 claims and to verify the 70 references still open.
- It may state two separate claims as one. 14
- The quote only partly states this claim. 2
- Probably not a substantial claim. 25
Claims other papers make about this one
Each is checked against this paper’s own text: does it say what the citing paper says it does?
In the citing paper
“Recent research consistently demonstrates that adolescent athletes across various sports often fail to meet their energy requirements, highlighting the need for improved nutritional assessment and monitoring.”
From Optimizing Performance Nutrition for Adolescent Athletes: A Review of Dietary Needs, Risks, and Practical Strategies (2025) · cites this paper as [44]
In the citing paper
“Bell et al. found that although adolescent volleyball players consumed more calories than non-athletes, they only met 60% of their estimated energy requirements, compared to 74% in non-athletes, indicating a significant energy deficit [44].”
From Optimizing Performance Nutrition for Adolescent Athletes: A Review of Dietary Needs, Risks, and Practical Strategies (2025) · cites this paper as [44]
In the citing paper
“Several studies reported inadequate intake of key micronutrients, including vitamins A, D, and E, folate, calcium, iron, zinc, magnesium and potassium [31,53,63].”
From Dietary intake, nutrition knowledge, and behavior in youth team sport athletes: a scoping review and call to advance research and practice (2026) · cites this paper as [31]
In the citing paper
“The muscle mass of young athletes is also maintained by providing proper daily energy, macronutrients, and micronutrients according to several physiological and sports factors, including the child’s age, sex, growth rate, intensity of exercise, frequency, and duration of exercise (2, 3, 5, 6).”
From Junior athletes’ nutritional demands: a narrative review of consumption and prevalence of eating disorders (2024) · cites this paper as [5]
In the citing paper
“For example, in a group of 101 elite youth, Australian athletes, 51%, 27%, 46%, and 54%, of participants correctly answered questions pertaining to nutrients, daily reference intakes (DRIs), hydration, and recovery, respectively [14].”
From General and sport-specific nutrition knowledge and behaviors of adolescent athletes (2025) · cites this paper as [14]
2 more claims about this paper
Create a free account to see every claim other papers make about this one.
Self-check
Percentages, sums and reported differences re-computed from the paper’s own numbers.
Each contradiction between two passages listed here was confirmed by an independent check.
Rated major: it would touch a result — a value a result rests on, reported and recomputed p-values on opposite sides of the significance level, two passages that conflict with no sign which is right, or a cited work retracted before this paper was published.
In the paper
§ Energy Expenditure, Dietary Energy Intake, and Nutritional Supplements in Adolescent Volleyball Athletes versus Nonathletic Controls > Abstract
“Athletes had higher energy intake than nonathletes (+6.4 kcal/kg/day, p = 0.019)”
§ Energy Expenditure, Dietary Energy Intake, and Nutritional Supplements in Adolescent Volleyball Athletes versus Nonathletic Controls > 3. Results
“relative (7.8 kcal/kg/day difference, F = 5.7, p = 0.019) energy intake.”
Rated minor: it would not touch a result — a value no result rests on, a p-value that stays on the same side of the significance level, or a conflict that is clerical, resolved elsewhere in the paper, or outside its own findings.
In the paper
§ Energy Expenditure, Dietary Energy Intake, and Nutritional Supplements in Adolescent Volleyball Athletes versus Nonathletic Controls > 3. Results
“Figure 1 shows Health Canada’s five main food groups, fruits, vegetables, grains, dairy, and meat, and meat alternatives expressed as servings, which are equivalent to one cup per serving.”
§ Energy Expenditure, Dietary Energy Intake, and Nutritional Supplements in Adolescent Volleyball Athletes versus Nonathletic Controls > 3. Results
“Athletes reported consuming significantly more servings of fruits (F = 4.6, p = 0.034), vegetables (F = 4.0, p = 0.047), grains (F = 5.9, p = 0.016), dairy (F = 4.4, p = 0.038), and meat and meat alternatives (F = 11.8, p < 0.001) than nonathletes (Figure 2B).”
Citations
Cites
von Elm, E., Altman, D. G., Egger, M., Pocock, S. J., Gøtzsche, P. C., Vandenbroucke, J. P., & Initiative, F. T. S. (2007) · PLoS Medicine · doi:10.1371/journal.pmed.0040296 · Cited by 23,020
Trumbo, P., Schlicker, S., Yates, A. A., & Poos, M. (2002) · Journal of the American Dietetic Association · doi:10.1016/s0002-8223(02)90346-9 · Cited by 5,993
Physical fitness in childhood and adolescence: a powerful marker of health
Ortega, F. B., Ruiz, J. R., Castillo, M. J., & Sjöstróm, M. (2007) · International Journal of Obesity · doi:10.1038/sj.ijo.0803774 · Cited by 3,158
(2007) · Medicine & Science in Sports & Exercise · doi:10.1249/mss.0b013e318149f111 · Cited by 1,554
Mountjoy, M., Sundgot-Borgen, J., Burke, L., Carter, S., Constantini, N., Lebrun, C., Meyer, N., Sherman, R., Steffen, K., Budgett, R., et al. (2014) · British Journal of Sports Medicine · doi:10.1136/bjsports-2014-093502 · Cited by 1,469 · cited 3×
“This once again highlights the importance of improving the nutritional knowledge of young athletes, as it relates to bone health, energy availability, and in females menstrual function [71].”
BackgroundValidation of a self-administered diet history questionnaire using multiple diet records
Block, G., Woods, M., Potosky, A., & Clifford, C. (1990) · Journal of Clinical Epidemiology · doi:10.1016/0895-4356(90)90099-b · Cited by 1,197 · cited 1×
“This FFAQ is a commonly used measure of dietary intake and quality and energy expenditure [39], and has been tested for reliability and validity in Canadian women [40].”
MethodNutrition and Athletic Performance
(2009) · Medicine & Science in Sports & Exercise · doi:10.1249/mss.0b013e31890eb86 · Cited by 1,084 · cited 1×
“Additionally, female athletes, although seeming to consume more protein and fats, have a total energy intake less than that of male athletes [5,13,14].”
BackgroundIOC Consensus Statement: Dietary Supplements and the High-performance Athlete
Maughan, R. J., Burke, L. M., Dvorak, J., Larson-Meyer, D. E., Peeling, P., Phillips, S. M., Rawson, E. S., Walsh, N. P., Garthe, I., Geyer, H., et al. (2018) · British Journal of Sports Medicine · doi:10.1136/bjsports-2018-099027 · Cited by 1,004
Carbohydrates for training and competition
Burke, L. M., Hawley, J. A., Wong, S. H. S., & Jeukendrup, A. E. (2011) · Journal of Sports Sciences · doi:10.1080/02640414.2011.585473 · Cited by 985
ISSN exercise & sports nutrition review update: research & recommendations
Kerksick, C. M., Wilborn, C. D., Roberts, M. D., Smith-Ryan, A., Kleiner, S. M., Jäger, R., Collins, R., Cooke, M., Davis, J. N., Galvan, E., et al. (2018) · Journal of the International Society of Sports Nutrition · doi:10.1186/s12970-018-0242-y · Cited by 945
Research works printed but not linked: 1
- (2014). A Dictionary of Food and Nutrition, Oxford University Press. [4th ed.].
Cited by
Everett, S. (2025) · Nutrients · doi:10.3390/nu17172792 · Cited by 37
Amawi, A., Khataybeh, B., Al Aqaili, R., Ababneh, N., Alnimer, L., Qoqazeh, A., Oukal, F., Jahrami, H., Mousa Ay, K., Al Saoud, H., et al. (2024) · Frontiers in Nutrition · doi:10.3389/fnut.2024.1390204 · Cited by 26
Association between Low Energy Availability (LEA) and Impaired Sleep Quality in Young Rugby Players
Saidi, O., Souabni, M., Del Sordo, G. C., Maviel, C., Peyrel, P., Maso, F., Vercruyssen, F., & Duché, P. (2024) · Nutrients · doi:10.3390/nu16050609 · Cited by 18
Calella, P., Dio, M. D., Pelullo, C. P., Giuseppe, G. D., Liguori, F., Paduano, G., Valerio, G., Liguori, G., & Gallé, F. (2024) · Behavioral Sciences · doi:10.3390/bs14030208 · Cited by 21
General and sport-specific nutrition knowledge and behaviors of adolescent athletes
Gibbs, R. L., & Becker, T. B. (2025) · Journal of the International Society of Sports Nutrition · doi:10.1080/15502783.2025.2477060 · Cited by 17
Metadata
- Authors
- Bell, M., Ghatora, R., Retsidou, M. I., Chatzigianni, E. (., & Klentrou, P.
- Affiliations
- Brock University (CA)
- University of Peloponnese (GR)
- Corresponding author
- Klentrou, Panagiota
- Venue
- Nutrients
- Publisher
- MDPI AG
- Published
- 2023-04-06
- Volume
- 15
- Issue
- 7
- Pages
- 1788
- ISSN
- 2072-6643 (ISSN-L)
- PMC
- PMC10096554
- OpenAlex
- W4362669577
- Semantic Scholar
- ba937656a97a5522ec602d30d375e98f7058781d
- Cited by
- 37
- References
- 75
- Citations by year
- 2026: 11 · 2025: 9 · 2024: 11 · 2023: 6
- FWCI
- 5.67
- Type
- journal article
- Language
- en
- Open access
- gold
- doi.org
- Licence
- Locations
- Nutrients (publishedVersion, cc-by)
- PubMed Central (publishedVersion, cc-by)
- PubMed (publishedVersion)
- Funders
- Brock University
- Topics
- Health Sciences › Nursing › Nutrition and Dietetics › Nutrition, Health and Food Behavior
- Health Sciences › Medicine › Public Health, Environmental and Occupational Health › Nutrition and Health Studies
- Health Sciences › Nursing › Nutrition and Dietetics › Muscle metabolism and nutrition
- Keywords
- youth athletes, volleyball, energy expenditure, energy intake, dietary supplements, energy balance, macronutrient intake, micronutrient intake, protein intake, sex differences, team sports, dietary recommendations, energy requirements, vitamin C, calcium, sodium, dietary fat intake, carbohydrate intake, physical activity, dietary habits, eating disorder risk
- MeSH terms
- Adolescent, Energy Intake, Diet, Dietary Carbohydrates, Dietary Fats, Dietary Proteins, Energy Metabolism, Female, Humans, Male, Nutritional Requirements, Dietary Supplements, Volleyball, Athletes
About these checks
Registry, retraction, Cites and statistics results are computed, not judged, with one exception: a printed reference that no index lists is read once by a model before it counts as a citation error. Claims are extracted by a model and kept only when their quote appears verbatim in the text; each cited source is then checked, with a model’s help, for whether it says what the claim relies on. Those verdicts can be wrong — read the claim’s quote and the cited source before relying on one.
A language model drew the claims from the paper on 2026-11-14, under version 3 of the claim definition (model deepseek-v4.1-flash, prompt extract-v3).
A second model labelled each claim on 2026-11-14 (model jev-1.13-20260917, definition revision gold-guideline-v0.2).
Statistics and arithmetic are recomputed, not judged.
Confidence bands are shown only for fields calibrated on our annotated test set. None is calibrated yet, so no band is shown.
What counts as a claim ›How we measure confidence ›How we check this ›
Are you an author, or do you see a problem with this page? Request a review
Data sources
Bibliographic data: Semantic Scholar, OpenAlex, Crossref.
Contains information from the Semantic Scholar Academic Graph Datasets, made available under the ODC Attribution License (ODC-BY 1.0).
Semantic Scholar’s data is described in: Kinney, R., et al. (2023). The Semantic Scholar Open Data Platform. arXiv:2301.10140.
