

Sensor Data Acquisition and Multimodal Sensor Fusion for Human Activity Recognition Using Deep Learning
Open accessThe DOI matches its Crossref record; 49 of the 49 references it cites were found in a registry or an index; 5 of the 32 sources its claims cite were checked for support.
Abstract
In this paper, we perform a systematic study about the on-body sensor positioning and data acquisition details for Human Activity Recognition (HAR) systems. We build a testbed that consists of eight body-worn Inertial Measurement Units (IMU) sensors and an Android mobile device for activity data collection. We develop a Long Short-Term Memory (LSTM) network framework to support training of a deep learning model on human activity data, which is acquired in both real-world and controlled environments. From the experiment results, we identify that activity data with sampling rate as low as 10 Hz from four sensors at both sides of wrists, right ankle, and waist is sufficient in recognizing Activities of Daily Living (ADLs) including eating and driving activity. We adopt a two-level ensemble model to combine class-probabilities of multiple sensor modalities, and demonstrate that a classifier-level sensor fusion technique can improve the classification performance. By analyzing the accuracy of each sensor on different types of activity, we elaborate custom weights for multimodal sensor fusion that reflect the characteristic of individual activities.
Overview
CoChat Summary
TL;DR
The paper builds an eight-IMU testbed and LSTM framework to study on-body sensor placement, sampling rate, and multimodal fusion for human activity recognition. It finds that 10 Hz data from four sensors—both wrists, right ankle, and waist—is sufficient for ADLs, and classifier-level fusion improves recognition accuracy up to 94.47%.
Key findings
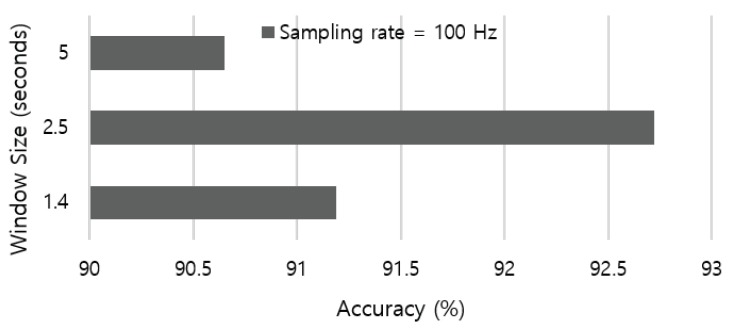
- Activity data with sampling rate as low as 10 Hz from four sensors at both wrists, right ankle, and waist was sufficient for recognizing ADLs including eating and driving; a 2.5 s sliding window outperformed other settings, with 25 samples covering 2.5 s.
- The four-sensor baseline achieved 93.0% recognition accuracy. Among three-sensor combinations, right wrist, right ankle, and waist was most competitive; with two sensors, placing one on the upper half and one on the lower half performed better than both on the upper or both on the lower half. Right wrist tended to outperform left wrist, and right ankle played a more critical role than waist.
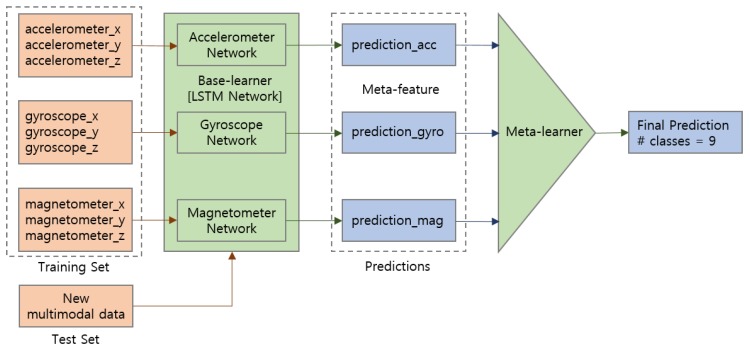
- Single-modality accuracy was 92.18% for accelerometer, 85.22% for magnetometer, and 78.33% for gyroscope. Multimodal fusion reached up to 93.07% with stacking/voting, while soft-voting achieved 94.47% versus hard-voting at 93.48%, a 2.48% improvement over single-modal recognition.
- Activity-specific weights increased accuracy by 7.65% for walking upstairs and 36.97% for walking downstairs. Static activities were best detected by accelerometer, and fusing additional sensors could degrade sitting/standing accuracy; stair walking was often confused with plain walking.
Methods
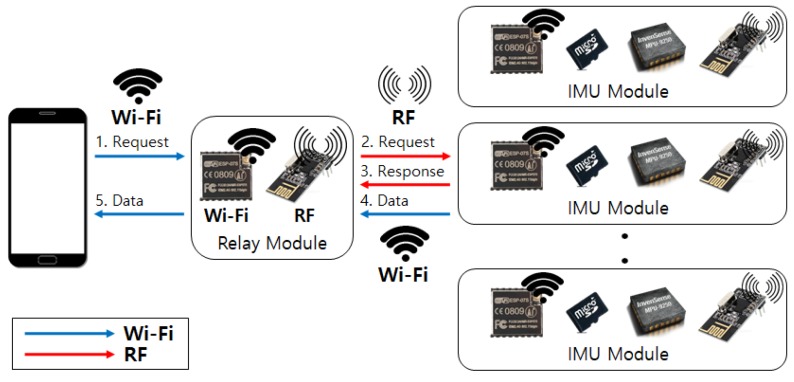
- A testbed with eight body-worn IMU sensors (MPU-9250) and an Android mobile device collected data from five researchers (two males, three females; ages 34–48; heights 160–175 cm; all right-handed) over three workdays, about three hours per subject, in real-world and controlled environments. Final configuration used four sensors on left/right wrist, right ankle, and waist.
- Raw sensor data were fed to an LSTM network with a 2.5 s sliding window and 50% overlap; parameters included batch size 150, one stacked LSTM layer, hidden neuron size 32, 25 steps, and keep probability 0.8. Evaluation used 10-fold cross-validation and leave-one-subject-out cross-validation with jittering data augmentation.
- Sensor fusion used classifier-level two-level ensembles: LSTM base learners per modality, stacking with Random Forest/kNN/SVM meta-learners (Random Forest adopted), and soft/hard voting with weights based on sensor accuracy or activity-specific characteristics.
Limitations
- The paper states that experiments used a small number of test subjects within the institution, that the meta-learner was evaluated only with classical algorithms (RF, kNN, SVM), and that future work should include large-scale/long-term experiments, additional sensing modalities, and online weight learning.
- Evident from the text: the pilot involved only five right-handed subjects with limited demographic variation, gyroscope data were used without calibration, and stair walking versus plain walking produced equivocal results.
Model-written summary. Check it against the paper before relying on it.
Integrity signals
Registry
Cites
Statistics
Figures




Verification
Claims the paper makes
4 Valid · 0 Not valid · 13 Not checked · 50 Own results and interpretations
The sources with a verdict support this claim; the rest weren’t checked yet, have no full text we could read, or their verdicts aren’t rated yet.
In the paper
“Authors of [18] surveyed ADLs and their occurrence in public HAR datasets, and we find that six primitive activity labels including walking, standing, sitting, lying, walking upstairs, and walking downstairs can cover daily activities listed in time-use survey results.”
§ Sensor Data Acquisition and Multimodal Sensor Fusion for Human Activity Recognition Using Deep Learning > 3. Testbed and Data Acquisition > 3.2. ADLs
What the sources say
- Not checked yetcites [37] (2019, April 09). The General Social Survey—Statistics Canada, Available online: https://www150.statcan.gc.ca/n1/pub/89f0115x/89f0115x2013001-eng.htm.
- Not checked yetcites [38] (2019, April 09). The time use Survey—Statistics Korea, Available online: http://kostat.go.kr/portal/eng/pressReleases/11/6/index.board.
- Supportedcites [18] Micucci, D., Mobilio, M., and Napoletano, P. (2017). UniMiB SHAR: A Dataset for Human Activity Recognition Using Acceleration Data from Smartphones. Appl. Sci., 7. source
Section 2.2 states that the authors analyzed ADLs across 24 publicly available datasets, and Figure 1 shows their occurrence in those datasets. The six-label coverage of time-use survey results is explicitly framed as the citing authors’ own finding, not a finding attributed to this source. (LLM, conf=0.94)
plain- Asserted: passes — The authors put it forward as true.
- Checkable: passes — It can be checked against evidence.
- Load-bearing: passes — The paper’s conclusions depend on it.
- Based: passes — The paper gives a reason why it holds.
The cited sources support only part of this claim — read each source’s verdict below.
In the paper
“However, as the dataset adopts heterogeneous sensors on limited position of the human body, it is not sufficient to evaluate the recognition performance according to the sensor position and sampling rate.”
§ Sensor Data Acquisition and Multimodal Sensor Fusion for Human Activity Recognition Using Deep Learning > 2. Related Work > 2.2. Mobile Sensing and Public Datasets
What the sources say
- Partly supportedcites [15] Vaizman, 2017, Recognizing Detailed Human Context in the Wild from Smartphones and Smartwatches, IEEE Pervasive Comput. sourceExperimental — accuracy not yet measured
Our copy supports the descriptive premise: the dataset is built from a phone app plus a companion Pebble smartwatch, with heterogeneous sensors sampled at different rates (Table 2, 'Sensor measurements' / 'EVALUATION AND RESULTS': accelerometer/gyro/magnetometer 40Hz, watch accelerometer 25Hz, compass and location variable, audio 22,050Hz reduced to MFCC), and body placement is limited to the wrist watch (DATA COLLECTION: 'the majority of the subjects (93%) were right handed, and chose to wear the smartwatch on their left wrist') plus the subjects' own phone in unconstrained positions. However, no passage states or argues that the dataset is insufficient to evaluate recognition performance as a function of sensor position or sampling rate; the paper instead treats unconstrained device placement as a desired in-the-wild condition to be overcome (Related work) and evaluates sensor modality/fusion, not position or sampling-rate effects (Performance evaluation; Fig. 3). That insufficiency conclusion is the citing authors' own inference, so only part of what is attributed to this source is in it. (LLM, conf=0.68)
- Not checked yetcites [16] Vaizman, Y., Ellis, K., Lanckriet, G., and Weibel, N. (2018, January 21–26). ExtraSensory App: Data Collection In-the-Wild with Rich User Interface to Self-Report Behavior. Proceedings of the 2018 CHI Conference on Human Factors in Computing Systems (CHI ’18), Montreal QC, Canada. source
plainstates a cause- Asserted: passes — The authors put it forward as true.
- Checkable: passes — It can be checked against evidence.
- Load-bearing: unclear — It is unclear whether the paper’s conclusions depend on it.
- Based: passes — The paper gives a reason why it holds.
- Partly supported
A result the paper reports from its own data — it cites no other source for it, so there is none to check. The quote shows it is in the paper.
In the paper
“From the experiment results, we identify that activity data with sampling rate as low as 10 Hz from four sensors at both sides of wrists, right ankle, and waist is sufficient in recognizing Activities of Daily Living (ADLs) including eating and driving activity.”
§ Sensor Data Acquisition and Multimodal Sensor Fusion for Human Activity Recognition Using Deep Learning > Abstract
plainstates a cause- Asserted: passes — The authors put it forward as true.
- Checkable: passes — It can be checked against evidence.
- Load-bearing: passes — The paper’s conclusions depend on it.
- Based: passes — The paper gives a reason why it holds.
- Rests on an assumption not shown here.
A result the paper reports from its own data — it cites no other source for it, so there is none to check. The quote shows it is in the paper.
In the paper
“We adopt a two-level ensemble model to combine class-probabilities of multiple sensor modalities, and demonstrate that a classifier-level sensor fusion technique can improve the classification performance.”
§ Sensor Data Acquisition and Multimodal Sensor Fusion for Human Activity Recognition Using Deep Learning > Abstract
boostedstates a cause- Asserted: passes — The authors put it forward as true.
- Checkable: passes — It can be checked against evidence.
- Load-bearing: passes — The paper’s conclusions depend on it.
- Based: passes — The paper gives a reason why it holds.
- Rests on an assumption not shown here.
A result the paper reports from its own data — it cites no other source for it, so there is none to check. The quote shows it is in the paper.
In the paper
“Participants experienced significant discomfort incurred by the sensor on the chest; we dropped the chest sensor in the final testbed configuration for its feasibility.”
§ Sensor Data Acquisition and Multimodal Sensor Fusion for Human Activity Recognition Using Deep Learning > 3. Testbed and Data Acquisition > 3.4. Final Testbed Configuration
plainstates a cause- Asserted: passes — The authors put it forward as true.
- Checkable: passes — It can be checked against evidence.
- Load-bearing: passes — The paper’s conclusions depend on it.
- Based: passes — The paper gives a reason why it holds.
41 more claims
Create a free account to see all 67 claims and to verify the 27 references still open.
- Probably not a substantial claim. 9
- It may state two separate claims as one. 12
- The quote only partly states this claim. 1
Claims other papers make about this one
Each is checked against this paper’s own text: does it say what the citing paper says it does?
The cited source doesn’t support the claim as written.
In the citing paper
“However, due to the lack of proper filtration and feature extraction techniques applied, the system was not able to recognize the ADL correctly.”
From A Multimodal IoT-Based Locomotion Classification System Using Features Engineering and Recursive Neural Network (2023) · cites this paper as [17]
Checked by a reasoning model — may be wrong.
Experimental — accuracy not yet measuredThe source backs part of the claim, not all of it — or backs it for a different population, condition or comparison.
In the citing paper
“In sensor-based HAR leveraging the temporal nature of IMU signals allows for the application of augmentation methods grounded in signal processing [32,34,99,132,141,178,193].”
From Past, Present, and Future of Sensor-based Human Activity Recognition Using Wearables: A Surveying Tutorial on a Still Challenging Task (2025) · cites this paper as [34]
Experimental — accuracy not yet measured
Citations
Cites
Hochreiter, S., & Schmidhuber, J. (1997) · Neural Computation · doi:10.1162/neco.1997.9.8.1735 · Cited by 102,318 · cited 2×
“As a variation of RNN architecture, LSTM [25] network is renowned for its capability to learn long-term dependencies in time-series data by the selective forget-and-update procedure.”
BackgroundMethodA systematic analysis of performance measures for classification tasks
Sokolova, M., & Lapalme, G. (2009) · Information Processing & Management · doi:10.1016/j.ipm.2009.03.002 · Cited by 7,515 · cited 1×
“On the other hand, macro-averaging F1-score is a harmonic mean of precision and recall measures, and takes both false positives and false negatives into account based on a per-class average [42].”
BackgroundDeep Convolutional and LSTM Recurrent Neural Networks for Multimodal Wearable Activity Recognition
Ordóñez, F., & Roggen, D. (2016) · Sensors · doi:10.3390/s16010115 · Cited by 2,761 · cited 1×
“Thus, LSTM network model is renowned for its performance on HAR domains [32].”
BackgroundDeep learning for sensor-based activity recognition: A survey
Wang, J., Chen, Y., Hao, S., Peng, X., & Hu, L. (2019) · Pattern Recognition Letters · doi:10.1016/j.patrec.2018.02.010 · Cited by 2,014 · cited 1×
“Besides the body-worn sensors, object sensors such as Radio Frequency Identifier (RFID) tags are widely used to infer human activities based on the movements detected in smart home environments [27].”
Background(2013) · RECERCAT (Consorci de Serveis Universitaris de Catalunya) · Cited by 1,959
Introducing a New Benchmarked Dataset for Activity Monitoring
Reiss, A., & Stricker, D. (2012) · 2012 16th International Symposium on Wearable Computers · doi:10.1109/iswc.2012.13 · Cited by 1,456 · cited 1×
“Previous work in the HAR literature empirically adopted 5.12 s-long window size [35,39].”
InfluentialThe Opportunity challenge: A benchmark database for on-body sensor-based activity recognition
Chavarriaga, R., Sagha, H., Calatroni, A., Digumarti, S. T., Tröster, G., Millán, J. D. R., & Roggen, D. (2013) · Pattern Recognition Letters · doi:10.1016/j.patrec.2012.12.014 · Cited by 742 · cited 1×
“Human activity recognition has been investigated using various sensor modalities [26].”
BackgroundUm, T. T., Pfister, F. M. J., Pichler, D., Endo, S., Lang, M., Hirche, S., Fietzek, U., & Kulić, D. (2017) · Proceedings of the 19th ACM International Conference on Multimodal Interaction · doi:10.1145/3136755.3136817 · Cited by 729 · cited 1×
“We apply the jittering method to simulate additive sensor noise using random parameters as described in [47] for label-preserving augmentation.”
MethodUnobtrusive Sensing and Wearable Devices for Health Informatics
Zheng, Y.-L., Ding, X.-R., Poon, C. C. Y., Lo, B. P. L., Zhang, H., Zhou, X.-L., Yang, G.-Z., Zhao, N., & Zhang, Y.-T. (2014) · IEEE Transactions on Biomedical Engineering · doi:10.1109/tbme.2014.2309951 · Cited by 722
Human Activity Recognition Using Wearable Sensors by Deep Convolutional Neural Networks
Jiang, W., & Yin, Z. (2015) · Proceedings of the 23rd ACM international conference on Multimedia · doi:10.1145/2733373.2806333 · Cited by 676 · cited 2×
“In this paper, we adopt a deep neural network architecture to recognize human activity from raw data input, which has shown promising results when adopted for interpreting human activities without complex data pre-processing for feature extraction [21–23].”
Method
Cited by
Lee, L.-H., Braud, T., Zhou, P. Y., Wang, L., Xu, D., Lin, Z., Kumar, A., Bermejo, C., & Hui, P. (2024) · Foundations and Trends® in Human-Computer Interaction · doi:10.1561/1100000095 · Cited by 1,082
Lee, L.-H., Braud, T., Zhou, P., Wang, L., Xu, D., Lin, Z., Kumar, A., Bermejo, C., & Hui, P. (2021) · arXiv · doi:10.48550/arxiv.2110.05352 · Cited by 1,088
Ali, F., El-Sappagh, S., Islam, S. M. R., Kwak, D., Ali, A., Imran, M., & Kwak, K.-S. (2020) · Information Fusion · doi:10.1016/j.inffus.2020.06.008 · Cited by 818
Ramanujam, E., Perumal, T., & Padmavathi, S. (2021) · IEEE Sensors Journal · doi:10.1109/jsen.2021.3069927 · Cited by 455
“Chung et al. [45] have performed a pilot study with 15 participants about the on-body sensor positioning system.”
BackgroundDemrozi, F., Pravadelli, G., Bihorac, A., & Rashidi, P. (2020) · IEEE Access · doi:10.1109/access.2020.3037715 · Cited by 368
“The second most used model was the Long Short-TermMemory (LSTM) model, which was used in 17 papers [7], [83], [89], [102], [107], [112], [125], [130], [137], [139], [152], [153], [172],”
MethodAli, S., Abdullah, Armand, T. P. T., Athar, A., Hussain, A., Ali, M., Yaseen, M., Joo, M.-I., & Kim, H.-C. (2023) · Sensors · doi:10.3390/s23020565 · Cited by 285
Ahmed, N., Rafiq, J. I., & Islam, M. R. (2020) · Sensors · doi:10.3390/s20010317 · Cited by 230
“For instance, a recent study clearly showed that a sensor fitted on the waist was successful in identifying singular, one-dimensional activities such as walking or sitting down on a chair while it struggled to identify combinational activities like eating or driving a car [10].”
BackgroundDeep Learning on Computational-Resource-Limited Platforms: A Survey
Chen, C., Zhang, P., Zhang, H., Dai, J., Yi, Y., Zhang, H., & Zhang, Y. (2020) · Mobile Information Systems · doi:10.1155/2020/8454327 · Cited by 226
Jalal, A., Quaid, M. A. K., Tahir, S. B. U. D., & Kim, K. (2020) · Sensors · doi:10.3390/s20226670 · Cited by 121
Internet of Things (IoT) Based Activity Recognition Strategies in Smart Homes: A Review
Babangida, L., Perumal, T., Mustapha, N., & Yaakob, R. (2022) · IEEE Sensors Journal · doi:10.1109/jsen.2022.3161797 · Cited by 149
A Comprehensive Review on Deep Learning-Based Data Fusion
Hussain, M., O’Nils, M., Lundgren, J., & Mousavirad, S. J. (2024) · IEEE Access · doi:10.1109/access.2024.3508271 · Cited by 139
Behavioral and Physiological Signals-Based Deep Multimodal Approach for Mobile Emotion Recognition
Yang, K., Wang, C., Gu, Y., Sarsenbayeva, Z., Tag, B., Dingler, T., Wadley, G., & Gonçalves, J. (2021) · IEEE Transactions on Affective Computing · doi:10.1109/taffc.2021.3100868 · Cited by 135
“resolution and an appropriate viewing angle [15].”
MethodKoşar, E., & Barshan, B. (2023) · Engineering Applications of Artificial Intelligence · doi:10.1016/j.engappai.2023.106529 · Cited by 118
Machine Learning and AI Technologies for Smart Wearables
Seng, K. P., Ang, L.-M., Peter, E., & Mmonyi, A. (2023) · Electronics · doi:10.3390/electronics12071509 · Cited by 90
Robust triboelectric information‐mat enhanced by multi‐modality deep learning for smart home
Yang, Y., Shi, Q., Zhang, Z., Shan, X., Salam, B., & Lee, C. (2022) · InfoMat · doi:10.1002/inf2.12360 · Cited by 84
Celik, Y., Stuart, S., Woo, W., Sejdic, E., & Godfrey, A. (2022) · Information Fusion · doi:10.1016/j.inffus.2021.09.016 · Cited by 83
Wearable Assistive Robotics: A Perspective on Current Challenges and Future Trends
Martínez-Hernández, U., Metcalfe, B., Assaf, T., Jabban, L., Male, J., & Zhang, D. (2021) · Sensors · doi:10.3390/s21206751 · Cited by 90
“Figure 5 shows examples of the use of LSTM, ANN, HMM, DBN, RF and DT methods for activity recognition with different wearable sensor platforms [81,82,89,103,104].”
MethodReal-Time Human Action Recognition with a Low-Cost RGB Camera and Mobile Robot Platform
Lee, J., & Ahn, B. (2020) · Sensors · doi:10.3390/s20102886 · Cited by 86
“built a mobile device and body-worn inertial measurement unit sensors for activity data collection [6].”
BackgroundKim, Y.-W., Joa, K.-L., Jeong, H.-Y., & Lee, S. (2021) · Sensors · doi:10.3390/s21227628 · Cited by 67
“In Chung’s HAR study [21], data from a multimodal nine degrees-of-freedom IMU was used, and an ensemble model comprising a long short-term memory (LSTM) for each head modality was proposed.”
MethodSelf-citationSherratt, F., Plummer, A. R., & Iravani, P. (2021) · Sensors · doi:10.3390/s21041264 · Cited by 79
“used an ensemble voting arrangement, where each channel modality of sensor data was passed through a separate LSTM network, with a weighted voting system forming the output classification [32].”
MethodAttention based hybrid deep learning model for wearable based stress recognition
Tanwar, R., Phukan, O. C., Singh, G., Pal, P. K., & Tiwari, S. M. (2023) · Engineering Applications of Artificial Intelligence · doi:10.1016/j.engappai.2023.107391 · Cited by 69
Advanced IoT-Based Human Activity Recognition and Localization Using Deep Polynomial Neural Network
Khan, D., Alshahrani, A. S., Almjally, A., Mudawi, N. A., Algarni, A. M., Alnowaiser, K., & Jalal, A. (2024) · IEEE Access · doi:10.1109/access.2024.3420752 · Cited by 74
“The system designed in [15], recognizes everyday activities, like eating or driving, using a special kind of artificial intelligence called a long short-term memory (LSTM) network.”
BackgroundWiWeHAR: Multimodal Human Activity Recognition Using Wi-Fi and Wearable Sensing Modalities
Muaaz, M., Chelli, A., Abdelgawwad, A., Catalá, A., & Pätzold, M. (2020) · IEEE Access · doi:10.1109/access.2020.3022287 · Cited by 78
“In [36], an ensemble learning technique was used to combine the results of individual deep learning classifiers that were trained and evaluated using the data collected with multiple wearable inertial sensors.”
BackgroundMethodImproving Human Activity Recognition Performance by Data Fusion and Feature Engineering
Chen, J., Sun, Y., & Sun, S. (2021) · Sensors · doi:10.3390/s21030692 · Cited by 66
“976, respectively), which is similar with the result in [17].”
BackgroundResultInfluentialYe, X., Sakurai, K., Nair, N. C., & Wang, K. I. (2024) · Sensors · doi:10.3390/s24247975 · Cited by 68
“With the same stacking ensemble technique in [38], Chung et al. [21] extended the meta-learner to the voting strategy and compare it with the stacking method.”
BackgroundMethodMahmud, T., Sazzad Sayyed, A. Q. M., Fattah, S. A., & Kung, S.-Y. (2021) · IEEE Sensors Journal · doi:10.1109/jsen.2020.3015781 · Cited by 58
“[18], long short term memory (LSTM) network [19], hybrid CNN-LSTM network [20], and a more complicated LSTMCNN-LSTM based hierarchical network [21].”
BackgroundOn the Challenges and Potential of Using Barometric Sensors to Track Human Activity
Manivannan, A., Chin, W. C. B., Barrat, A., & Bouffanais, R. (2020) · Sensors · doi:10.3390/s20236786 · Cited by 63
“[13] recorded ground truth by unobtrusively following the subjects one at a time.”
BackgroundDeep learning and transfer learning for device-free human activity recognition: A survey
Yang, J., Xu, Y., Cao, H., Zou, H., & Xie, L. (2022) · Journal of Automation and Intelligence · doi:10.1016/j.jai.2022.100007 · Cited by 70
An ensemble deep learning model for human activity analysis using wearable sensory data
Batool, S., Khan, M. H., & Farid, M. S. (2024) · Applied Soft Computing · doi:10.1016/j.asoc.2024.111599 · Cited by 55
Multimodal music emotion recognition in Indonesian songs based on CNN-LSTM, XLNet transformers
Sams, A. S., & Zahra, A. (2022) · Bulletin of Electrical Engineering and Informatics · doi:10.11591/eei.v12i1.4231 · Cited by 57
Computer Vision-based Survey on Human Activity Recognition System, Challenges and Applications
Abdul Manaf, F., & Singh, S. (2021) · doi:10.1109/icspc51351.2021.9451736 · Cited by 46
“Chung et al. [15], in 2019 presented a systematic research on the location and data collection of on-body sensors.”
BackgroundSuglia, V., Palazzo, L., Bevilacqua, V., Passantino, A., Pagano, G., & D’Addio, G. (2024) · Sensors · doi:10.3390/s24072199 · Cited by 47
“Each recording session returns signals from the accelerometer, gyroscope, and magnetometer, whose combination has already proven to outperform a subset of IMU components in related works about HAR [53].”
MethodDepth Sensors-Based Action Recognition Using a Modified K-Ary Entropy Classifier
Batool, M., Alotaibi, S. S., Alatiyyah, M. H., Alnowaiser, K., Aljuaid, H., Jalal, A., & Park, J. (2023) · IEEE Access · doi:10.1109/access.2023.3260403 · Cited by 44
“Many BGS methods have previously been provided, such as temporal medians of previous n frames [33], statistical approaches [34], self-organizing maps [35], [36], [37], and numerous features-based methods [38], [39], [40].”
MethodYang, S., Gao, Y., Zhu, Y. H., Zhang, L., Xie, Q., Lu, X., Wang, F., & Zhang, Z. (2025) · Scientific Reports · doi:10.1038/s41598-025-01228-3 · Cited by 53
Al-Amin, M., Qin, R., Moniruzzaman, M., Yin, Z., Tao, W., & Leu, M. C. (2021) · Journal of Intelligent Manufacturing · doi:10.1007/s10845-021-01815-x · Cited by 47
Real‐world multimodal lifelog dataset for human behavior study
Chung, S., Jeong, C. Y., Lim, J., Lim, J., Noh, K. J., Kim, G., & Jeong, H. (2021) · ETRI Journal · doi:10.4218/etrij.2020-0446 · Cited by 48
“Many publicly available activity datasets [1–5] contain behavioral data measured using an inertial measurement unit (IMU) and target human activity recognition (HAR) through sensor data analysis [6,7].”
BackgroundSelf-citationZero-Shot Human Activity Recognition Using Non-Visual Sensors
Machot, F. A., Elkobaisi, M. R., & Kyamakya, K. (2020) · Sensors · doi:10.3390/s20030825 · Cited by 52
“Furthermore, activity recognition has been widely reported in many fields using sensor modalities, including ambient sensors [35], wearable sensors [36], smart phones [34], and smart watches [37].”
BackgroundAñazco, E. V., Han, S. J., Kim, K., Lopez, P. R., Kim, T.-S., & Lee, S. (2021) · Sensors · doi:10.3390/s21041404 · Cited by 45
Arani, M. S. A., Costa, D. E., & Shihab, E. (2021) · Sensors · doi:10.3390/s21216997 · Cited by 44
“applied the sensor fusion approach by placing eight IMU sensors on different body parts of five right-handed individuals [1].”
BackgroundMethodInfluentialMekruksavanich, S., & Jitpattanakul, A. (2023) · Computers · doi:10.3390/computers12070141 · Cited by 42
Robust Human Interaction Recognition Using Extended Kalman Filter
Bukht, T. F. N., Alazeb, A., Mudawi, N. A., Alabdullah, B. I., Alnowaiser, K., Jalal, A., & Liu, H. (2024) · Computers, materials & continua/Computers, materials & continua (Print) · doi:10.32604/cmc.2024.053547 · Cited by 60
Robust Inertial Motion Tracking through Deep Sensor Fusion across Smart Earbuds and Smartphone
Gong, J., Zhang, X., Huang, Y., Ren, J., & Zhang, Y. (2021) · Proceedings of the ACM on Interactive Mobile Wearable and Ubiquitous Technologies · doi:10.1145/3463517 · Cited by 39
“Sensor fusion can also be applied on IMU and other mobile sensors to enhance the system performance [8, 23].”
BackgroundSafeDriving: An Effective Abnormal Driving Behavior Detection System Based on EMG Signals
Fan, Y., Gu, F., Wang, J., Wang, J., Lu, K., & Niu, J. (2021) · IEEE Internet of Things Journal · doi:10.1109/jiot.2021.3135512 · Cited by 39
“[32] leveraged eight body-worn IMUs with LSTM to detect driver activities.”
BackgroundHuman activity recognition of children with wearable devices using LightGBM machine learning
Csizmadia, G., Liszkai-Peres, K., Ferdinandy, B., Miklósi, Á., & Konok, V. (2022) · Scientific Reports · doi:10.1038/s41598-022-09521-1 · Cited by 44
Sensor-data augmentation for human activity recognition with time-warping and data masking
Jeong, C. Y., Shin, H. C., & Kim, M. (2021) · Multimedia Tools and Applications · doi:10.1007/s11042-021-10600-0 · Cited by 38
“Because deep-learning methods have shown excellent performance in various fields (e.g., image recognition and sound-event classification), several such applications have been proposed for HAR tasks [1, 2, 4, 9–11, 14, 20, 22, 37].”
BackgroundMethodResultInfluentialContrastive Accelerometer–Gyroscope Embedding Model for Human Activity Recognition
Koo, I., Park, Y., Jeong, M., & Kim, C. (2022) · IEEE Sensors Journal · doi:10.1109/jsen.2022.3222825 · Cited by 39
“Body-worn inertial sensors directly capture the physical motions and thus provide fruitful information for distinguishing ongoing activities [9], [10].”
BackgroundBringing it all together: Wearable data fusion
Çelik, Y., & Godfrey, A. (2023) · npj Digital Medicine · doi:10.1038/s41746-023-00897-6 · Cited by 40
Internet of Things Centric-Based Multiactivity Recognition in Smart Home Environment
Perumal, T., Ramanujam, E., Suman, S., Sharma, A., & Singhal, H. (2022) · IEEE Internet of Things Journal · doi:10.1109/jiot.2022.3209970 · Cited by 36
“Each system has its way of data collection, using wearable devices/smartphones involving different numbers of subjects and activities (static or dynamic) in the controlled lab environment [19], [20].”
BackgroundMethodInfluentialAbdulkareem, K. H., Mutlag, A. A., Dinar, A. M., Frnda, J., Mohammed, M. A., Zayr, F. H., Lakhan, A. R., Kadry, S., Khattak, H. A., & Nedoma, J. (2022) · Computational Intelligence and Neuroscience · doi:10.1155/2022/5012962 · Cited by 38
RetractedLee, S., Lim, Y., & Lim, K. (2023) · Information Fusion · doi:10.1016/j.inffus.2023.102153 · Cited by 38
Haresamudram, H., Tang, C. I., Suh, S., Lukowicz, P., & Plötz, T. (2025) · Proceedings of the ACM on Interactive Mobile Wearable and Ubiquitous Technologies · doi:10.1145/3729467 · Cited by 33
“However, leveraging the temporal nature of accelerometer signals allows for the application of augmentation methods grounded in signal processing [29, 32, 95, 125, 134, 171, 184].”
Human Activity Recognition: From Sensors to Applications
Fereidoonian, F., Firouzi, F., & Farahani, B. (2020) · IEEE International Conference on Omni-layer Intelligent Systems (COINS) · doi:10.1109/coins49042.2020.9191417 · Cited by 34
“…will be presented below: a) Deep Neural Network (DNN): DNNs are neural networks with more hidden layers and have better learning performance for large data [35]. b) Convolutional Neural Network (CNN): CNN contains several hidden coherent layers that apply convolutional operations on their input.”
BackgroundWhat Lies Beneath One’s Feet? Terrain Classification Using Inertial Data of Human Walk
Hashmi, M. Z. U. H., Riaz, Q., Hussain, M., & Shahzad, M. (2019) · Applied Sciences · doi:10.3390/app9153099 · Cited by 34
“Recent studies have shown that body locations such as chest [35], arm [36], waist and lower back [36–38], and ankle [24,38] are appropriate for human activity recognition and soft bio-metrics estimation.”
BackgroundLabel-preserving data augmentation for mobile sensor data
Kim, M., & Jeong, C. Y. (2021) · Multidimensional Systems and Signal Processing · doi:10.1007/s11045-020-00731-2 · Cited by 32
“Weemployedsixaugmentationmethods (randomnoise,randompermutation,scaling,rotation,stretching,andrandomsampling)by generallyfollowingthedescriptionsinpreviousresearchpublications(Ohashietal.2017; Umetal.2017;Chungetal.2019).”
BackgroundMethodInfluentialA Smartphone Lightweight Method for Human Activity Recognition Based on Information Theory
Bragança, H. L. D. S., Colonna, J. G., Lima, W. S., & Souto, E. (2020) · Sensors · doi:10.3390/s20071856 · Cited by 32
“[16] develop a Long Short-Term Memory (LSTM) network framework to support training of a deep learning model on human activity data.”
BackgroundTheodorou, P., Tsiligkos, K., & Μηλιώνης, Α. (2023) · Sensors · doi:10.3390/s23125411 · Cited by 32
Human Action Recognition Using CNN-SVM Model
Athavale, V. A., Gupta, S. C., Kumar, D., & Savita, S. (2021) · Advances in science and technology · doi:10.4028/www.scientific.net/ast.105.282 · Cited by 36
“The previously used schemes are Hybrid CNN with LSTM [1], Deep CNN [2], Grid search optimization based CNN [3], PCA and ECDF [4], Deep learning methods [5], Spatio-temporal CNN with SVM [6], DBN with HMM [7], HMM, RBM and modified machine learning methods presented by the researchers.”
BackgroundMethodInfluentialIoT-Based Multisensors Fusion for Activity Recognition via Key Features and Hybrid Transfer Learning
Jalal, A., Khan, D., Sadiq, T., Alotaibi, M., Alotaibi, S. R., Aljuaid, H., & Rahman, H. (2024) · IEEE Access · doi:10.1109/access.2024.3524431 · Cited by 28
“In [18], a method for identifying everyday activities based on long short-term memory (LSTM) networks is introduced.”
Karim, M. F. A., Khalid, S., Lee, S., Almutairi, S. S., Namoun, A., & Abohashrh, M. (2025) · IEEE Access · doi:10.1109/access.2025.3590073 · Cited by 36
Context-Aware Edge-Based AI Models for Wireless Sensor Networks—An Overview
Al-Saedi, A. A., Boeva, V., Casalicchio, E., & Exner, P. (2022) · Sensors · doi:10.3390/s22155544 · Cited by 33
Choudhury, N. A., & Soni, B. (2023) · IEEE Sensors Journal · doi:10.1109/jsen.2023.3312478 · Cited by 27
“Chung et al. [20] developed an IMU-based LSTM model for HAR.”
MethodYu, Z., Zahid, A., Taha, A., Taylor, W., Kernec, J. L., Heidari, H., Imran, M. A., & Abbasi, Q. H. (2022) · IEEE Internet of Things Journal · doi:10.1109/jiot.2022.3204581 · Cited by 30
AutoAugHAR: Automated Data Augmentation for Sensor-based Human Activity Recognition
Zhou, Y., Zhao, H., Huang, Y., Röddiger, T., Kurnaz, M., Riedel, T., & Beigl, M. (2024) · Proceedings of the ACM on Interactive, Mobile, Wearable and Ubiquitous Technologies · doi:10.1145/3659589 · Cited by 25
“Traditional DA techniques for HAR tasks typically involve random signal transformations such as adding noise, window slicing, magnitude scaling, and random warping [3, 13, 32], among others.”
BackgroundContact Pattern Recognition of a Flexible Tactile Sensor Based on the CNN-LSTM Fusion Algorithm
Song, Y., Li, M., Wang, F., & Lv, S. (2022) · Micromachines · doi:10.3390/mi13071053 · Cited by 26
“With the gated state mechanism of the LC, the problems of gradient disappearance and gradient explosion that occur in the original RNN in the process of processing long-sequence signal training were solved [38].”
MethodPractical Considerations for Accuracy Evaluation in Sensor-Based Machine Learning and Deep Learning
Hammad, I., & El‐Sankary, K. (2019) · Sensors · doi:10.3390/s19163491 · Cited by 27
Jeong, C. Y., & Kim, M. (2019) · Sensors · doi:10.3390/s19173688 · Cited by 26
“Various DNNs such as convolutional neural networks (CNNs) [4–8], recurrent neural networks (RNNs) [9–11], and restricted Boltzmann machines (RBMs) [1] have been used to classify human activities and have shown impressive results in terms of their accuracy.”
BackgroundMethodInfluentialHuman activity recognition from UAV videos using a novel DMLC-CNN model
Sinha, K. P., & Kumar, P. (2023) · Image and Vision Computing · doi:10.1016/j.imavis.2023.104674 · Cited by 24
Chaurasia, S. K., & Reddy, S. R. N. (2021) · Multimedia Tools and Applications · doi:10.1007/s11042-021-11410-0 · Cited by 22
Artificial neural networks for human activity recognition using sensor based dataset
Geravesh, S., & Rupapara, V. (2022) · Multimedia Tools and Applications · doi:10.1007/s11042-022-13716-z · Cited by 24
“In a paper [5], a systematic study is performed about the data acquisition details and on-body sensor positioning for Human Activity Recognition (HAR) systems.”
BackgroundMethodInfluentialMulti-modal lifelog data fusion for improved human activity recognition: A hybrid approach
Oh, Y., & Kim, S. (2024) · Information Fusion · doi:10.1016/j.inffus.2024.102464 · Cited by 25
Flexible Multimode Sensors: Structural Design, Signal Decoupling, and Emerging Applications
Song, C., Gong, J., Yang, C., & Xu, M. X. (2025) · Advanced Materials Technologies · doi:10.1002/admt.202501368 · Cited by 23
Karuniawati, S., Putrada, A. G., & Rakhmatsyah, A. (2021) · International Symposium on Electronics and Smart Devices (ISESD) · doi:10.1109/isesd53023.2021.9501863 · Cited by 21
Zaher, M., Ghoneim, A. S., Abdelhamid, L., & Atia, A. (2024) · Computers in Biology and Medicine · doi:10.1016/j.compbiomed.2024.109399 · Cited by 22
Babel: A Scalable Pre-trained Model for Multi-Modal Sensing via Expandable Modality Alignment
Dai, S., Jiang, S., Yang, Y., Cao, T., Li, M., Banerjee, S., & Qiu, L. (2025) · ACM Conference on Embedded Networked Sensor Systems (SenSys) · doi:10.1145/3715014.3722068 · Cited by 26
“These methods automatically uncover correlations among diverse sensing modalities through supervised or self-supervised learning [11, 22, 27, 40, 44].”
Dao, T.-H., Hoang, H.-Y., Hoang, V.-N., Tran, D., & Tran, D.-N. (2022) · EAI Endorsed Transactions on Industrial Networks and Intelligent Systems · doi:10.4108/eetinis.v9i4.2571 · Cited by 22
Human Activity Recognition Based on Two-Channel Residual–GRU–ECA Module with Two Types of Sensors
Wang, X., & Shang, J. (2023) · Electronics · doi:10.3390/electronics12071622 · Cited by 23
Hussain, A., Ali, S., Joo, M.-I., & Kim, H. (2023) · IEEE Sensors Journal · doi:10.1109/jsen.2023.3324665 · Cited by 23
“In recent years, we have observed that the activities of humans [12], [13] and some animals, for example, dogs [14], sheep [15], goats, and horses [16] have been investigated thoroughly; however, there is no research work on cat activity using three kinds of sensors and long short-term memory…”
BackgroundImproved Activity Recognition Combining Inertial Motion Sensors and Electroencephalogram Signals
Graña, M., Aguilar-Moreno, M., de Lope, J., Araquistain, I. B., & Garmendia, X. (2020) · International Journal of Neural Systems · doi:10.1142/s0129065720500537 · Cited by 20
Wearable Sensors for Precise Exercise Monitoring and Analysis
Su, B., Li, F., & Su, B. (2025) · Biosensors · doi:10.3390/bios15110734 · Cited by 22
“On the other hand, the deep integration of multimodal data fusion algorithms with artificial intelligence (AI) and machine learning (ML) frameworks will transform wearable systems from passive data collectors into active decision-support platforms [81,82].”
Javeed, M., Mudawi, N. A., Alabduallah, B. I., Jalal, A., & Kim, W. (2023) · Sensors · doi:10.3390/s23104716 · Cited by 18
“The following subsections will explain the three techniques in detail.”
Guo, K., Zhou, H., Tian, Y., Zhou, W., Ji, Y., & Li, X. (2022) · IEEE Conference on Computer Communications (INFOCOM) · doi:10.1109/infocom48880.2022.9796879 · Cited by 18
Advancing Activity Recognition With Multimodal Fusion and Transformer Techniques
Aidarova, S., Nurmakhan, T., Myrzakhan, R., Fazli, S., & Yazıcı, A. (2025) · IEEE Sensors Journal · doi:10.1109/jsen.2025.3555663 · Cited by 18
“For instance, Chung et al. [19] employed the LSTM model to evaluate the performance of testbed environments that were created for different simple activities using eight wearable sensors.”
Optimal Sensor Placement and Multimodal Fusion for Human Activity Recognition in Agricultural Tasks
Benos, L. T., Tsaopoulos, D. E., Tagarakis, A. C., Katerıs, D., & Bochtis, D. (2024) · Applied Sciences · doi:10.3390/app14188520 · Cited by 18
Inertial Data-Based AI Approaches for ADL and Fall Recognition
Martins, L. M., Ribeiro, N. F., Soares, F., & Santos, C. P. (2022) · Sensors · doi:10.3390/s22114028 · Cited by 19
“As mentioned in the literature, LSTM has a more suitable architecture for classifying sequential data [3,22].”
BackgroundA SE-DenseNet-LSTM model for locomotion mode recognition in lower limb exoskeleton
Tang, J., Zhao, L., Wu, M., Jiang, Z., Cao, J., & Bao, X. (2024) · PeerJ Computer Science · doi:10.7717/peerj-cs.1881 · Cited by 16
“Chung et al. (2019) developed an LSTM network to train multimodal physical sensor data with a recognition rate of 92.18%.”
BackgroundInfluentialAhmad, A. Y. A. B., Alzubi, J. A. A., James, S., Nyangaresi, V. O., Kutralakani, C., & Krishnan, A. (2024) · Computers, materials & continua/Computers, materials & continua (Print) · doi:10.32604/cmc.2024.052771 · Cited by 44
Biosensor-Based Multimodal Deep Human Locomotion Decoding via Internet of Healthcare Things
Javeed, M., Abdelhaq, M., Algarni, A. M., & Jalal, A. (2023) · Micromachines · doi:10.3390/mi14122204 · Cited by 16
“A long short-term memory (LSTM) network-based system is proposed in [59].”
BackgroundHuman Activity Recognition Machine With an Anchor-Based Loss Function
Jin, L., Wang, X., Chu, J., & He, M. (2021) · IEEE Sensors Journal · doi:10.1109/jsen.2021.3130761 · Cited by 16
Fallahdizcheh, A., & Wang, C. (2022) · Reliability Engineering & System Safety · doi:10.1016/j.ress.2022.108448 · Cited by 16
IMU-based Human Activity Recognition using Machine Learning and Deep Learning models
AlKharji, S., Alteneiji, A., & Poon, K. (2023) · International Conference on Signal Processing and Information Security (ICSPIS) · doi:10.1109/icspis60075.2023.10343567 · Cited by 14
“The study conducted by researchers in [8] utilized multiple wearable IMU sensors attached to their body.”
BackgroundHuman Activity Recognition: A Dynamic Inductive Bias Selection Perspective
Hamidi, M., & Osmani, A. (2021) · Sensors · doi:10.3390/s21217278 · Cited by 17
A Stable and Durable Triboelectric Nanogenerator for Speed Skating Land Training Monitoring
Lu, Z., Xie, Z., Zhu, Y., Jia, C., Zhang, Y., Yang, J., Zhou, J., Sun, F., & Mao, Y. (2022) · Electronics · doi:10.3390/electronics11223717 · Cited by 14
The Power of ANN-Random Forest Algorithm in Human Activities Recognition Using IMU Data
Nia, N. G., Amiri, A., Nasab, A., Kaplanoğlu, E., & Liang, Y. (2023) · IEEE-EMBS International Conference on Biomedical and Health Informatics (BHI ...) · doi:10.1109/bhi58575.2023.10313507 · Cited by 14
“While activity recognition has been studied extensively in computer vision, it is limited to scenarios that have pre-installed cameras with sufficient resolution and a guaranteed angle of view [3, 4].”
BackgroundHuman Activity Recognition Based on Deep Learning Regardless of Sensor Orientation
He, Z., Sun, Y., & Zhang, Z. (2024) · Applied Sciences · doi:10.3390/app14093637 · Cited by 16
Teikari, P., & Pietrusz, A. (2021) · SportRxiv (OSF Preprints) · doi:10.31236/osf.io/w734a · Cited by 16
Sign Language Recognition With Self-Learning Fusion Model
Vu, H. N., Hoang, T., Tran, C., & Pham, C. (2023) · IEEE Sensors Journal · doi:10.1109/jsen.2023.3314728 · Cited by 13
“Therefore, in many cases, accelerometers are used in combination with other potential sensors, including gyroscopes [38], mag-netometers [39], and heart rate sensors [40] to increase the performance of the system.”
BackgroundHuman activity recognition using binary sensors: A systematic review
Khan, M. T. R., Ever, E., Eraslan, S., & Yeşilada, Y. (2024) · Information Fusion · doi:10.1016/j.inffus.2024.102731 · Cited by 13
Encoding human activities using multimodal wearable sensory data
Khan, M. H., Shafiq, H., Farid, M. S., & Grzegorzek, M. (2024) · Expert Systems with Applications · doi:10.1016/j.eswa.2024.125564 · Cited by 13
Neto, S. R. D. A., Santos, G. L., Rocha, É. D. S., Bendechache, M., Rosati, P., Lynn, T., & Endo, P. T. (2020) · Studies in systems, decision and control · doi:10.1007/978-3-030-38748-8_2 · Cited by 15
“[49] also used an LSTM network to detect daily human activities including eating and driving activity.”
MethodActivity-Aware Vital Sign Monitoring Based on a Multi-Agent Architecture
Ivaşcu, T., & Negru, V. (2021) · Sensors · doi:10.3390/s21124181 · Cited by 16
“…research work on human physical activities, different sensing modalities were considered, such as accelerometers, gyroscopes, and magnetometers; the optimal sensor position; the sampling rate; feature extraction and selection; and even using a single sensor or aggregating different sources [30–34].”
Background
Metadata
- Authors
- Chung, S., Lim, J., Noh, K. J., Kim, G., & Jeong, H.
- Affiliations
- Electronics and Telecommunications Research Institute (KR)
- Corresponding author
- Chung, Seungeun
- Venue
- Sensors
- Publisher
- MDPI AG
- Published
- 2019-04-10
- Volume
- 19
- Issue
- 7
- Pages
- 1716
- ISSN
- 1424-8220 (ISSN-L)
- PMC
- PMC6479605
- OpenAlex
- W2940096514
- Cited by
- 215
- References
- 48
- Citations by year
- 2026: 22 · 2025: 33 · 2024: 35 · 2023: 36 · 2022: 31 · 2021: 32 · 2020: 21 · 2019: 5
- FWCI
- 9.94
- Type
- journal article
- Language
- en
- Open access
- gold
- dx.doi.org
- Licence
- Locations
- Sensors (publishedVersion, cc-by)
- PubMed Central (publishedVersion, cc-by)
- PubMed (publishedVersion)
- DOAJ (DOAJ: Directory of Open Access Journals) (submittedVersion, cc-by-sa)
- Funders
- Electronics and Telecommunications Research Institute
- Topics
- Physical Sciences › Computer Science › Computer Vision and Pattern Recognition › Context-Aware Activity Recognition Systems
- Physical Sciences › Engineering › Biomedical Engineering › Gait Recognition and Analysis
- Physical Sciences › Computer Science › Computer Vision and Pattern Recognition › Human Pose and Action Recognition
- Keywords
- human activity recognition, inertial measurement unit, multimodal sensor fusion, ensemble learning, LSTM networks, activities of daily living, sampling frequency, sensor placement, eating
- MeSH terms
- Wearable Electronic Devices, Deep Learning, Standing Position, Activities of Daily Living, Algorithms, Automobile Driving, Humans, Human Activities, Monitoring, Physiologic, Biosensing Techniques, Walking, Multimodal Imaging
About these checks
Registry, retraction, Cites and statistics results are computed, not judged, with one exception: a printed reference that no index lists is read once by a model before it counts as a citation error. Claims are extracted by a model and kept only when their quote appears verbatim in the text; each cited source is then checked, with a model’s help, for whether it says what the claim relies on. Those verdicts can be wrong — read the claim’s quote and the cited source before relying on one.
The claim verdicts this report counts are experimental: their accuracy is not yet measured.
A language model drew the claims from the paper on 2026-10-05, under version 3 of the claim definition (model deepseek-v4.1-flash, prompt extract-v3).
A second model labelled each claim on 2026-10-05 (model jev-1.13-20260917, definition revision gold-guideline-v0.2).
Cited sources are checked with a language model’s help (gpt-6-sol and qwen3.8-omni-flash).
Statistics and arithmetic are recomputed, not judged.
Confidence bands are shown only for fields calibrated on our annotated test set. None is calibrated yet, so no band is shown.
What counts as a claim ›How we measure confidence ›How we check this ›
Are you an author, or do you see a problem with this page? Request a review
Data sources
Bibliographic data: Semantic Scholar, OpenAlex, Crossref.
Contains information from the Semantic Scholar Academic Graph Datasets, made available under the ODC Attribution License (ODC-BY 1.0).
Semantic Scholar’s data is described in: Kinney, R., et al. (2023). The Semantic Scholar Open Data Platform. arXiv:2301.10140.
