

The DOI matches its Crossref record; 44 of the 44 references it cites were found in a registry or an index.
Correlation-Based Anomaly Detection in Industrial Control Systems
Open accessAbstract
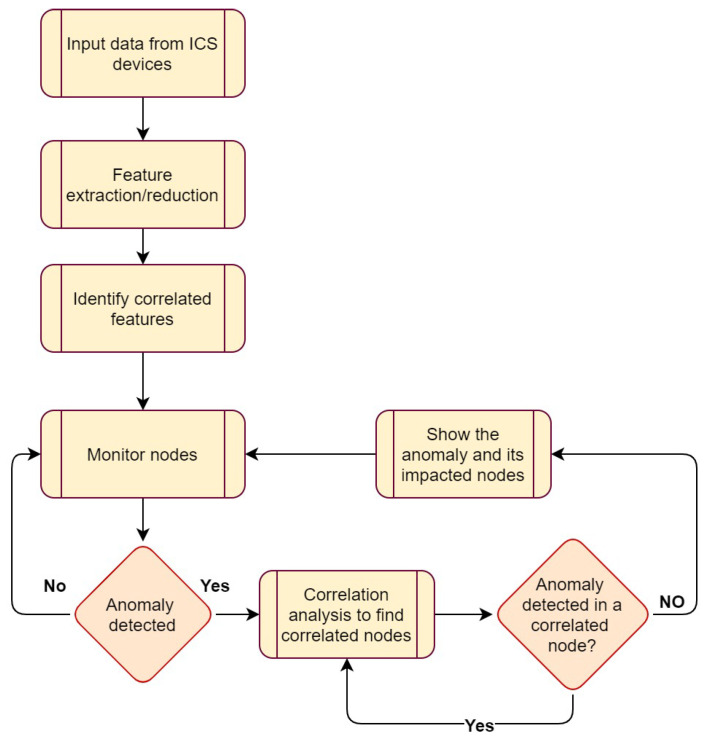
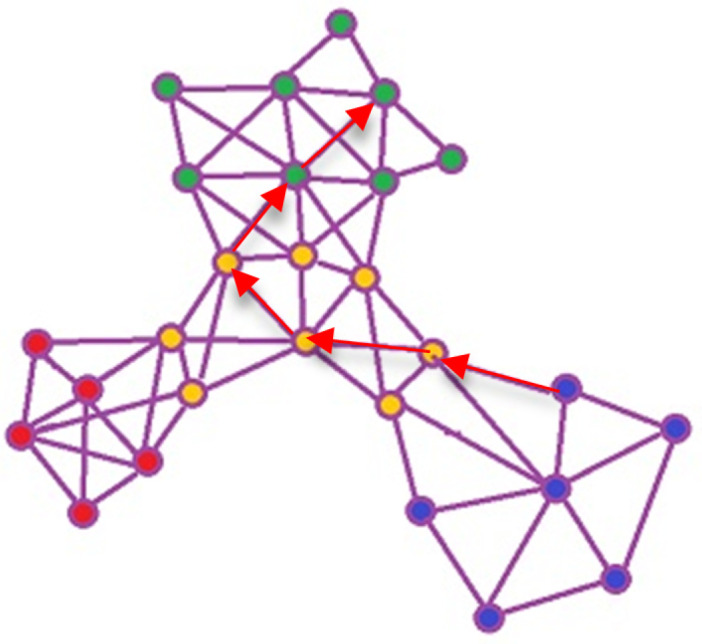
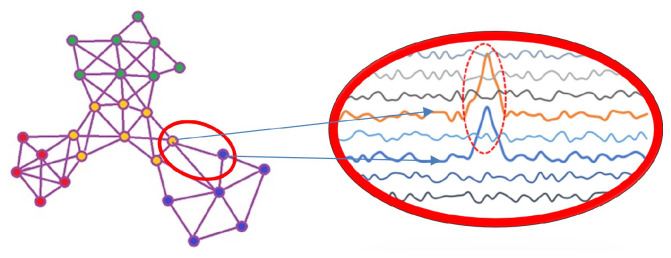
Industrial Control Systems (ICSs) were initially designed to be operated in an isolated network. However, recently, ICSs have been increasingly connected to the Internet to expand their capability, such as remote management. This interconnectivity of ICSs exposes them to cyber-attacks. At the same time, cyber-attacks in ICS networks are different compared to traditional Information Technology (IT) networks. Cyber attacks on ICSs usually involve a sequence of actions and a multitude of devices. However, current anomaly detection systems only focus on local analysis, which misses the correlation between devices and the progress of attacks over time. As a consequence, they lack an effective way to detect attacks at an entire network scale and predict possible future actions of an attack, which is of significant interest to security analysts to identify the weaknesses of their network and prevent similar attacks in the future. To address these two key issues, this paper presents a system-wide anomaly detection solution using recurrent neural networks combined with correlation analysis techniques. The proposed solution has a two-layer analysis. The first layer targets attack detection, and the second layer analyses the detected attack to predict the next possible attack actions. The main contribution of this paper is the proof of the concept implementation using two real-world ICS datasets, SWaT and Power System Attack. Moreover, we show that the proposed solution effectively detects anomalies and attacks on the scale of the entire ICS network.
Overview
The claims and statistics of this paper haven’t been checked yet.
Free: it reads the open-access text and checks the first 5 claims that cite a source we can check. Create a free account to check every claim.
Integrity signals
Registry
Cites
Statistics
Figures

Verification
Claims the paper makes
The claims and statistics of this paper haven’t been checked yet.
Free: it reads the open-access text and checks the first 5 claims that cite a source we can check. Create a free account to check every claim.
Claims other papers make about this one
Each is checked against this paper’s own text: does it say what the citing paper says it does?
The source backs part of the claim, not all of it — or backs it for a different population, condition or comparison.
In the citing paper
“Layer 3 continuous statistical baselines distinguishing cyber-physical attacks from legitimate process variances [20].”
From Manufacturing Cybersecurity for SMEs: Implementing Zero Trust in Legacy Industrial Environments (2026) · cites this paper as [20]
Experimental — accuracy not yet measuredThe cited source says what the claim attributes to it.
In the citing paper
“Correlation-based detection analyzed device relationships [20].”
From Manufacturing Cybersecurity for SMEs: Implementing Zero Trust in Legacy Industrial Environments (2026) · cites this paper as [20]
Self-check
Percentages, sums and reported differences re-computed from the paper’s own numbers.
The self-check needs the paper’s full text.
Citations
Cites
A Review of Recurrent Neural Networks: LSTM Cells and Network Architectures
Yu, Y., Si, X., Hu, C., & Zhang, J. (2019) · Neural Computation · doi:10.1162/neco_a_01199 · Cited by 5,591 · cited 2×
“For example, the data at the current time point are likely to be related to a previous time point or a time point in the long past, which can be referred to as short-term and long-term time dependency [32].”
BackgroundPearson Correlation Coefficient
Benesty, J., Chen, J., Huang, Y., & Cohen, I. (2009) · Springer Topics in Signal Processing · doi:10.1007/978-3-642-00296-0_5 · Cited by 3,059
Deep Learning for Anomaly Detection: A Review
Pang, G., Shen, C., Cao, L., & Hengel, A. V. D. (2022) · ACM Computing Surveys · doi:10.1145/3439950 · Cited by 2,837
Deep Learning for Anomaly Detection: A Review
Pang, G., Shen, C., Cao, L., et al. (2020) · Singapore Management University Institutional Knowledge (InK) (Singapore Management University) · doi:10.48550/arxiv.2007.02500 · Cited by 1,718
Deep Learning for Anomaly Detection: A Survey
Chalapathy, R., & Chawla, S. (2019) · arXiv · doi:10.48550/arxiv.1901.03407 · Cited by 1,240
Secure integration of IoT and Cloud Computing
Stergiou, C., Psannis, K. E., Kim, B.-G., & Gupta, B. (2018) · Future Generation Computer Systems · doi:10.1016/j.future.2016.11.031 · Cited by 1,094
Alshamrani, A., Myneni, S., Chowdhary, A., & Huang, D. (2019) · IEEE Communications Surveys & Tutorials · doi:10.1109/comst.2019.2891891 · Cited by 656
Robust Deep Learning Methods for Anomaly Detection
Chalapathy, R., Khoa, N. L. D., & Chawla, S. (2020) · Proceedings of the 26th ACM SIGKDD International Conference on Knowledge Discovery & Data Mining · doi:10.1145/3394486.3406704 · Cited by 502
Classification with correlated features: unreliability of feature ranking and solutions
Toloşi, L., & Lengauer, T. (2011) · Bioinformatics · doi:10.1093/bioinformatics/btr300 · Cited by 445
Cybersecurity for industrial control systems: A survey
Bhamare, D., Zolanvari, M., Erbad, A., Jain, R., Khan, K., & Meskin, N. (2020) · Computers & Security · doi:10.1016/j.cose.2019.101677 · Cited by 394 · cited 15×
“A common modern architecture of ICSs is comprised of two interconnected subsystems, Operational Technology (OT) and Information Technology (IT) [12].”
BackgroundInfluential
Research works printed but not linked: 3
- Hahn, A. (2016). Cyber-Security of SCADA and Other Industrial Control Systems, Springer.
- Ribu Hassini, S., Gireesh Kumar, T., and Kowshik Hurshan, S. (2022). ICT Analysis and Applications, Springer.
- Benesty, J., Chen, J., Huang, Y., and Cohen, I. (2009). Noise Reduction in Speech Processing, Springer.
Cited by
Govea, J., Gaibor-Naranjo, W., & Villegas-Ch, W. E. (2024) · Systems · doi:10.3390/systems12050165 · Cited by 53
“AI tools must be integrated precisely to maintain operational stability and security, a critical aspect that Jadidi et al. [21] examined by detailing effective cybersecurity management strategies.”
BackgroundExplainable correlation-based anomaly detection for Industrial Control Systems
Birihanu, E., & Lendák, I. (2025) · Frontiers in Artificial Intelligence · doi:10.3389/frai.2024.1508821 · Cited by 25
Khan, M. A., Iqbal, N., Jamil, H., Qayyum, F., Jang, J., Khan, S., Kim, J., & Kim, D. (2023) · Future Generation Computer Systems · doi:10.1016/j.future.2023.11.036 · Cited by 22
Aslam, M. M., Silva, L. C. D., Apong, R. A. A. H. M., & Tufail, A. (2025) · Scientific Reports · doi:10.1038/s41598-025-12775-0 · Cited by 26
Pallakonda, A., Kaliyannan, K., Sumathi, R. L., Raj, R. D. A., Yanamala, R. M. R., Napoli, C., & Randieri, C. (2025) · IoT · doi:10.3390/iot6030056 · Cited by 14
“A correlation-aware LSTM architecture using Pearson correlation [16] is proposed to monitor and predict multi-stage ICS assaults; nevertheless, this approach additionally displayed deficiencies in cryptographic integration and adversarial resilience.”
Metadata
- Authors
- Jadidi, Z., Pal, S., Hussain, M., & Nguyen Thanh, K.
- Affiliations
- Griffith University (AU)
- Deakin University (AU)
- Queensland University of Technology (AU)
- School of Electrical Engineering and Robotics, Queensland University of Technology, Brisbane, QLD 4000, Australia
- Corresponding author
- Jadidi, Zahra
- Venue
- Sensors
- Publisher
- MDPI AG
- Published
- 2023-02-01
- Volume
- 23
- Issue
- 3
- Pages
- 1561
- ISSN
- 1424-8220 (ISSN-L)
- PMC
- PMC9920746
- OpenAlex
- W4318822164
- Cited by
- 35
- References
- 40
- Citations by year
- 2026: 13 · 2025: 14 · 2024: 5 · 2023: 3
- FWCI
- 3.89
- Type
- journal article
- Language
- en
- Open access
- gold
- doi.org
- Licence
- Locations
- Sensors (publishedVersion, cc-by)
- PubMed Central (publishedVersion, cc-by)
- PubMed (publishedVersion)
- DOAJ (DOAJ: Directory of Open Access Journals) (submittedVersion, cc-by-sa)
- Figshare (submittedVersion, cc-by)
- Griffith Research Online (submittedVersion, cc-by)
- Funders
- Australian Cybersecurity CRC
- Topics
- Physical Sciences › Computer Science › Computer Networks and Communications › Network Security and Intrusion Detection
- Physical Sciences › Engineering › Control and Systems Engineering › Smart Grid Security and Resilience
- Physical Sciences › Computer Science › Artificial Intelligence › Anomaly Detection Techniques and Applications
- Keywords
- industrial control systems, anomaly detection, cyberattack detection, recurrent neural networks, SWaT dataset
About these checks
Registry, retraction, Cites and statistics results are computed, not judged, with one exception: a printed reference that no index lists is read once by a model before it counts as a citation error. Claims are extracted by a model and kept only when their quote appears verbatim in the text; each cited source is then checked, with a model’s help, for whether it says what the claim relies on. Those verdicts can be wrong — read the claim’s quote and the cited source before relying on one.
Statistics and arithmetic are recomputed, not judged.
Confidence bands are shown only for fields calibrated on our annotated test set. None is calibrated yet, so no band is shown.
What counts as a claim ›How we measure confidence ›How we check this ›
Are you an author, or do you see a problem with this page? Request a review
How to cite
Cite CoChat for the checks on this page, and the paper for its own findings.
- This page
- CoChat. (2026). Citation check: Correlation-Based Anomaly Detection in Industrial Control Systems. https://app.cochat.ai/papers/10.3390/s23031561
- The paper
- Jadidi, Z., Pal, S., Hussain, M., & Nguyen Thanh, K. (2023). Correlation-Based Anomaly Detection in Industrial Control Systems. Sensors. https://doi.org/10.3390/s23031561
Data sources
Bibliographic data: Semantic Scholar, OpenAlex, Crossref.
Contains information from the Semantic Scholar Academic Graph Datasets, made available under the ODC Attribution License (ODC-BY 1.0).
Semantic Scholar’s data is described in: Kinney, R., et al. (2023). The Semantic Scholar Open Data Platform. arXiv:2301.10140.
