

The DOI matches its Crossref record; 63 of the 67 references it cites were found in a registry or an index; 7 of the 18 sources its claims cite were checked for support.
Edge-Cloud Synergy for AI-Enhanced Sensor Network Data: A Real-Time Predictive Maintenance Framework
Open accessAbstract
Sensor networks generate vast amounts of data in real-time, which challenges existing predictive maintenance frameworks due to high latency, energy consumption, and bandwidth requirements. This research addresses these limitations by proposing an edge-cloud hybrid framework, leveraging edge devices for immediate anomaly detection and cloud servers for in-depth failure prediction. A K-Nearest Neighbors (KNNs) model is deployed on edge devices to detect anomalies in real-time, reducing the need for continuous data transfer to the cloud. Meanwhile, a Long Short-Term Memory (LSTM) model in the cloud analyzes time-series data for predictive failure analysis, enhancing maintenance scheduling and operational efficiency. The framework's dynamic workload management algorithm optimizes task distribution between edge and cloud resources, balancing latency, bandwidth usage, and energy consumption. Experimental results show that the hybrid approach achieves a 35% reduction in latency, a 28% decrease in energy consumption, and a 60% reduction in bandwidth usage compared to cloud-only solutions. This framework offers a scalable, efficient solution for real-time predictive maintenance, making it highly applicable to resource-constrained, data-intensive environments.
Overview
CoChat Summary
## TL;DR
This paper proposes a hybrid edge-cloud predictive maintenance framework for sensor networks, using KNN on a Raspberry Pi edge device for real-time anomaly detection and LSTM in the cloud for failure prediction. The reported system reduces latency by 35%, energy consumption by 28%, and bandwidth usage by 60% versus a cloud-only baseline.
## Key findings
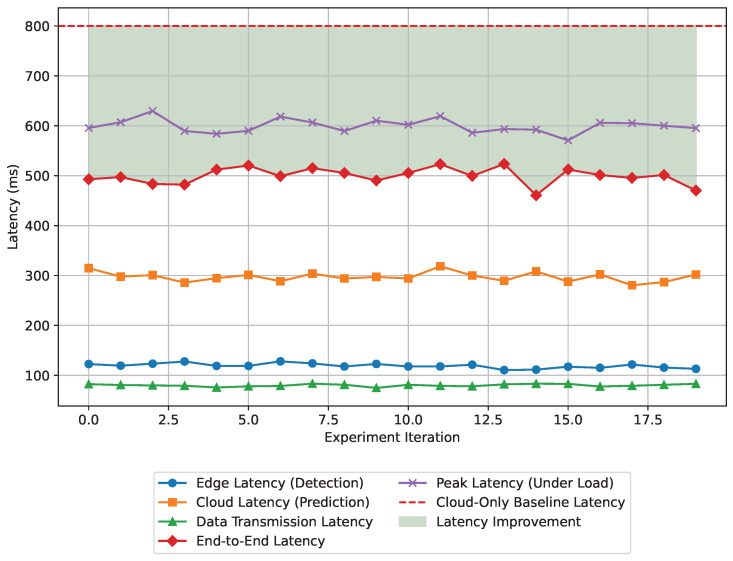
- The hybrid approach achieved a 35% reduction in latency and an average end-to-end latency of 500 ms, compared with a cloud-only baseline of 800 ms.
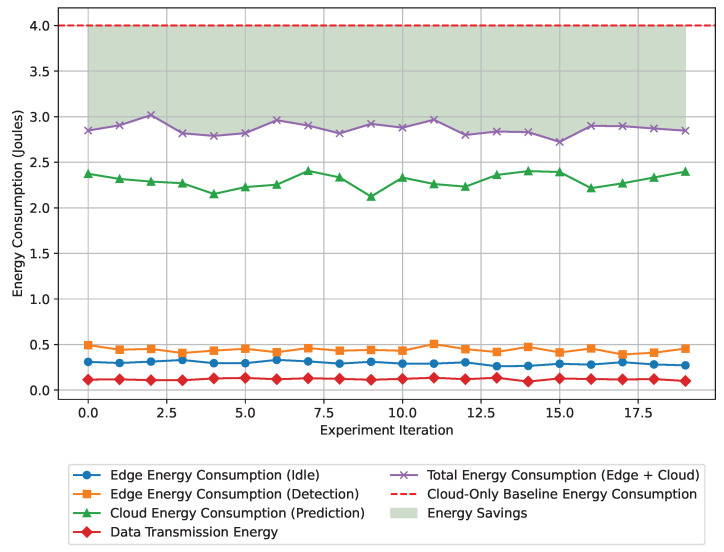
- It produced a 28% decrease in energy consumption compared with the cloud-only solution, and the paper also reports 60% energy savings relative to edge-only processing under low data flow conditions.
- Bandwidth usage was reduced by 60% compared with the cloud-only model; the paper also reports 70% less total data transmission than sending all raw data directly to the cloud.
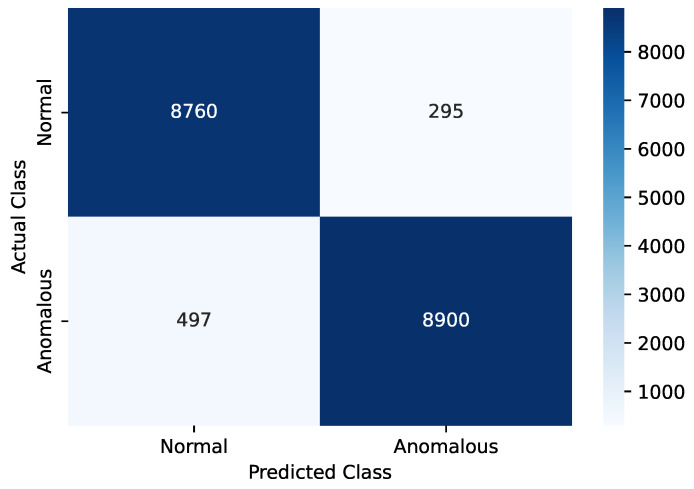
- For edge anomaly detection, the model was evaluated on 18,452 test instances; for the latency study, the paper says the summary was prepared from 20 discrete experiments.
## Methods
- The study uses a hybrid edge-cloud design: KNN runs on the edge for anomaly detection, and LSTM runs in the cloud for time-series failure prediction.
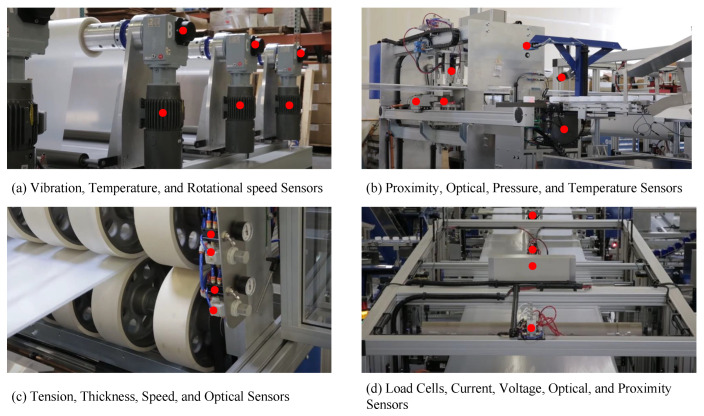
- Data come from an industrial sensor network with 123,013 instances and 20 sensors; the paper says only 20 sensors were accessible in the packaging-industry deployment, and the data were split 70:15:15 into train/validation/test using a temporal split.
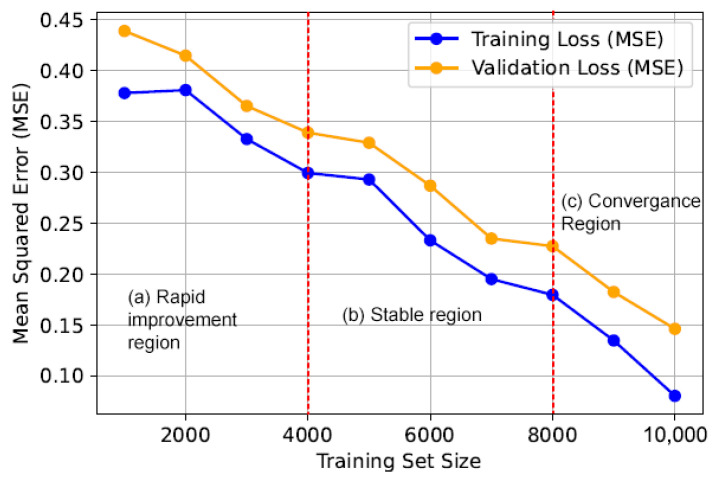
- Analysis included grid search and cross-validation for KNN parameters (selected k = 5 and a 30-time-step window), 10-fold cross-validation for both edge and cloud models, and experimental comparison against cloud-only, fog-related, and other hybrid approaches.
## Limitations
- The paper states the current framework has no exception handling if the cloud server fails to respond; it assumes the cloud system provides uninterrupted service.
- The edge device is a Raspberry Pi Zero 2 W, and the paper says this creates an extendability issue and limits workload distribution because of constrained computational capability.
- The text also notes limits evident from the setup: evaluation is based on one industrial packaging environment with 20 accessible sensors, so broader generalization is not directly demonstrated.
Model-written summary. Check it against the paper before relying on it.
Integrity signals
Registry
Cites
Statistics
Figures






Verification
Claims the paper makes
4 Valid · 3 Not valid · 8 Not checked · 66 Own results and interpretations
The cited sources support only part of this claim — read each source’s verdict below.
In the paper
“According to multiple state-of-the-art studies, the LSTM model is most suitable for time-series data.”
§ Edge-Cloud Synergy for AI-Enhanced Sensor Network Data: A Real-Time Predictive Maintenance Framework > 3. Methodology > 3.2. Comparative Analysis for Hardware and AI Model Selection
What the sources say
- Not checked — no full text of the sourcecites [41] Khan, S., and Kumar, V. (2024). A novel hybrid GRU-CNN and residual bias (RB) based RB-GRU-CNN models for prediction of PTB Diagnostic ECG time series data. Biomed. Signal Process. Control., 94. source
- Partly supportedcites [42] ArunKumar, 2022, Comparative analysis of Gated Recurrent Units (GRU), long Short-Term memory (LSTM) cells, autoregressive Integrated moving average (ARIMA), seasonal autoregressive Integrated moving average (SARIMA) for forecasting COVID-19 trends, Alex. Eng. J. sourceExperimental — accuracy not yet measured
The Mathematical modelling section describes LSTM as a way to overcome limitations of recurrent networks, supporting its suitability for time-series forecasting. But the Conclusions report that LSTM performed best for some countries’ COVID-19 fatality series while GRU performed best for others; the paper does not establish LSTM as the most suitable deep-learning model for time-series data generally. Page numbers are unavailable in our copy. (LLM, conf=0.88)
- Not checked — no full text of the sourcecites [43] Siraj, M.S., and Ahad, M. (2020, January 26–29). A hybrid deep learning framework using CNN and GRU-based RNN for recognition of pairwise similar activities. Proceedings of the 2020 Joint 9th International Conference on Informatics, Electronics & Vision (ICIEV) and 2020 4th International Conference on Imaging, Vision & Pattern Recognition (icIVPR), Kitakyushu, Japan. source
- Not checked — no full text of the sourcecites [44] Amalou, 2022, Multivariate time series prediction by RNN architectures for energy consumption forecasting, Energy Rep. source
boosted- Asserted: passes — The authors put it forward as true.
- Checkable: passes — It can be checked against evidence.
- Load-bearing: passes — The paper’s conclusions depend on it.
- Based: passes — The paper gives a reason why it holds.
The cited sources that could be checked couldn’t confirm or dispute this claim.
In the paper
“However, MQTT’s reduced reliability in high-traffic scenarios may result in dropped messages.”
§ Edge-Cloud Synergy for AI-Enhanced Sensor Network Data: A Real-Time Predictive Maintenance Framework > 3. Methodology > 3.4. Conceptual Design of the Hybrid AI Model
What the sources say
- Could not verifycites [45] Ghaleb, 2018, A survey of limitations and enhancements of the ipv6 routing protocol for low-power and lossy networks: A focus on core operations, IEEE Commun. Surv. Tutor. sourceExperimental — accuracy not yet measured
The copy discusses packet loss in RPL multipath routing (OF Enhancements Based on Multi-path Routing, p. 21), not MQTT. Searches for “MQTT” and “MQTT high traffic dropped messages” found no passage addressing MQTT reliability or dropped messages under high traffic. (LLM, conf=0.75)
hedgedstates a possible cause- Asserted: passes — The authors put it forward as true.
- Checkable: passes — It can be checked against evidence.
- Load-bearing: unclear — It is unclear whether the paper’s conclusions depend on it.
- Based: passes — The paper gives a reason why it holds.
- Could not verify
The cited sources that could be checked couldn’t confirm or dispute this claim.
In the paper
“Protocols such as HTTP introduce higher latency due to their inherent overhead, which can delay real-time detection.”
§ Edge-Cloud Synergy for AI-Enhanced Sensor Network Data: A Real-Time Predictive Maintenance Framework > 3. Methodology > 3.4. Conceptual Design of the Hybrid AI Model
What the sources say
- Could not verifycites [45] Ghaleb, 2018, A survey of limitations and enhancements of the ipv6 routing protocol for low-power and lossy networks: A focus on core operations, IEEE Commun. Surv. Tutor. sourceExperimental — accuracy not yet measured
The LLNs Routing Requirements section (p. 7) says alert traffic is sensitive to delay, while the Listen Interval Oriented Enhancements section (p. 23) discusses latency caused by Trickle’s listen-only period. Searches for HTTP and protocol overhead found no passage linking HTTP’s overhead to higher latency or delayed real-time detection. (LLM, conf=0.75)
plainstates a cause- Asserted: passes — The authors put it forward as true.
- Checkable: passes — It can be checked against evidence.
- Load-bearing: passes — The paper’s conclusions depend on it.
- Based: passes — The paper gives a reason why it holds.
- Could not verify
The cited sources support only part of this claim — read each source’s verdict below.
In the paper
“MQTT and WebSocket, with their low latency, are more suitable for timely anomaly alerts.”
§ Edge-Cloud Synergy for AI-Enhanced Sensor Network Data: A Real-Time Predictive Maintenance Framework > 3. Methodology > 3.4. Conceptual Design of the Hybrid AI Model
What the sources say
- Partly supportedcites [45] Ghaleb, 2018, A survey of limitations and enhancements of the ipv6 routing protocol for low-power and lossy networks: A focus on core operations, IEEE Commun. Surv. Tutor. sourceExperimental — accuracy not yet measured
The LLNs Routing Requirements section (p. 7) says alert traffic is highly sensitive to delay, supporting the need for timely delivery. It does not discuss MQTT or WebSocket, their latency, or whether they are more suitable for anomaly alerts; searches for both protocol names found no matching passage. (LLM, conf=0.84)
plainstates a cause- Asserted: passes — The authors put it forward as true.
- Checkable: passes — It can be checked against evidence.
- Load-bearing: passes — The paper’s conclusions depend on it.
- Based: passes — The paper gives a reason why it holds.
- Partly supported
A result the paper reports from its own data — it cites no other source for it, so there is none to check. The quote shows it is in the paper.
In the paper
“According to the comparative analysis in Table 2, the Raspberry Pi Zero 2W offers a balanced trade-off between processing power and power consumption.”
§ Edge-Cloud Synergy for AI-Enhanced Sensor Network Data: A Real-Time Predictive Maintenance Framework > 3. Methodology > 3.2. Comparative Analysis for Hardware and AI Model Selection
plainstates an association- Asserted: passes — The authors put it forward as true.
- Checkable: passes — It can be checked against evidence.
- Load-bearing: passes — The paper’s conclusions depend on it.
- Based: passes — The paper gives a reason why it holds.
38 more claims
Create a free account to see all 81 claims and to verify the 1 reference still open.
- Probably not a substantial claim. 19
- It may state two separate claims as one. 20
- The quote only partly states this claim. 2
Self-check
Percentages, sums and reported differences re-computed from the paper’s own numbers.
Self-check results appear here once an independent check has confirmed them.
Cited works that were retracted
Works this paper cites that were later retracted, from the retraction notices publishers deposit. Major when the notice came out before this paper was published.
A note, not an issue: for example, a cited work that was retracted only after this paper was published, which its authors could not have known.
In the paper
“The underlying technology is the utilization of time-series data from the sensor networks in combination with AI models to forecast when maintenance is needed [27].”
Cited work 10.1109/icocwc60930.2024.10470817 · retracted 2025-07-22 · notice 10.1109/icocwc60930.2024.10703845 · this paper published 2024-12-11
Citations
Cites
1 retracted
Prabha, S., Upadhyay, R., & Goswami, P. K. (2024) · doi:10.1109/icocwc60930.2024.10470817 · Cited by 3 · cited 1×
“The underlying technology is the utilization of time-series data from the sensor networks in combination with AI models to forecast when maintenance is needed [27].”
RetractedAll one needs to know about fog computing and related edge computing paradigms: A complete survey
Yousefpour, A., Fung, C., Nguyen, T., Kadiyala, K., Jalali, F., Niakanlahiji, A., Kong, J., & Jue, J. P. (2019) · Journal of Systems Architecture · doi:10.1016/j.sysarc.2019.02.009 · Cited by 1,368 · cited 1×
“Both edge and fog computing are decentralized approaches and contribute to reducing latency [48].”
Model Pruning Enables Efficient Federated Learning on Edge Devices
Jiang, Y., Wang, S., Valls, V., Ko, B. J., Lee, W.-H., Leung, K. K., & Tassiulas, L. (2023) · IEEE Transactions on Neural Networks and Learning Systems · doi:10.1109/tnnls.2022.3166101 · Cited by 589 · cited 1×
“Techniques such as model pruning, quantization, and knowledge distillation have been applied to make AI models more suitable for edge deployment [13].”
Predictive Maintenance and Intelligent Sensors in Smart Factory: Review
Pech, M., Vrchota, J., & Bednář, J. (2021) · Sensors · doi:10.3390/s21041470 · Cited by 461
Resource Management in Fog/Edge Computing: A Survey on Architectures, Infrastructure, and Algorithms
Hong, C.-H., & Varghese, B. (2020) · ACM Computing Surveys · doi:10.1145/3326066 · Cited by 461
Ucar, A., Karakose, M., & Kırımça, N. (2024) · Applied Sciences · doi:10.3390/app14020898 · Cited by 444 · cited 1×
“Predictive maintenance is emerging as a popular approach in industrial production, smart solutions, and automation because of its potential to minimize downtime and optimize maintenance schedules [26].”
Ghaleb, B., Al-Dubai, A. Y., Ekonomou, E., Alsarhan, A., Nasser, Y., Mackenzie, L. M., & Boukerche, A. (2019) · IEEE Communications Surveys & Tutorials · doi:10.1109/comst.2018.2874356 · Cited by 333 · cited 1×
“CoAP, being lightweight and efficient, is ideal for low-latency operations but struggles with scalability in larger deployments [45].”
Edge computing for Industry 5.0: fundamental, applications and research challenges
Sharma, M., Tomar, A., & Hazra, A. (2024) · IEEE Internet of Things Journal · doi:10.1109/jiot.2024.3359297 · Cited by 312 · cited 1×
“According to the study conducted by Sharma et al. [10], edge computing reduces latency and facilitates real-time decision-making.”
ArunKumar, K. E., Kalaga, D. V., Mohan Sai Kumar, C., Kawaji, M., & Brenza, T. M. (2022) · Alexandria Engineering Journal · doi:10.1016/j.aej.2022.01.011 · Cited by 287
Recent Trends in Internet-of-Things-Enabled Sensor Technologies for Smart Agriculture
Shaikh, F. K., Karim, S., Zeadally, S., & Nebhen, J. (2022) · IEEE Internet of Things Journal · doi:10.1109/jiot.2022.3210154 · Cited by 248
Cited by
Edge and Cloud Computing in Smart Cities
Τρίγκα, Μ., & Dritsas, E. (2025) · Future Internet · doi:10.3390/fi17030118 · Cited by 185
“Their synergy ensures adaptive resource allocation, dynamic service provisioning, and intelligent workload migration across diverse applications [1,2].”
Aylak, B. L. (2025) · Sustainability · doi:10.3390/su17062453 · Cited by 69
Mishra, L. N., & Senapati, B. (2025) · IEEE Access · doi:10.1109/access.2025.3552592 · Cited by 35
“Integrating it with the Internet of Things (IoT) and edge computing devices will enable decentralized decision-making and reduce latency, which is critical for real-time retail operations [56].”
Ramadan, M. N. A., Ali, M. A. H., Jaber, H., et al. (2025) · Ecotoxicology and Environmental Safety · doi:10.1016/j.ecoenv.2025.118442 · Cited by 21
Low-Cost IoT-Based Predictive Maintenance Using Vibration
Kolok, P., Hodoň, M., Ševčík, P., Hotz, L., & Remy, N. (2025) · Sensors · doi:10.3390/s25216610 · Cited by 30
“…algorithm adopted in this study provides unsupervised learning capability, linear inference time, and a minimal memory footprint ( 150 kB), making it an optimal compromise between accuracy, interpretability, and real-time feasibility for embedded predictive maintenance applications [3,27,30,31,39].”
Influential
Metadata
- Authors
- Sathupadi, K., Achar, S., Bhaskaran, S. V., Faruqui, N., Abdullah-Al-Wadud, M., & Uddin, J.
- Affiliations
- Google (United States) (US)
- Department of Software Engineering, Walmart Global Tech, Sunnyvale, CA 94086, USA
- Zoom Video Communications, Sanjose, CA 95113, USA
- Daffodil International University (BD)
- King Saud University (SA)
- Woosong University (KR)
- Corresponding author
- Abdullah-Al-Wadud, M.
- Uddin, Jia
- ORCID
- Venue
- Sensors
- Publisher
- MDPI AG
- Published
- 2024-12-11
- Volume
- 24
- Issue
- 24
- Pages
- 7918
- ISSN
- 1424-8220 (ISSN-L)
- PMC
- PMC11678991
- OpenAlex
- W4405284906
- Cited by
- 89
- References
- 67
- Citations by year
- 2026: 52 · 2025: 37
- FWCI
- 14.73
- Type
- journal article
- Language
- en
- Open access
- gold
- doi.org
- Licence
- Locations
- Sensors (publishedVersion, cc-by)
- PubMed Central (publishedVersion, cc-by)
- PubMed (publishedVersion)
- DOAJ (DOAJ: Directory of Open Access Journals) (submittedVersion)
- Funders
- Researchers Supporting Project, King Saud University, Saudi Arabia (RSPD2024R951)
- Topics
- Physical Sciences › Computer Science › Computer Networks and Communications › IoT and Edge/Fog Computing
- Physical Sciences › Engineering › Safety, Risk, Reliability and Quality › Reliability and Maintenance Optimization
- Physical Sciences › Computer Science › Information Systems › Internet of Things and AI
- Keywords
- predictive maintenance, sensor networks, anomaly detection, failure prediction, k-nearest neighbors, long short-term memory, time series analysis, workload management, latency reduction, energy consumption, bandwidth reduction, maintenance scheduling
About these checks
Registry, retraction, Cites and statistics results are computed, not judged, with one exception: a printed reference that no index lists is read once by a model before it counts as a citation error. Claims are extracted by a model and kept only when their quote appears verbatim in the text; each cited source is then checked, with a model’s help, for whether it says what the claim relies on. Those verdicts can be wrong — read the claim’s quote and the cited source before relying on one.
The claim verdicts this report counts are experimental: their accuracy is not yet measured.
A language model drew the claims from the paper on 2026-10-09, under version 3 of the claim definition (model deepseek-v4.1-flash, prompt extract-v3).
A second model labelled each claim on 2026-10-09 (model jev-1.13-20260917, definition revision gold-guideline-v0.2).
Cited sources are checked with a language model’s help (gpt-6-sol).
Statistics and arithmetic are recomputed, not judged.
Confidence bands are shown only for fields calibrated on our annotated test set. None is calibrated yet, so no band is shown.
What counts as a claim ›How we measure confidence ›How we check this ›
Are you an author, or do you see a problem with this page? Request a review
How to cite
Cite CoChat for the checks on this page, and the paper for its own findings.
- This page
- CoChat. (2026). Citation check: Edge-Cloud Synergy for AI-Enhanced Sensor Network Data: A Real-Time Predictive Maintenance Framework. https://app.cochat.ai/papers/10.3390/s24247918
- The paper
- Sathupadi, K., Achar, S., Bhaskaran, S. V., Faruqui, N., Abdullah-Al-Wadud, M., & Uddin, J. (2024). Edge-Cloud Synergy for AI-Enhanced Sensor Network Data: A Real-Time Predictive Maintenance Framework. Sensors. https://doi.org/10.3390/s24247918
Data sources
Bibliographic data: Semantic Scholar, OpenAlex, Crossref.
Contains information from the Semantic Scholar Academic Graph Datasets, made available under the ODC Attribution License (ODC-BY 1.0).
Semantic Scholar’s data is described in: Kinney, R., et al. (2023). The Semantic Scholar Open Data Platform. arXiv:2301.10140.
