

The DOI matches its Crossref record; the references it cites are not checked yet.
Agreement between Ventilatory Thresholds and Bilaterally Measured Vastus Lateralis Muscle Oxygen Saturation Breakpoints in Trained Cyclists: Effects of Age and Performance
Open accessAbstract
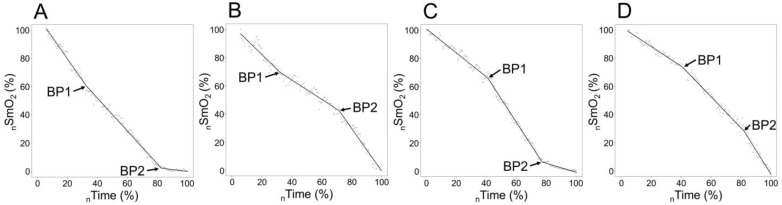
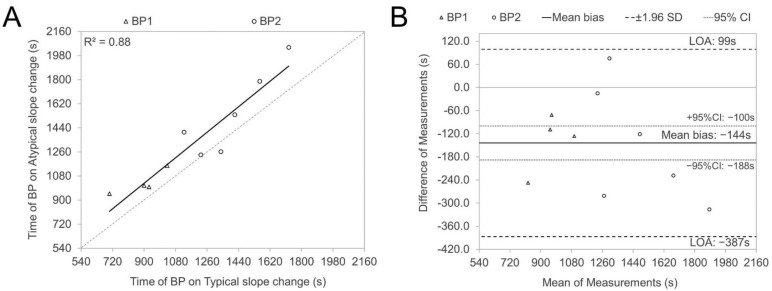
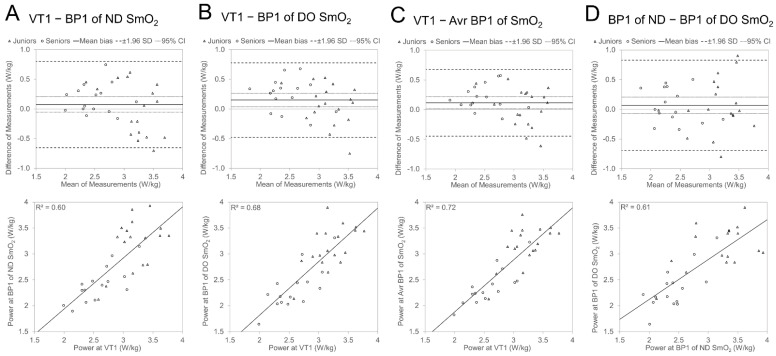
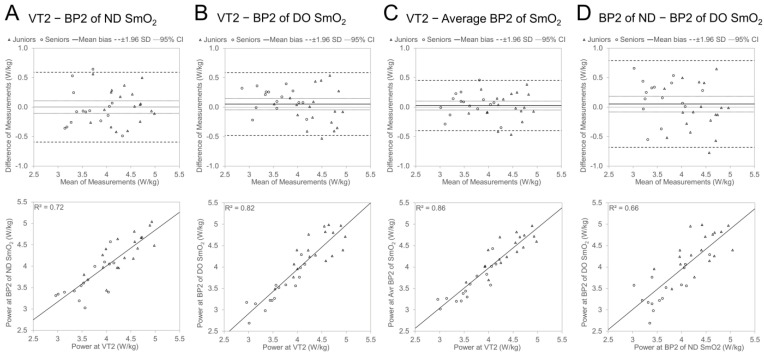
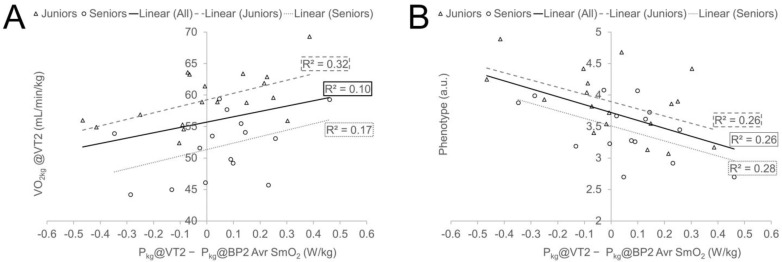
This study focused on comparing metabolic thresholds derived from local muscle oxygen saturation (SmO2) signals, obtained using near-infrared spectroscopy (NIRS), with global pulmonary ventilation rates measured at the mouth. It was conducted among various Age Groups within a well-trained cyclist population. Additionally, the study examined how cycling performance characteristics impact the discrepancies between ventilatory thresholds (VTs) and SmO2 breakpoints (BPs). Methods: Junior (n = 18) and Senior (n = 15) cyclists underwent incremental cycling tests to assess their aerobic performance and to determine aerobic (AeT) and anaerobic (AnT) threshold characteristics through pulmonary gas exchange and changes in linearity of the vastus lateralis (VL) muscle SmO2 signals. We compared the relative power (Pkg) at ventilatory thresholds (VTs) and breakpoints (BPs) for the nondominant (ND), dominant (DO), and bilaterally averaged (Avr) SmO2 during the agreement analysis. Additionally, a 30 s sprint test was performed to estimate anaerobic performance capabilities and to assess the cyclists’ phenotype, defined as the ratio of P@VT2 to the highest 5 s sprint power. Results: The Pkg@BP for Avr SmO2 had higher agreement with VT values than ND and DO. Avr SmO2 Pkg@BP1 was lower (p < 0.05) than Pkg@VT1 (mean bias: 0.12 ± 0.29 W/kg; Limits of Agreement (LOA): −0.45 to 0.68 W/kg; R2 = 0.72) and mainly among Seniors (0.21 ± 0.22 W/kg; LOA: −0.22 to 0.63 W/kg); there was no difference (p > 0.05) between Avr Pkg@BP2 and Pkg@VT2 (0.03 ± 0.22 W/kg; LOA: −0.40 to 0.45 W/kg; R2 = 0.86). The bias between two methods correlated significantly with the phenotype (r = −0.385 and r = −0.515 for AeT and AnT, respectively). Conclusions: Two breakpoints can be defined in the NIRS-captured SmO2 signal of VL, but the agreement between the two methods at the individual level was too low for interchangeable usage of those methods in the practical training process. Older cyclists generally exhibited earlier thresholds in muscle oxygenation signals compared to systemic responses, unlike younger cyclists who showed greater variability and no significant differences in this regard in bias values between the two threshold evaluation methods with no significant difference between methods. More sprinter-type cyclists tended to have systemic VT thresholds earlier than local NIRS-derived thresholds than athletes with relatively higher aerobic abilities.
Overview
The claims and statistics of this paper haven’t been checked yet.
Run the check — free, no account needed. It reads the open-access text and checks the sources it cites.
Integrity signals
Registry
Cites
Statistics
Figures
Verification
Claims the paper makes
The claims and statistics of this paper haven’t been checked yet.
Run the check — free, no account needed. It reads the open-access text and checks the sources it cites.
Claims other papers make about this one
Each is checked against this paper’s own text: does it say what the citing paper says it does?
The source backs part of the claim, not all of it — or backs it for a different population, condition or comparison.
In the citing paper
“Muscle oxygen saturation (SmO2) has been proposed as a surrogate for ventilatory thresholds (VT1, VT2) (Lin et al., 2020; Reinpõld et al., 2024; Rodrigo‐Carranza et al., 2021) or lactate thresholds (LT1, LT2) (Farzam et al., 2018; Feldmann et al., 2022; Fleitas‐Paniagua et al., 2024; Raleigh et al., 2018; Salas‐Montoro et al., 2022) in various endurance sports, including cycling, running and rowi”
From Agreement between muscle saturation breakpoints and lactate thresholds: Muscles comparison and sex difference in world‐class Nordic skiers (2026) · cites this paper as Reinpõld et al., 2024
Experimental — accuracy not yet measured
Self-check
Percentages, sums and reported differences re-computed from the paper’s own numbers.
The self-check needs the paper’s full text.
Citations
The citation lists are queued
They are fetched later and appear here then.
References 67 · Cited by 8
Research works printed but not linked: 52
- Seiler, 2010, What is best practice for training intensity and duration distribution in endurance athletes?, Int. J. Sports Physiol. Perform., 5, 276, 10.1123/ijspp.5.3.276 · DOI
- West, 2004, A century of pulmonary gas exchange, Am. J. Respir. Crit. Care Med., 169, 897, 10.1164/rccm.200312-1781OE · DOI
- Perrey, 2022, Muscle oxygenation unlocks the secrets of physiological responses to exercise: Time to exploit it in the training monitoring, Front. Sports Act. Living, 4, 864825, 10.3389/fspor.2022.864825 · DOI
- Brocherie, 2021, Under the hood: Skeletal muscle determinants of endurance performance, Front. Sports Act. Living, 3, 719434, 10.3389/fspor.2021.719434 · DOI
- Bassett, 2000, Limiting factors for maximum oxygen uptake and determinants of endurance performance, Med. Sci. Sports Exerc., 32, 70, 10.1097/00005768-200001000-00012 · DOI · Paper page
- Amann, 2011, Central and peripheral fatigue: Interaction during cycling exercise in humans, Med. Sci. Sports Exerc., 43, 2039, 10.1249/MSS.0b013e31821f59ab · DOI
- Feldner, 2019, “Look, your muscles are firing!”: A qualitative study of clinician perspectives on the use of surface electromyography in neurorehabilitation, Arch. Phys. Med. Rehabil., 100, 663, 10.1016/j.apmr.2018.09.120 · DOI
- Barstow, 2019, Understanding near infrared spectroscopy and its application to skeletal muscle research, J. Appl. Physiol., 126, 1360, 10.1152/japplphysiol.00166.2018 · DOI · Paper page
- Crum, 2017, Validity and reliability of the Moxy oxygen monitor during incremental cycling exercise, Eur. J. Sport. Sci., 17, 1037, 10.1080/17461391.2017.1330899 · DOI · Paper page
- Murias, 2013, Systemic and vastus lateralis muscle blood flow and O2 extraction during ramp incremental cycle exercise, Am. J. Physiol. Regul. Integr. Comp. Physiol., 304, R720, 10.1152/ajpregu.00016.2013 · DOI · Paper page
- Iannetta, 2017, The near-infrared spectroscopy-derived deoxygenated haemoglobin breaking-point is a repeatable measure that demarcates exercise intensity domains, J. Sci. Med. Sport, 20, 873, 10.1016/j.jsams.2017.01.237 · DOI · Paper page
- Keir, 2015, Exercise intensity thresholds: Identifying the boundaries of sustainable performance, Med. Sci. Sports Exerc., 47, 1932, 10.1249/MSS.0000000000000613 · DOI · Paper page
- Spencer, 2011, Are the parameters of VO2, heart rate and muscle deoxygenation kinetics affected by serial moderate-intensity exercise transitions in a single day?, Eur. J. Appl. Physiol., 111, 591, 10.1007/s00421-010-1653-x · DOI
- Alejo, 2022, Comparative analysis of endurance, strength and body composition indicators in professional, under-23 and junior cyclists, Front. Physiol., 13, 945552, 10.3389/fphys.2022.945552 · DOI
- Meredith, 1989, Peripheral effects of endurance training in young and old subjects, J. Appl. Physiol., 66, 2844, 10.1152/jappl.1989.66.6.2844 · DOI
- Letnes, 2020, Age-related change in peak oxygen uptake and change of cardiovascular risk factors. The HUNT Study, Prog. Cardiovasc. Dis., 63, 730, 10.1016/j.pcad.2020.09.002 · DOI
- Grassi, B., and Quaresima, V. (2016). Near-infrared spectroscopy and skeletal muscle oxidative function in vivo in health and disease: A review from an exercise physiology perspective. J. Biomed. Opt., 21. · DOI · Paper page
- Bottinelli, 2000, Human skeletal muscle fibres: Molecular and functional diversity, Prog. Biophys. Mol. Biol., 73, 195, 10.1016/S0079-6107(00)00006-7 · DOI
- Padilla, 1999, Level ground and uphill cycling ability in professional road cycling, Med. Sci. Sports Exerc., 31, 878, 10.1097/00005768-199906000-00017 · DOI
- Koga, 2007, Spatial heterogeneity of quadriceps muscle deoxygenation kinetics during cycle exercise, J. Appl. Physiol., 103, 2049, 10.1152/japplphysiol.00627.2007 · DOI
- Saitoh, 2009, Effects of prior heavy exercise on heterogeneity of muscle deoxygenation kinetics during subsequent heavy exercise, Am. J. Physiol. Regul. Integr. Comp. Physiol., 297, R615, 10.1152/ajpregu.00048.2009 · DOI
- Carpes, 2010, On the bilateral asymmetry during running and cycling—A review considering leg preference, Phys. Ther. Sport, 11, 136, 10.1016/j.ptsp.2010.06.005 · DOI
- Smak, 1999, The influence of pedaling rate on bilateral asymmetry in cycling, J. Biomech., 32, 899, 10.1016/S0021-9290(99)00090-1 · DOI
- Reinpõld, K., and Rannama, I. (2023). Oxygen Uptake and Bilaterally Measured Vastus Lateralis Muscle Oxygen Desaturation Kinetics in Well-Trained Endurance Cyclists. J. Funct. Morphol. Kinesiol., 8. · DOI
- Roelands, 2013, Guidelines to classify subject groups in sport-science research, Int. J. Sports Physiol. Perform., 8, 111, 10.1123/ijspp.8.2.111 · DOI · Paper page
- Geraskin, D., Boeth, H., and Kohl-Bareis, M. (2009). Optical measurement of adipose tissue thickness and comparison with ultrasound, magnetic resonance imging, and callipers. J. Biomed. Opt., 14. · DOI
- Rodger, 2016, Evaluation of the Cyclus cycle ergometer and the Stages power meter for measurement of power output in cycling, J. Sci. Cycl., 5, 16
- Wasserman, 2005, Principles of exercise testing and interpretation: Including pathophysiology and clinical applications, Med. Sci. Sports Exerc., 37, 1249
- Muggeo, 2008, Segmented: An R package to fit regression models with broken-line relationships, R News, 8, 20
- Hopkins, 2009, Progressive statistics for studies in sports medicine and exercise science, Med. Sci. Sports Exerc., 41, 3, 10.1249/MSS.0b013e31818cb278 · DOI · Paper page
- Ducrocq, 2020, Inorganic phosphate and lactate potentiate the pressor response to acidic stimuli in rats, Exp. Physiol., 105, 613, 10.1113/EP088349 · DOI
- Grotle, 2020, Recent advances in exercise pressor reflex function in health and disease, Auton. Neurosci., 228, 102698, 10.1016/j.autneu.2020.102698 · DOI
- Faude, 2009, Lactate threshold concepts: How valid are they?, Sports Med., 39, 469, 10.2165/00007256-200939060-00003 · DOI · Paper page
- Radegran, 1997, Ultrasound Doppler estimates of femoral artery blood flow during dynamic knee extensor exercise in humans, J. Appl. Physiol., 83, 1383, 10.1152/jappl.1997.83.4.1383 · DOI
- Zoladz, 2008, Progressive recruitment of muscle fibers is not necessary for the slow component of VO2 kinetics, J. Appl. Physiol., 105, 575, 10.1152/japplphysiol.01129.2007 · DOI
- Poole, 2021, The anaerobic threshold: 50+ years of controversy, J. Physiol., 599, 737, 10.1113/JP279963 · DOI · Paper page
- Jones, 2011, Slow component of VO2 kinetics: Mechanistic bases and practical applications, Med. Sci. Sports Exerc., 43, 2046, 10.1249/MSS.0b013e31821fcfc1 · DOI · Paper page
- Broker, 1994, Mechanical energy management in cycling: Source relations and energy expenditure, Med. Sci. Sports Exerc., 26, 64, 10.1249/00005768-199401000-00012 · DOI
- So, 2005, Muscle recruitment pattern in cycling: A review, Phys. Ther. Sport, 6, 89, 10.1016/j.ptsp.2005.02.004 · DOI
- Baum, 2003, Lower extremity muscle activities during cycling are influenced by load and frequency, J. Electromyogr. Kinesiol., 13, 181, 10.1016/S1050-6411(02)00110-4 · DOI
- Elmer, S., Barratt, P., Korff, T., and Martin, J. (2010, January 19–23). Joint-specific power production during submaximal and maximal cycling. Proceedings of the ISBS-Conference Proceedings Archive, Marquette, MI, USA.
- Turpin, 2017, Can muscle coordination explain the advantage of using the standing position during intense cycling?, J. Sci. Med. Sport, 20, 611, 10.1016/j.jsams.2016.10.019 · DOI
- Hug, 2004, Heterogeneity of muscle recruitment pattern during pedaling in professional road cyclists: A magnetic resonance imaging and electromyography study, Eur. J. Appl. Physiol., 92, 334, 10.1007/s00421-004-1096-3 · DOI
- Hug, 2008, Interindividual variability of electromyographic patterns and pedal force profiles in trained cyclists, Eur. J. Appl. Physiol., 104, 667, 10.1007/s00421-008-0810-y · DOI
- Hug, 2010, Is interindividual variability of EMG patterns in trained cyclists related to different muscle synergies?, J. Appl. Physiol., 108, 1727, 10.1152/japplphysiol.01305.2009 · DOI
- Chapman, 2008, Patterns of leg muscle recruitment vary between novice and highly trained cyclists, J. Electromyogr. Kinesiol., 18, 359, 10.1016/j.jelekin.2005.12.007 · DOI
- Priego, 2014, Effects of workload level on muscle recruitment in cycling, Hum. Mov., 15, 45, 10.2478/humo-2014-0001 · DOI
- Dingwell, 2008, Changes in muscle activity and kinematics of highly trained cyclists during fatigue, IEEE Trans. Biomed. Eng., 55, 2666, 10.1109/TBME.2008.2001130 · DOI
- Hawley, 2001, Adaptations to training in endurance cyclists: Implications for performance, Sports Med., 31, 511, 10.2165/00007256-200131070-00006 · DOI
- Coyle, 1991, Physiological and biomechanical factors associated with elite endurance cycling performance, Med. Sci. Sports Exerc., 23, 93, 10.1249/00005768-199101000-00015 · DOI
- Mezzani, 2010, Age-related prolongation of phase I of VO2 on-kinetics in healthy humans, Am. J. Physiol.-Regul. Integr. Comp. Physiol., 299, R968, 10.1152/ajpregu.00739.2009 · DOI
- Zabala, 2022, Determination of second lactate threshold using near-infrared spectroscopy in elite cyclists, Int. J. Sports Med., 43, 721, 10.1055/a-1738-0252 · DOI · Paper page
Metadata
- Authors
- Reinpõld, K., Rannama, I., & Port, K.
- Affiliations
- Tallinn University (EE)
- Corresponding author
- Reinpõld, Karmen
- Venue
- Sports
- Publisher
- MDPI AG
- Published
- 2024-01-28
- Volume
- 12
- Issue
- 2
- Pages
- 40
- ISSN
- 2075-4663 (ISSN-L)
- PMC
- PMC10892087
- OpenAlex
- W4391309133
- Cited by
- 8
- References
- 67
- Citations by year
- 2026: 3 · 2025: 4 · 2024: 1
- FWCI
- 4.00
- Type
- journal article
- Language
- en
- Open access
- gold
- doi.org
- Licence
- Locations
- Sports (publishedVersion, cc-by)
- PubMed Central (publishedVersion, cc-by)
- PubMed (publishedVersion)
- DOAJ (DOAJ: Directory of Open Access Journals) (submittedVersion, cc-by-sa)
- Topics
- Health Sciences › Medicine › Physiology (medical) › Cardiovascular and exercise physiology
- Health Sciences › Medicine › Orthopedics and Sports Medicine › Sports Performance and Training
- Health Sciences › Nursing › Nutrition and Dietetics › Muscle metabolism and nutrition
- Keywords
- ventilatory threshold, vastus lateralis, near-infrared spectroscopy, trained cyclists, aerobic threshold, anaerobic threshold, age differences, cycling performance, sprint power, measurement agreement, incremental cycling test, muscle oxygenation, pulmonary gas exchange, limits of agreement
About these checks
Registry, retraction, Cites and statistics results are computed, not judged, with one exception: a printed reference that no index lists is read once by a model before it counts as a citation error. Claims are extracted by a model and kept only when their quote appears verbatim in the text; each cited source is then checked, with a model’s help, for whether it says what the claim relies on. Those verdicts can be wrong — read the claim’s quote and the cited source before relying on one.
Statistics and arithmetic are recomputed, not judged.
Confidence bands are shown only for fields calibrated on our annotated test set. None is calibrated yet, so no band is shown.
What counts as a claim ›How we measure confidence ›How we check this ›
Are you an author, or do you see a problem with this page? Request a review
How to cite
Cite CoChat for the checks on this page, and the paper for its own findings.
- This page
- CoChat. (2026). Citation check: Agreement between Ventilatory Thresholds and Bilaterally Measured Vastus Lateralis Muscle Oxygen Saturation Breakpoints in Trained Cyclists: Effects of Age and Performance. https://app.cochat.ai/papers/10.3390/sports12020040
- The paper
- Reinpõld, K., Rannama, I., & Port, K. (2024). Agreement between Ventilatory Thresholds and Bilaterally Measured Vastus Lateralis Muscle Oxygen Saturation Breakpoints in Trained Cyclists: Effects of Age and Performance. Sports. https://doi.org/10.3390/sports12020040
