

The DOI matches its Crossref record; 28 of the 28 references it cites were found in a registry or an index.
mRNA Vaccines Encoding the HA Protein of Influenza A H1N1 Virus Delivered by Cationic Lipid Nanoparticles Induce Protective Immune Responses in Mice
Open accessAbstract
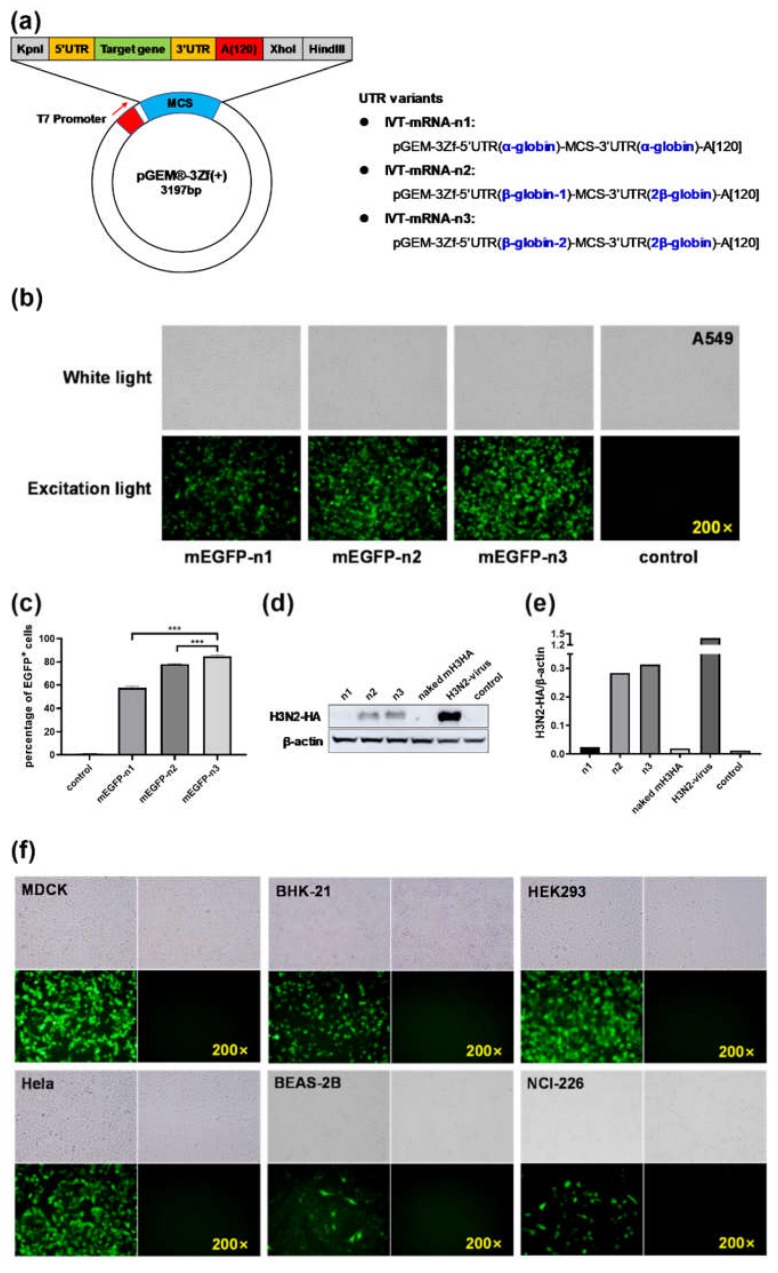
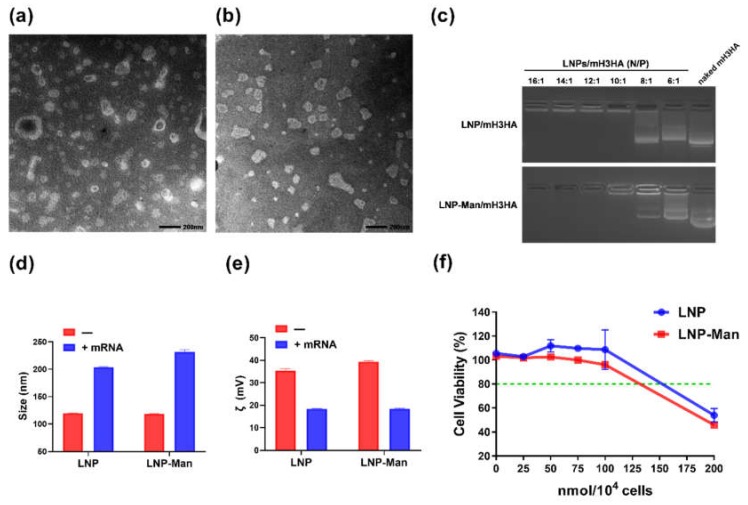
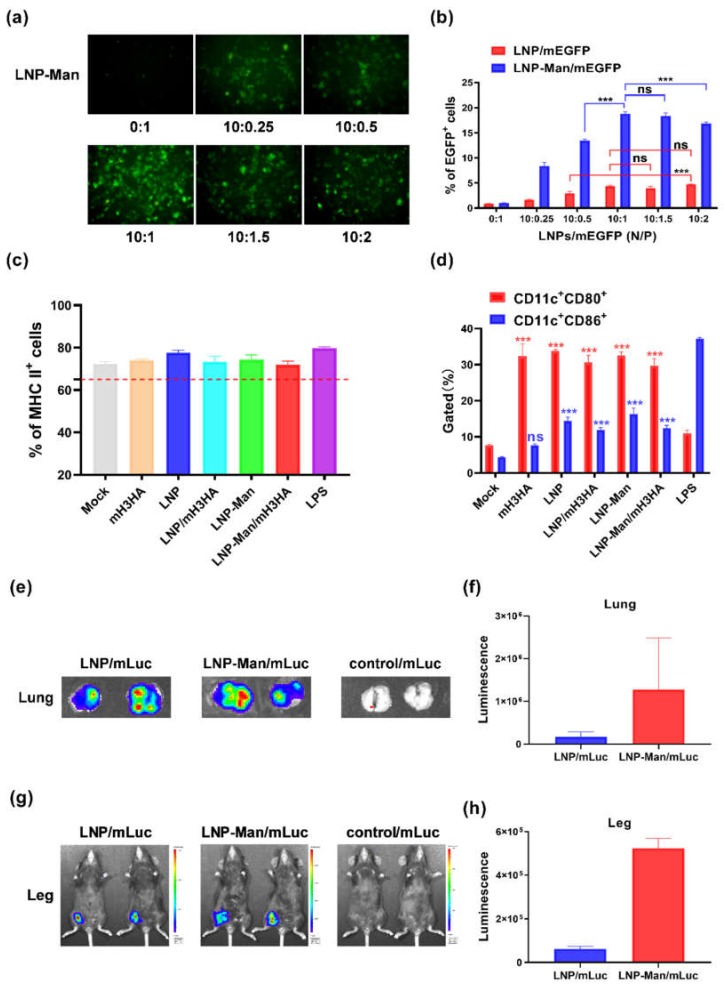
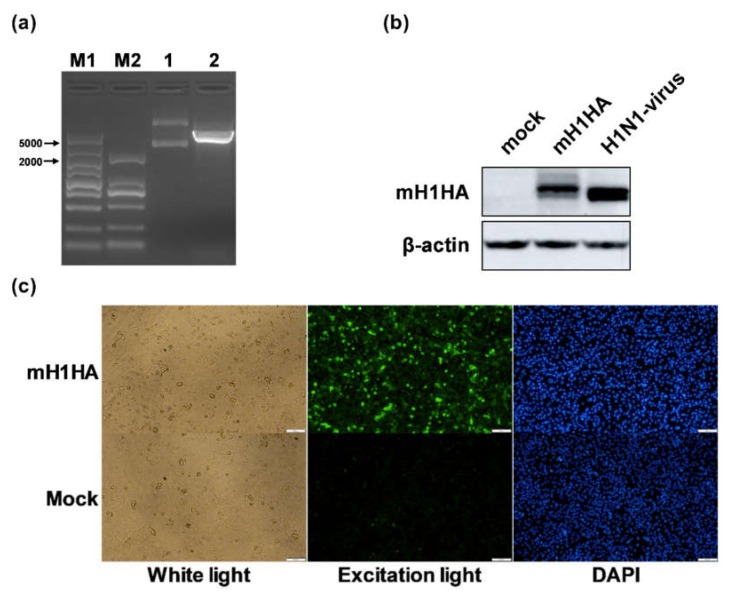
The design of the mRNA vaccine involves the selection of in vitro transcription (IVT) systems and nonviral delivery vectors. This study aimed to verify the effect of 5’ and 3’ untranslated region (UTR) sequences on the translation efficiency of mRNA. Three modes of IVT-mRNA systems (IVT-mRNA-n1/n2/n3) with diverse UTRs were constructed, and EGFP (enhanced green fluorescent protein) and HA (hemagglutinin) gene of H3N2 influenza virus were introduced into each of them. The results showed that the mode of 5’ and 3’ UTRs originating from human β-globulin was better than the mode of UTRs from human α-globulin, and the n3 mode was the best. mEGFP-n3, mH3HA-n3, and mLuciferease-n3 were prepared to compare the effect of cationic lipid nanoparticle (LNP) with that of mannose-conjugated LNP (LNP-Man) on the efficiency of gene delivery. The results showed that the effect of LNP-Man was better than that of LNP both in vitro and in vivo. Choosing appropriate ligands might help in vaccine design. After selecting the IVT-mRNA-n3 system and delivery vectors, mRNA vaccines were constructed against the H1N1 influenza virus, and C57BL/6 mice were immunized through intranasal administration. The results showed that mRNA vaccines could elicit both humoral and cellular immune responses and completely protect mice from the tenfold LD50 H1N1 influenza virus challenge.
Overview
The claims and statistics of this paper haven’t been checked yet.
Run the check — free, no account needed. It reads the open-access text and checks the sources it cites.
Integrity signals
Registry
Cites
Statistics
Figures
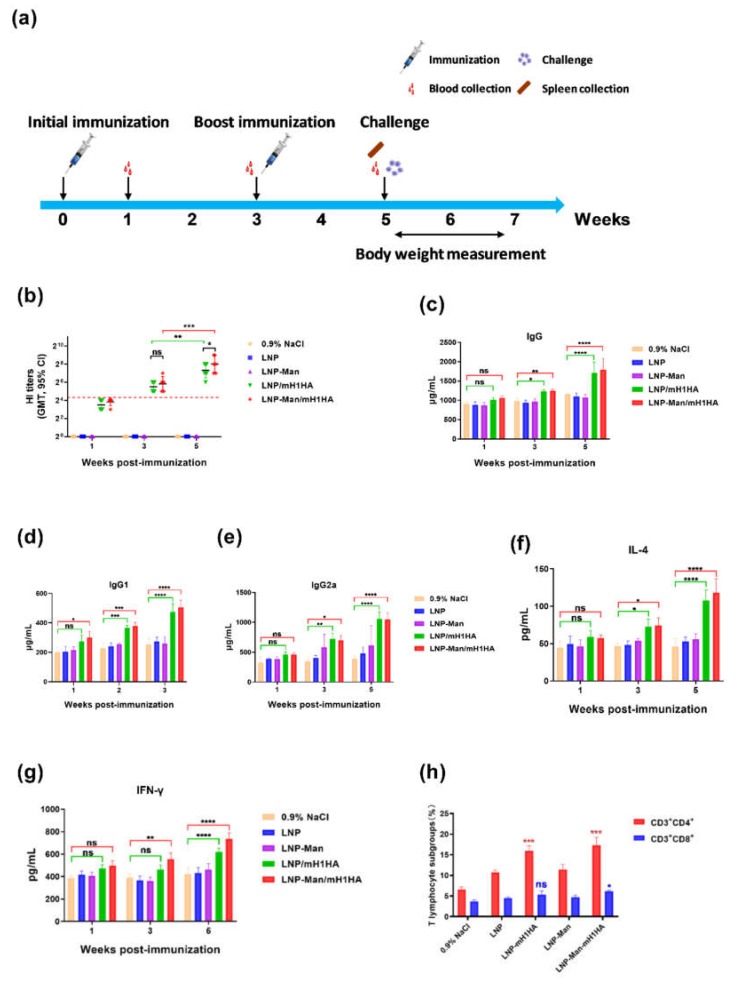
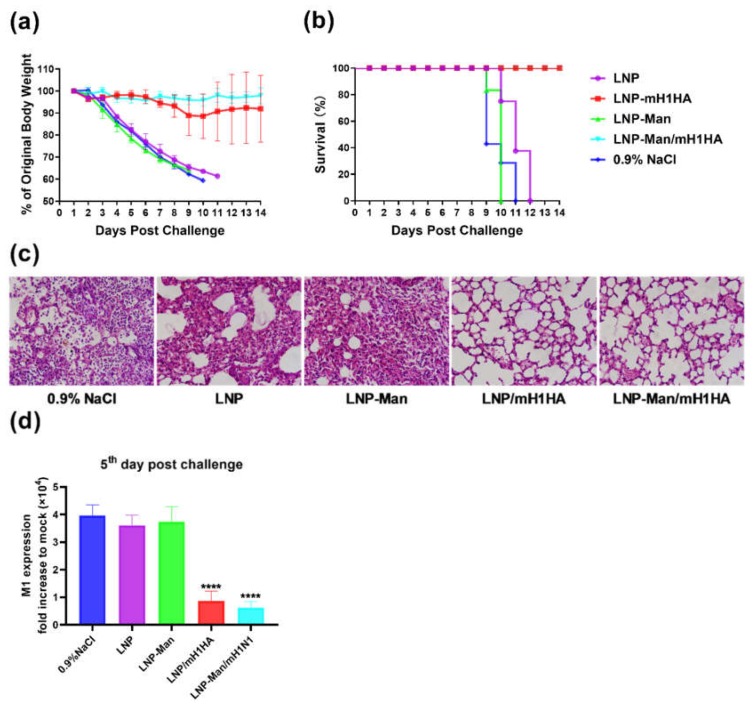
Verification
Claims the paper makes
The claims and statistics of this paper haven’t been checked yet.
Run the check — free, no account needed. It reads the open-access text and checks the sources it cites.
Claims other papers make about this one
Each is checked against this paper’s own text: does it say what the citing paper says it does?
In the citing paper
“Lipid nanoparticle–mRNA vaccines are also being investigated as influenza vaccines29,41,156,157,159,184,189–191, with some formulations in clinical trials (Table 1).”
From Lipid nanoparticles for mRNA delivery (2021) · cites this paper as [159]
Self-check
Percentages, sums and reported differences re-computed from the paper’s own numbers.
The self-check needs the paper’s full text.
Citations
Cites
mRNA vaccines — a new era in vaccinology
Pardi, N., Hogan, M. J., Porter, F. W., & Weissman, D. (2018) · Nature Reviews Drug Discovery · doi:10.1038/nrd.2017.243 · Cited by 4,667
Inaba, K., Inaba, M., Romani, N., Aya, H., Deguchi, M., Ikehara, S., Muramatsu, S., & Steinman, R. M. (1992) · The Journal of Experimental Medicine · doi:10.1084/jem.176.6.1693 · Cited by 3,741
mRNA-based therapeutics--developing a new class of drugs
Sahin, U., Karikó, K., & Türeci, Ö. (2014) · Nature Reviews Drug Discovery · doi:10.1038/nrd4278 · Cited by 2,474
Systemic RNA delivery to dendritic cells exploits antiviral defence for cancer immunotherapy
Kranz, L. M., Diken, M., Haas, H., Kreiter, S., Loquai, C., Reuter, K. C., Meng, M., Fritz, D., Vascotto, F., Hefesha, H., et al. (2016) · Nature · doi:10.1038/nature18300 · Cited by 1,819
Modified mRNA vaccines protect against zika virus infection
Richner, J. M., Himansu, S., Dowd, K. A., Butler, S. L., Salazar, V., Fox, J. M., Julander, J. G., Tang, W. W., Shresta, S., Pierson, T. C., et al. (2017) · Cell · doi:10.1016/j.cell.2017.02.017 · Cited by 909
The evolution of seasonal influenza viruses
Petrova, V. N., & Russell, C. A. (2017) · Nature Reviews Microbiology · doi:10.1038/nrmicro.2017.118 · Cited by 889
Zika virus protection by a single low-dose nucleoside-modified mRNA vaccination
Pardi, N., Hogan, M. J., Pelc, R. S., Muramatsu, H., Andersen, H., DeMaso, C. R., Dowd, K. A., Sutherland, L. L., Scearce, R. M., Parks, R., et al. (2017) · Nature · doi:10.1038/nature21428 · Cited by 884
The human antibody response to influenza A virus infection and vaccination
Krammer, F. (2019) · Nature reviews. Immunology · doi:10.1038/s41577-019-0143-6 · Cited by 819
Nonviral delivery of self-amplifying RNA vaccines
Geall, A. J., Verma, A., Otten, G. R., Shaw, C. A., Hekele, A., Banerjee, K., Cu, Y., Beard, C. W., Brito, L. A., Krucker, T., et al. (2012) · Proceedings of the National Academy of Sciences · doi:10.1073/pnas.1209367109 · Cited by 675
Bahl, K., Senn, J. J., Yuzhakov, O., Bulychev, A., Brito, L. A., Hassett, K. J., Laska, M. E., Smith, M., Almarsson, Ö., Thompson, J., et al. (2017) · Molecular Therapy · doi:10.1016/j.ymthe.2017.03.035 · Cited by 642
Holtkamp, S., Kreiter, S., Selmi, A., Simon, P., Koslowski, M., Huber, C., Türeci, O., & Sahin, U. (2006) · Blood · doi:10.1182/blood-2006-04-015024 · Cited by 625
Vogel, A. B., Lambert, L., Kinnear, E., Busse, D., Erbar, S., Reuter, K. C., Wicke, L., Perkovic, M., Beissert, T., Haas, H., et al. (2018) · Molecular Therapy · doi:10.1016/j.ymthe.2017.11.017 · Cited by 501
Petsch, B., Schnee, M., Vogel, A. B., Lange, E., Hoffmann, B., Voss, D., Schlake, T., Thess, A., Kallen, K.-J., Stitz, L., et al. (2012) · Nature Biotechnology · doi:10.1038/nbt.2436 · Cited by 464
Pardi, N., Parkhouse, K., Kirkpatrick, E., McMahon, M., Zost, S. J., Mui, B. L., Tam, Y. K., Karikó, K., Barbosa, C. J., Madden, T. D., et al. (2018) · Nature Communications · doi:10.1038/s41467-018-05482-0 · Cited by 281
Mechanism of action of mRNA-based vaccines
Iavarone, C., O’hagan, D. T., Yu, D., Delahaye, N. F., & Ulmer, J. B. (2017) · Expert Review of Vaccines · doi:10.1080/14760584.2017.1355245 · Cited by 234
Current and future influenza vaccines
Yamayoshi, S., & Kawaoka, Y. (2019) · Nature Medicine · doi:10.1038/s41591-018-0340-z · Cited by 203
Nanoscale platforms for messenger RNA delivery
Li, B., Zhang, X., & Dong, Y. (2019) · WIREs Nanomedicine and Nanobiotechnology · doi:10.1002/wnan.1530 · Cited by 170
Chahal, J. S., Fang, T., Woodham, A. W., Khan, O. F., Ling, J. J., Anderson, D. G., & Ploegh, H. L. (2017) · Scientific Reports · doi:10.1038/s41598-017-00193-w · Cited by 161
Brazzoli, M., Magini, D., Bonci, A., Buccato, S., Giovani, C., Kratzer, R., Zurli, V., Mangiavacchi, S., Casini, D., Brito, L. M., et al. (2016) · Journal of Virology · doi:10.1128/jvi.01786-15 · Cited by 154
Global biogeography of human infectious diseases
Murray, K. A., Preston, N. D., Allen, T., Zambrana‐Torrelio, C., Hosseini, P. R., & Daszak, P. (2015) · Proceedings of the National Academy of Sciences · doi:10.1073/pnas.1507442112 · Cited by 152
Hattori, Y., Kawakami, S., Suzuki, S., Yamashita, F., & Hashida, M. (2004) · Biochemical and Biophysical Research Communications · doi:10.1016/j.bbrc.2004.03.141 · Cited by 111
Lipid coated chitosan-DNA nanoparticles for enhanced gene delivery
Baghdan, E., Pinnapireddy, S. R., Strehlow, B., Engelhardt, K. H., Schäfer, J., & Bakowsky, U. (2017) · International Journal of Pharmaceutics · doi:10.1016/j.ijpharm.2017.11.045 · Cited by 110
New Kids on the Block: RNA-Based Influenza Virus Vaccines
Scorza, F. B., & Pardi, N. (2018) · Vaccines · doi:10.3390/vaccines6020020 · Cited by 91
Development of nucleic acid vaccines: use of self-amplifying RNA in lipid nanoparticles
Rodríguez‐Gascón, A., del Pozo‐Rodríguez, A., & Solinís, M. Á. (2014) · International Journal of Nanomedicine · doi:10.2147/ijn.s39810 · Cited by 79
Bialkowski, L., van Weijnen, A., der Jeught, K. V., Renmans, D., Daszkiewicz, L., Heirman, C., Stangé, G. M., Breckpot, K., Aerts, J. L., & Thielemans, K. (2016) · Scientific Reports · doi:10.1038/srep22509 · Cited by 79
Markov, O. V., Mironova, N. L., Shmendel, E. V., Serikov, R. N., Morozova, N. G., Maslov, M. A., Vlassov, V. V., & Аркадьевна, З. М. (2015) · Journal of Controlled Release · doi:10.1016/j.jconrel.2015.06.028 · Cited by 78
Mannan‐mediated gene delivery for cancer immunotherapy
Tang, C. K., Lodding, J., Minigo, G., Pouniotis, D. S., Plebanski, M., Scholzen, A., McKenzie, I. F. C., Pietersz, G. A., & Apostolopoulos, V. (2006) · Immunology · doi:10.1111/j.1365-2567.2006.02506.x · Cited by 62
Mannosylated and Histidylated LPR Technology for Vaccination with Tumor Antigen mRNA
Pichon, C., & Midoux, P. (2012) · Methods in molecular biology · doi:10.1007/978-1-62703-260-5_16 · Cited by 42
Cited by
Sorted by citations
Lipid nanoparticles for mRNA delivery
Hou, X., Zaks, T., Langer, R., & Dong, Y. (2021) · Nature Reviews Materials · doi:10.1038/s41578-021-00358-0 · Cited by 4,076
mRNA vaccines for infectious diseases: principles, delivery and clinical translation
Chaudhary, N., Weissman, D., & Whitehead, K. A. (2021) · Nature Reviews Drug Discovery · doi:10.1038/s41573-021-00283-5 · Cited by 1,555
Drug delivery systems for RNA therapeutics
Paunovska, K., Loughrey, D., & Dahlman, J. E. (2022) · Nature Reviews Genetics · doi:10.1038/s41576-021-00439-4 · Cited by 1,349
mRNA-based therapeutics: powerful and versatile tools to combat diseases
Qin, S., Tang, X., Chen, Y., Chen, K., Fan, N., Xiao, W., Zheng, Q., Li, G., Teng, Y., Wu, M., et al. (2022) · Signal Transduction and Targeted Therapy · doi:10.1038/s41392-022-01007-w · Cited by 852
Nanomaterial Delivery Systems for mRNA Vaccines
Buschmann, M. D., Carrasco, M. J., Alishetty, S., Paige, M., Alameh, M. G., & Weissman, D. (2021) · Vaccines · doi:10.3390/vaccines9010065 · Cited by 582
Metadata
- Authors
- Zhuang, X., Qi, Y., Wang, M., Yu, N., Nan, F., Zhang, H., Tian, M., Li, C., Lu, H., & Jin, N.
- Affiliations
- Academy of Military Medical Sciences (CN)
- Chinese Academy of Sciences (CN)
- Wenzhou University (CN)
- Yanbian University (CN)
- Jilin University (CN)
- Corresponding author
- Jin, Ningyi
- Venue
- Vaccines
- Publisher
- MDPI AG
- Published
- 2020-03-10
- Volume
- 8
- Issue
- 1
- Pages
- 123
- ISSN
- 2076-393X (ISSN-L)
- PMC
- PMC7157730
- OpenAlex
- W3011203304
- Cited by
- 132
- References
- 28
- Citations by year
- 2026: 4 · 2025: 27 · 2024: 26 · 2023: 23 · 2022: 29 · 2021: 18 · 2020: 5
- FWCI
- 6.08
- Type
- journal article
- Language
- en
- Open access
- gold
- doi.org
- Licence
- Locations
- Vaccines (publishedVersion, cc-by)
- PubMed Central (publishedVersion, cc-by)
- PubMed (publishedVersion)
- DOAJ (DOAJ: Directory of Open Access Journals) (submittedVersion, cc-by-sa)
- Funders
- National Science and Technology Major Project of the Ministry of Science and Technology of China (2018ZX10102-001)
- Changchun Science and technology plan project (19SS016)
- Topics
- Life Sciences › Biochemistry, Genetics and Molecular Biology › Molecular Biology › RNA Interference and Gene Delivery
- Health Sciences › Medicine › Epidemiology › Influenza Virus Research Studies
- Life Sciences › Immunology and Microbiology › Immunology › Immunotherapy and Immune Responses
- Keywords
- mRNA vaccines, influenza A (H1N1) virus, hemagglutinin, cationic lipid nanoparticles, 5' and 3' untranslated regions, in vitro transcription, gene delivery, intranasal immunization, humoral immune response, cell-mediated immunity, protective immunity
About these checks
Registry, retraction, Cites and statistics results are computed, not judged, with one exception: a printed reference that no index lists is read once by a model before it counts as a citation error. Claims are extracted by a model and kept only when their quote appears verbatim in the text; each cited source is then checked, with a model’s help, for whether it says what the claim relies on. Those verdicts can be wrong — read the claim’s quote and the cited source before relying on one.
Statistics and arithmetic are recomputed, not judged.
Confidence bands are shown only for fields calibrated on our annotated test set. None is calibrated yet, so no band is shown.
What counts as a claim ›How we measure confidence ›How we check this ›
Are you an author, or do you see a problem with this page? Request a review
