

The DOI matches its Crossref record; 74 of the 74 references it cites were found in a registry or an index.
Comparing Tip of the Red Giant Branch Distance Scales: An Independent Reduction of the Carnegie-Chicago Hubble Program and the Value of the Hubble Constant
Open accessAbstract
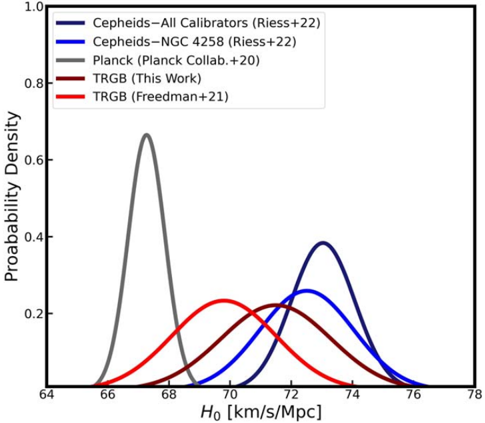
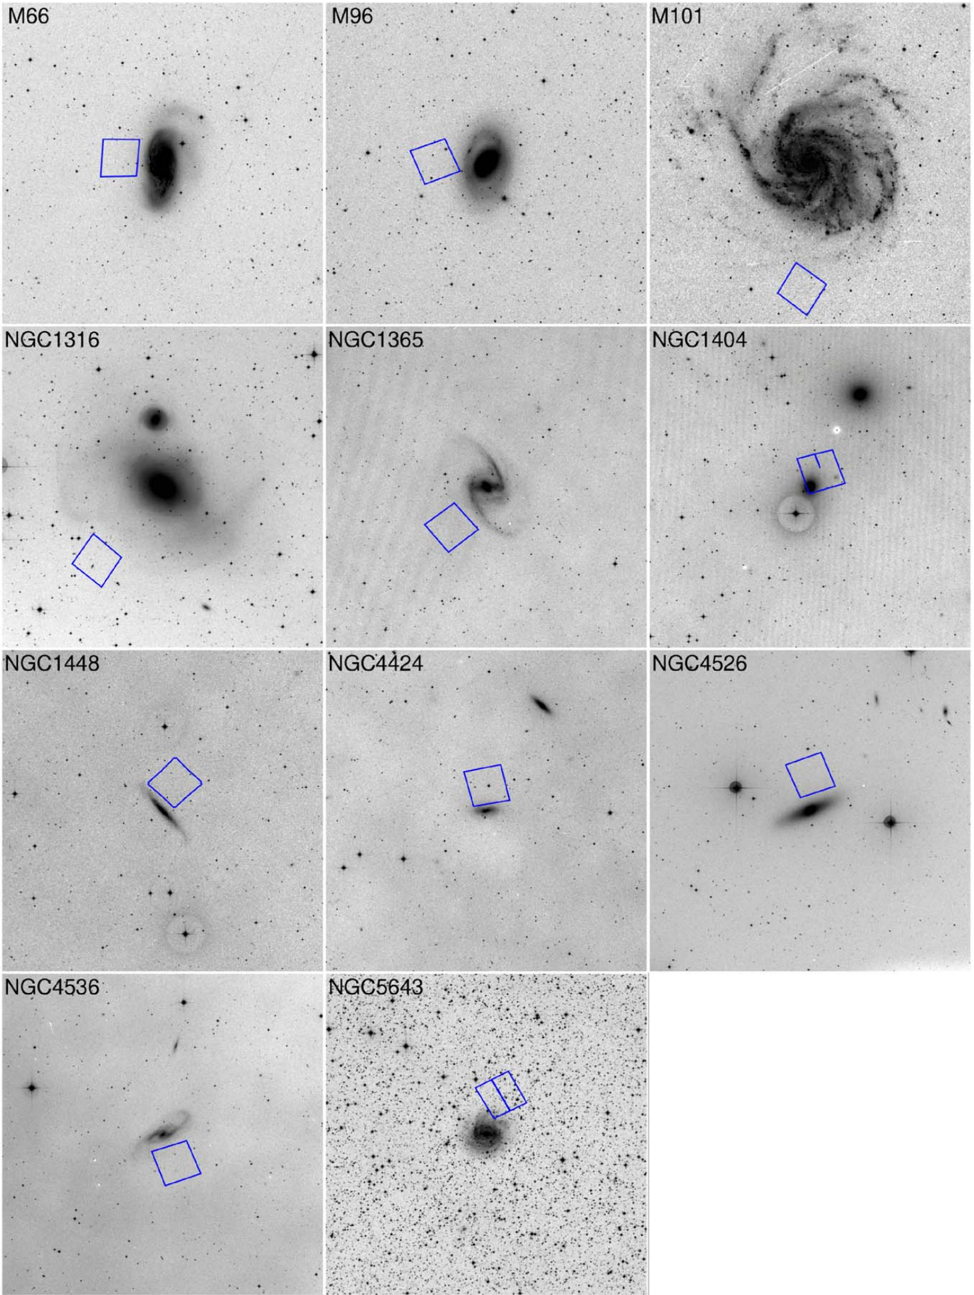
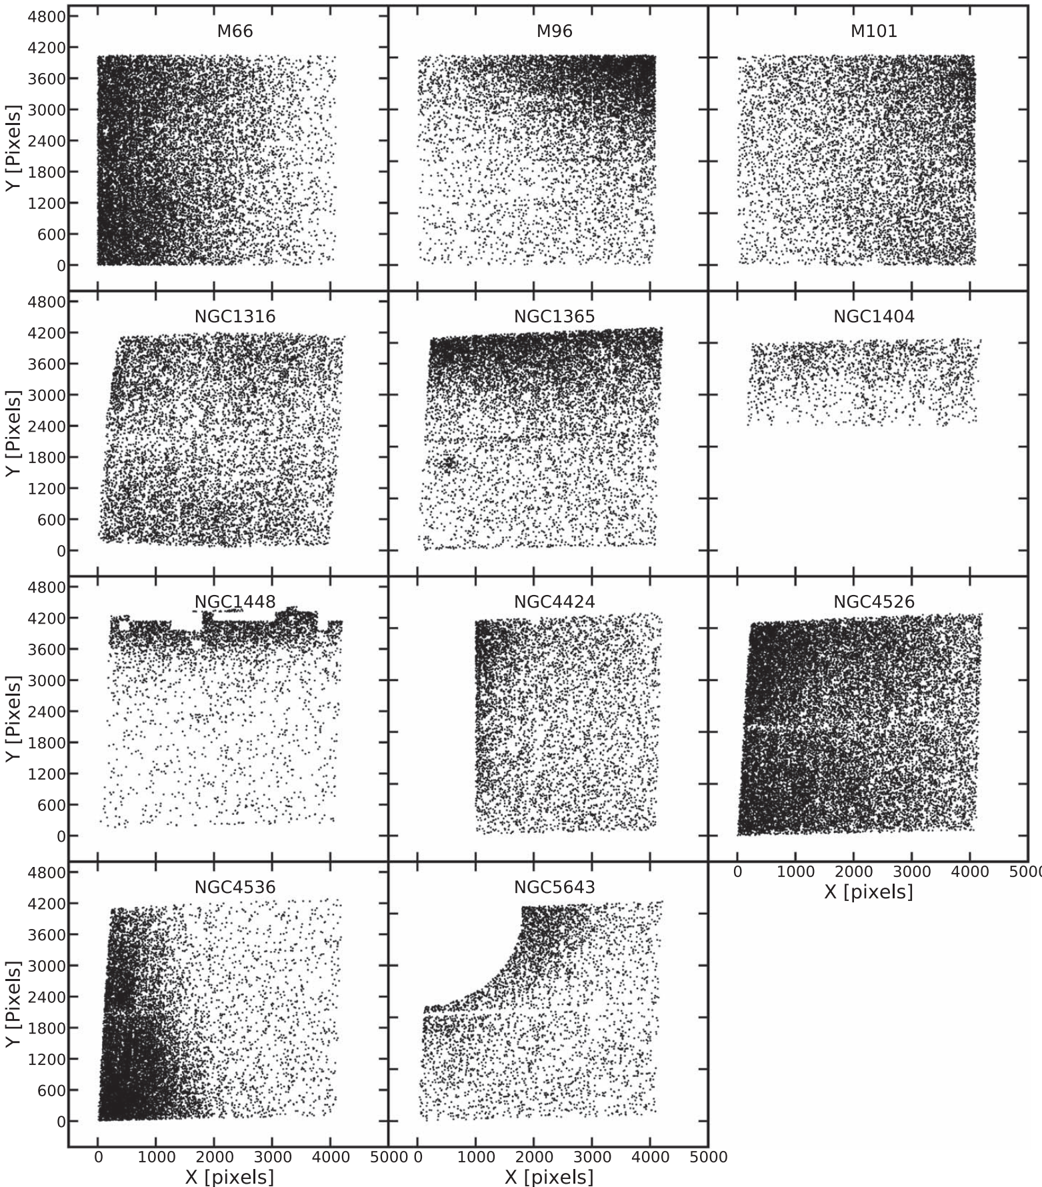
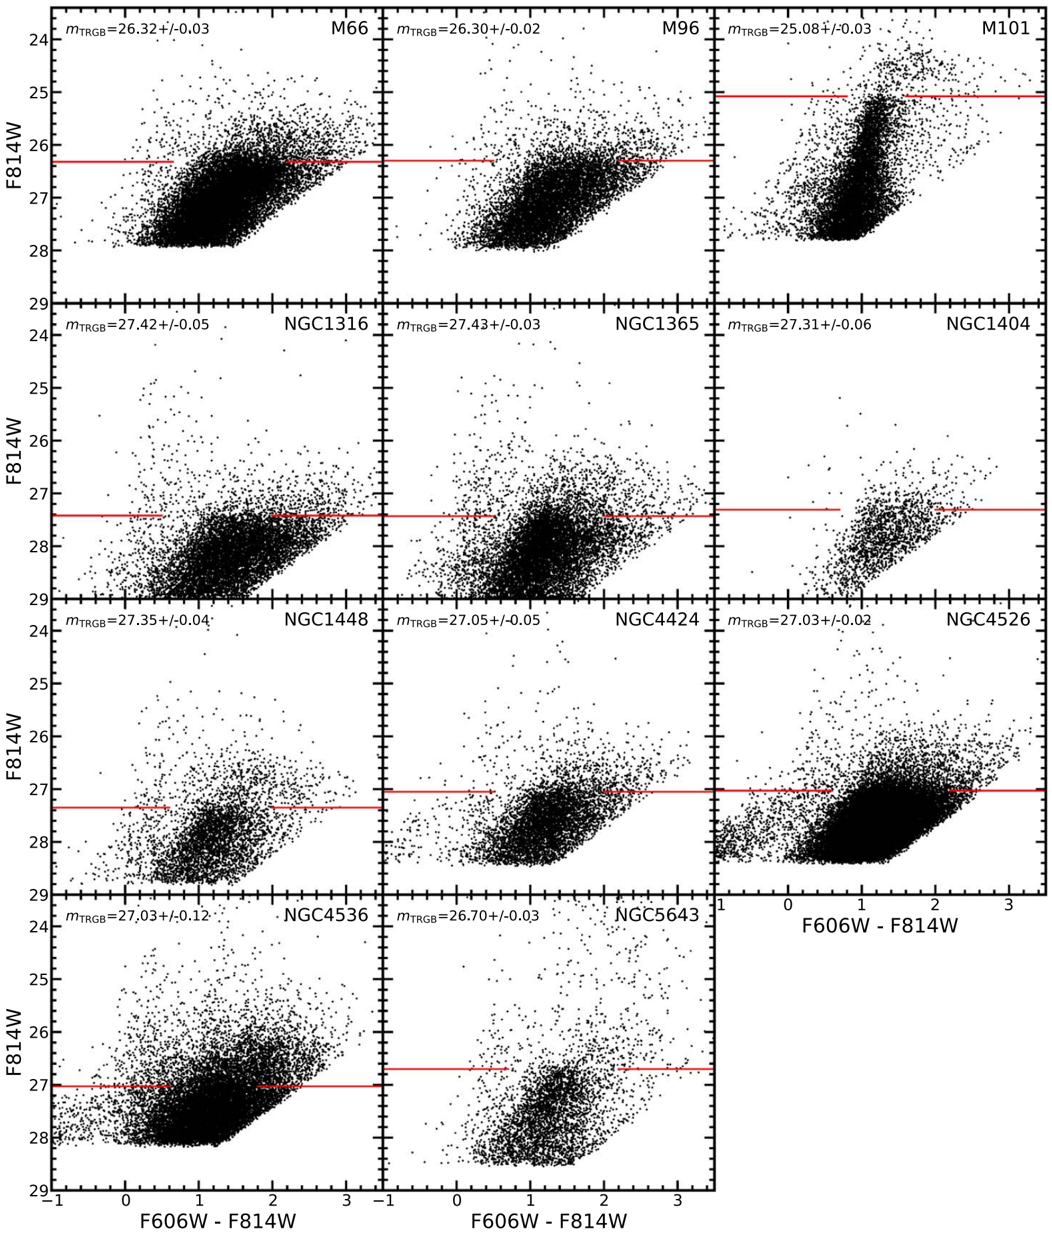
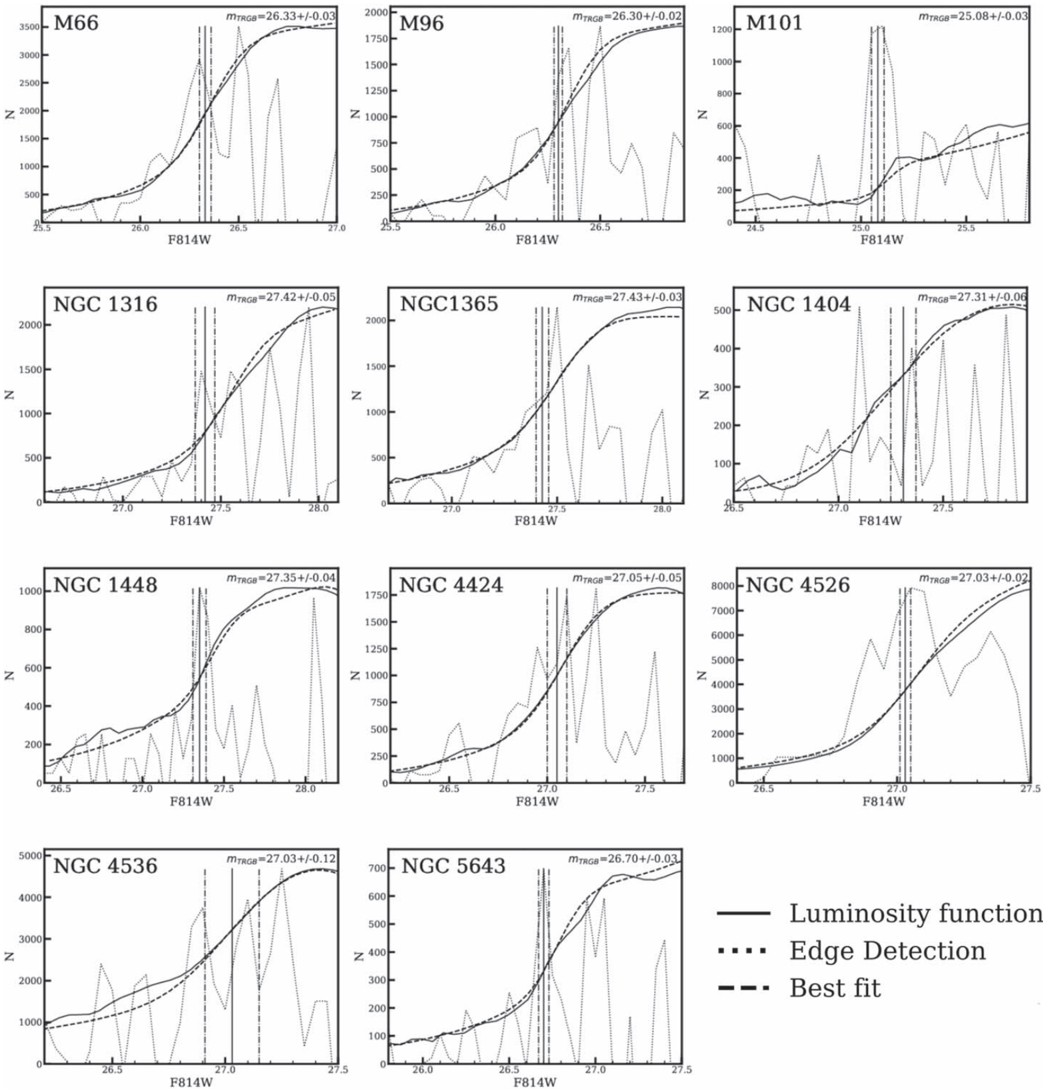
Abstract The tip of the red giant branch has been used to measure distances to 500 nearby galaxies with the Hubble Space Telescope (HST) which are available in the Color–Magnitude Diagrams and Tip of the Red Giant Branch (CMDs/TRGB) catalog on the Extragalactic Distance Database (EDD). Our established methods are employed to perform an independent reduction of the targets presented by the Carnegie-Chicago Hubble Program (CCHP) in the series of papers culminating in Freedman (2021). Our distinct methodology involves modeling the observed luminosity function of red giant branch and asymptotic giant branch stars, which differs from the edge-detection algorithms employed by the CCHP. We find excellent agreement between distances for 11 hosts with new imaging, all at D < 20 Mpc. However, we are unable to measure the TRGB for four hosts that use archival data designed to measure distances with Cepheids, all at D > 23 Mpc. With two new HST observations taken in the halo of the megamaser host NGC 4258, the first with the same ACS F606W and F814W filters and state of the electronics used for SN Ia hosts, we then calibrate our TRGB distance scale to the geometric megamaser distance. Using our TRGB distances, we find a value of the Hubble Constant of H 0 = 71.5 ± 1.8 km s−1 Mpc−1 when using either the Pantheon or Carnegie Supernova Project (CSP) samples of supernovae. In the future, the James Webb Space Telescope will extend measurements of the TRGB to additional hosts of SN Ia and surface-brightness fluctuation measurements for separate paths to H 0.
Overview
The claims and statistics of this paper haven’t been checked yet.
Run the check — free, no account needed. It reads the open-access text and checks the sources it cites.
Integrity signals
Registry
Cites
Statistics
Figures
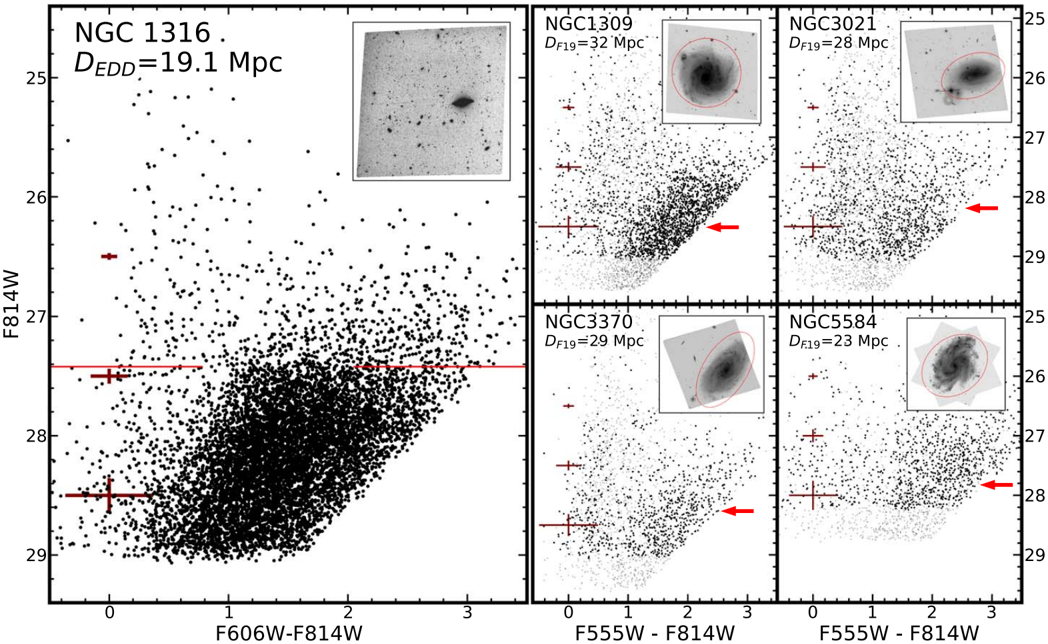
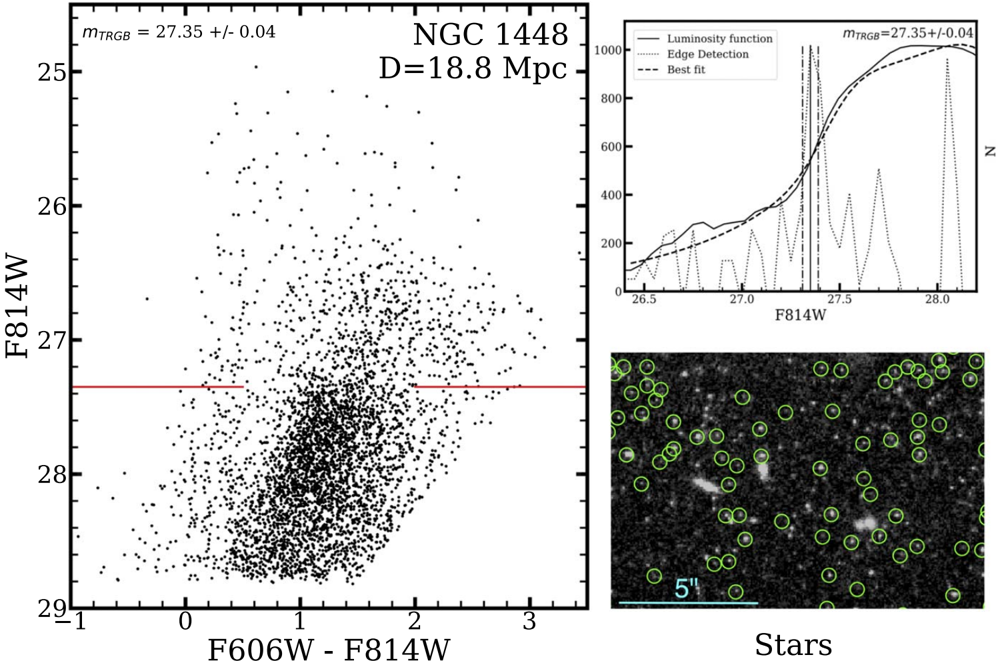
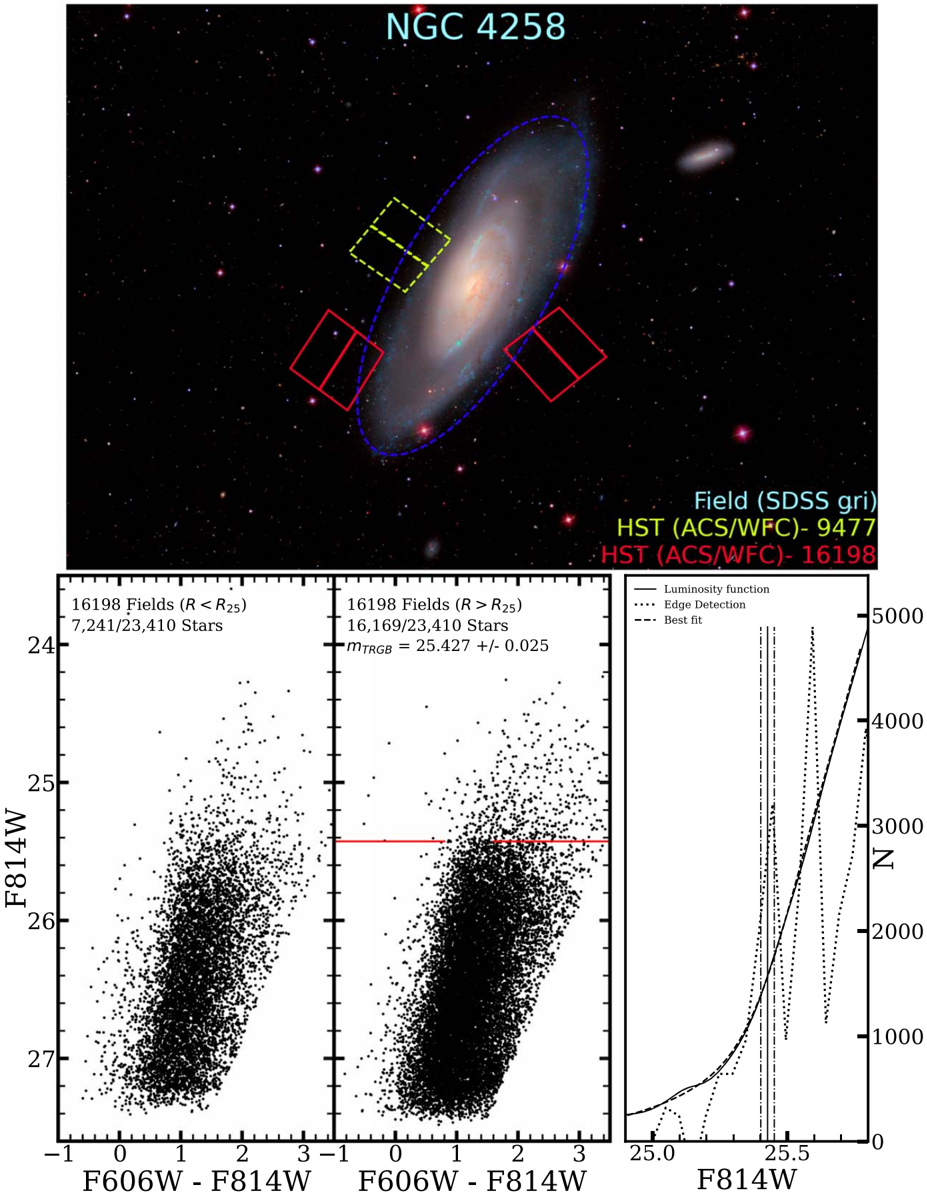
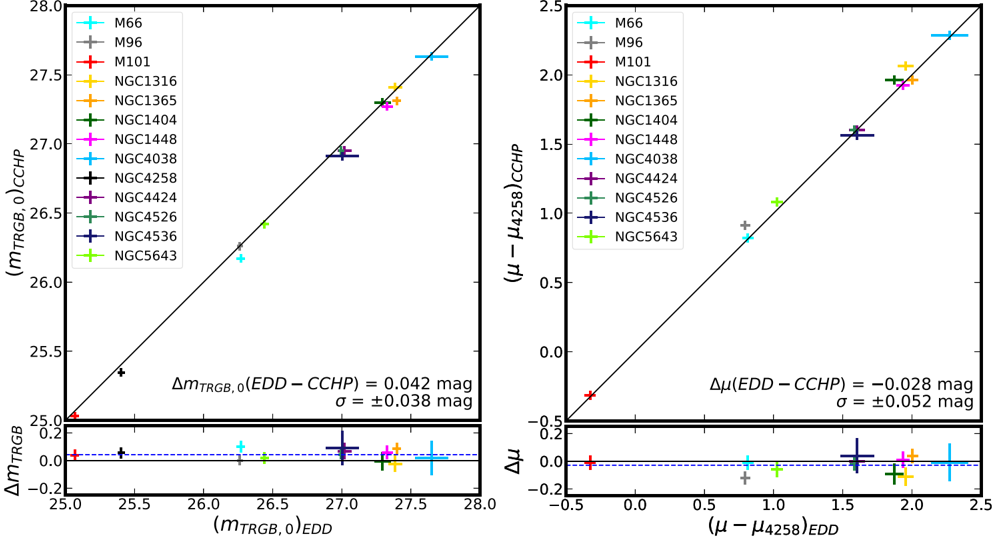
Verification
Claims the paper makes
The claims and statistics of this paper haven’t been checked yet.
Run the check — free, no account needed. It reads the open-access text and checks the sources it cites.
Claims other papers make about this one
Each is checked against this paper’s own text: does it say what the citing paper says it does?
The cited source says what the claim attributes to it.
In the citing paper
“the new independent reanalysis of the targets presented by the Carnegie-Chicago Hubble Program (CCHP) performed in [36] that is shifted more in agreement with the SH0ES value.”
From Challenges of the Standard Cosmological Model (2022) · cites this paper as [36]
Self-check
Percentages, sums and reported differences re-computed from the paper’s own numbers.
The self-check needs the paper’s full text.
Citations
Cites
Planck 2018 results: VI. Cosmological parameters
Planck Collaboration, Aghanim, N., Akrami, Y., Ashdown, M., Aumont, J., Baccigalupi, C., Ballardini, M., Banday, A. J., Barreiro, R. B., Bartolo, N., et al. (2020) · Astronomy & Astrophysics · doi:10.1051/0004-6361/201833910 · Cited by 14,258
The Sloan Digital Sky Survey: Technical Summary
York, D., Adelman, J., Anderson, J., Anderson, S., Annis, J., Bahcall, N., Bakken, J., Barkhouser, R., Bastian, S., Berman, E., et al. (2000) · The Astronomical Journal · doi:10.1086/301513 · Cited by 8,368
MEASURING REDDENING WITH SLOAN DIGITAL SKY SURVEY STELLAR SPECTRA AND RECALIBRATING SFD
Schlafly, E., & Finkbeiner, D. (2010) · The Astrophysical Journal · doi:10.1088/0004-637x/737/2/103 · Cited by 3,969
DAOPHOT: A COMPUTER PROGRAM FOR CROWDED-FIELD STELLAR PHOTOMETRY
Stetson, P. (1987) · Publications of the Astronomical Society of the Pacific · doi:10.1086/131977 · Cited by 3,909
Scolnic, D. M., Jones, D. O., Rest, A., Pan, Y. C., Chornock, R., Foley, R. J., Huber, M. E., Kessler, R., Narayan, G., Riess, A. G., et al. (2018) · The Astrophysical Journal · doi:10.3847/1538-4357/aab9bb · Cited by 2,700
Self-citationRiess, A. G., Yuan, W., Macri, L. M., Scolnic, D., Brout, D., Casertano, S., Jones, D. O., Murakami, Y., Anand, G. S., Breuval, L., et al. (2022) · The Astrophysical Journal Letters · doi:10.3847/2041-8213/ac5c5b · Cited by 2,380
Self-citationA 2.4% DETERMINATION OF THE LOCAL VALUE OF THE HUBBLE CONSTANT *
Riess, A. G., Macri, L. M., Hoffmann, S. L., Scolnic, D., Casertano, S., Filippenko, A. V., Tucker, B. E., Reid, M. J., Jones, D. O., Silverman, J. M., et al. (2016) · The Astrophysical Journal · doi:10.3847/0004-637x/826/1/56 · Cited by 2,250
Self-citationIn the realm of the Hubble tension—a review of solutions *
Di Valentino, E., Mena, O., Pan, S., Visinelli, L., Yang, W., Melchiorri, A., Mota, D. F., Riess, A. G., & Silk, J. (2021) · Classical and Quantum Gravity · doi:10.1088/1361-6382/ac086d · Cited by 2,065
Self-citationA 2.4% Determination of the Local Value of the Hubble Constant
Riess, A. G., Macri, L. M., Hoffmann, S., et al. (2016) · OakTrust (Texas A&M University Libraries) · doi:10.48550/arxiv.1604.01424 · Cited by 1,691
Self-citationWFPC2 Stellar Photometry with HSTphot
Dolphin, A. E. (2000) · Publications of the Astronomical Society of the Pacific · doi:10.1086/316630 · Cited by 1,012
Cited by
Sorted by citations
Challenges for Λ CDM: An update
Perivolaropoulos, L., & Skara, F. (2022) · New Astronomy Reviews · doi:10.1016/j.newar.2022.101659 · Cited by 1,130
Valentino, E. D., Said, J. L., Riess, A. G., Pollo, A., Poulin, V., Gómez-Valent, A., Weltman, A., Palmese, A., Huang, C. D., van de Bruck, C., et al. (2025) · Physics of the Dark Universe · doi:10.1016/j.dark.2025.101965 · Cited by 590
Self-citationPoulin, V., Smith, T. L., & Karwal, T. (2023) · Physics of the Dark Universe · doi:10.1016/j.dark.2023.101348 · Cited by 234
Freedman, W., Madore, B., Hoyt, T. J., Jang, I.-S., Lee, A. J., & Owens, K. A. (2025) · Astrophysical Journal · doi:10.3847/1538-4357/adce78 · Cited by 143
Tully, R. B., Kourkchi, E., Courtois, H. M., Anand, G. S., Blakeslee, J. P., Brout, D., de Jaeger, T., Dupuy, A., Guinet, D., Howlett, C., et al. (2023) · The Astrophysical Journal · doi:10.3847/1538-4357/ac94d8 · Cited by 142
Self-citationBanik, I., & Zhao, H. (2022) · Symmetry · doi:10.3390/sym14071331 · Cited by 159
Riess, A. G., Breuval, L., Yuan, W., Casertano, S., Macri, L. M., Bowers, J. B., Scolnic, D. M., Cantat-Gaudin, T., Anderson, R. I., & Reyes, M. C. (2022) · The Astrophysical Journal · doi:10.3847/1538-4357/ac8f24 · Cited by 139
Self-citationChallenges of the Standard Cosmological Model
Di Valentino, E. (2022) · Universe · doi:10.3390/universe8080399 · Cited by 125
Dark energy at early times and ACT data: A larger Hubble constant without late-time priors
Poulin, V., Smith, T. L., & Bartlett, A. (2021) · Physical Review D · doi:10.1103/physrevd.104.123550 · Cited by 112
Verde, L., Schöneberg, N., & Gil-Marín, H. (2024) · Annual Review of Astronomy and Astrophysics · doi:10.1146/annurev-astro-052622-033813 · Cited by 112
Riess, A. G., Scolnic, D. M., Anand, G. S., Breuval, L., Casertano, S., Macri, L. M., Li, S., Yuan, W., Huang, C. D., Jha, S. W., et al. (2024) · The Astrophysical Journal · doi:10.3847/1538-4357/ad8c21 · Cited by 112
Self-citationHints of early dark energy in Planck , SPT, and ACT data: New physics or systematics?
Smith, T. L., Lucca, M., Poulin, V., Abellán, G. F., Balkenhol, L., Benabed, K., Galli, S., & Murgia, R. (2022) · Physical review. D/Physical review. D. · doi:10.1103/physrevd.106.043526 · Cited by 99
Progress in direct measurements of the Hubble constant
Freedman, W. L., & Madore, B. F. (2023) · Journal of Cosmology and Astroparticle Physics · doi:10.1088/1475-7516/2023/11/050 · Cited by 87
CATS: The Hubble Constant from Standardized TRGB and Type Ia Supernova Measurements
Scolnic, D. M., Riess, A. G., Wu, J., Li, S., Anand, G. S., Beaton, R. L., Casertano, S., Anderson, R. I., Dhawan, S., & Ke, X. (2023) · The Astrophysical Journal Letters · doi:10.3847/2041-8213/ace978 · Cited by 85
Self-citationReview of Hubble tension solutions with new SH0ES and SPT-3G data
Khalife, A. R., Zanjani, M. B., Galli, S., Günther, S., Lesgourgues, J., & Benabed, K. (2024) · Journal of Cosmology and Astroparticle Physics · doi:10.1088/1475-7516/2024/04/059 · Cited by 80
Late-transition versus smooth H(z) -deformation models for the resolution of the Hubble crisis
Alestas, G., Camarena, D., Valentino, E. D., Kazantzidis, L., Marra, V., Nesseris, S., & Perivolaropoulos, L. (2022) · Physical review. D/Physical review. D. · doi:10.1103/physrevd.105.063538 · Cited by 78
Solà, J., Gómez-Valent, A., Pérez, J. D. C., & Moreno-Pulido, C. (2023) · Universe · doi:10.3390/universe9060262 · Cited by 77
A 5 per cent measurement of the Hubble–Lemaître constant from Type II supernovae
de Jaeger, T., Galbany, L., Riess, A. G., Stahl, B. E., Shappee, B. J., Filippenko, A. V., & Zheng, W. (2022) · Monthly Notices of the Royal Astronomical Society · doi:10.1093/mnras/stac1661 · Cited by 75
Self-citationOmnipotent dark energy: A phenomenological answer to the Hubble tension
Adil, S. A., Akarsu, Ö., Valentino, E. D., Nunes, R. C., Özülker, E., Sen, A. A., & Specogna, E. (2024) · Physical review. D/Physical review. D. · doi:10.1103/physrevd.109.023527 · Cited by 71
Simon, T., Zhang, P., Poulin, V., & Smith, T. L. (2023) · Physical review. D/Physical review. D. · doi:10.1103/physrevd.107.063505 · Cited by 72
SN H0pe: The First Measurement of H 0 from a Multiply Imaged Type Ia Supernova, Discovered by JWST
Pascale, M., Frye, B., Pierel, J. D. R., Chen, W., Kelly, P. L., Cohen, S. H., Windhorst, R. A., Riess, A. G., Kamieneski, P. S., Diego, J. M., et al. (2025) · The Astrophysical Journal · doi:10.3847/1538-4357/ad9928 · Cited by 68
Self-citationBAO+BBN revisited — growing the Hubble tension with a 0.7 km/s/Mpc constraint
Schöneberg, N., Verde, L., Gil-Marín, H., & Brieden, S. (2022) · Journal of Cosmology and Astroparticle Physics · doi:10.1088/1475-7516/2022/11/039 · Cited by 65
Jones, D. O., Mandel, K. S., Kirshner, R., Thorp, S., Challis, P., Avelino, A., Brout, D., Burns, C. R., Foley, R. J., Pan, Y. C., et al. (2022) · The Astrophysical Journal · doi:10.3847/1538-4357/ac755b · Cited by 57
Self-citationNiedermann, F., & Sloth, M. S. (2022) · Physical review. D/Physical review. D. · doi:10.1103/physrevd.105.063509 · Cited by 77
Valentino, E. D., Giarè, W., MELCHIORRI, A., & Silk, J. I. (2022) · Physical review. D/Physical review. D. · doi:10.1103/physrevd.106.103506 · Cited by 46
Cheng, H., Valentino, E. D., Escamilla, L. A., Sen, A. A., & Visinelli, L. (2025) · Journal of Cosmology and Astroparticle Physics · doi:10.1088/1475-7516/2025/09/031 · Cited by 46
The Mira Distance to M101 and a 4% Measurement of H 0
Huang, C. D., Yuan, W., Riess, A. G., Hack, W., Whitelock, P. A., Zakamska, N. L., Casertano, S., Macri, L. M., Marengo, M., Menzies, J. W., et al. (2024) · The Astrophysical Journal · doi:10.3847/1538-4357/ad1ff8 · Cited by 43
Self-citationAnderson, R. I., Koblischke, N. W., & Eyer, L. (2024) · The Astrophysical Journal Letters · doi:10.3847/2041-8213/ad284d · Cited by 43
Anand, G. S., Riess, A. G., Yuan, W., Beaton, R. L., Casertano, S., Li, S., Makarov, D. I., Makarova, L. N., Tully, R. B., Anderson, R. I., et al. (2024) · The Astrophysical Journal · doi:10.3847/1538-4357/ad2e0a · Cited by 43
Self-citationCasertano, S., Anand, G., Anderson, R. I., Beaton, R. L., Bhardwaj, A., Blakeslee, J. P., Boubel, P., Breuval, L., Brout, D., Cantiello, M., et al. (2026) · Astronomy and Astrophysics · doi:10.1051/0004-6361/202557993 · Cited by 40
Self-citationAn updated measurement of the Hubble constant from near-infrared observations of Type Ia supernovae
Galbany, L., de Jaeger, T., Riess, A. G., Müller-Bravo, T. E., Dhawan, S., Phan, K., Stritzinger, M. D., Karamehmetoglu, E., LEIBUNDGUT, B., Burns, C. R., et al. (2023) · Astronomy and Astrophysics · doi:10.1051/0004-6361/202244893 · Cited by 34
Self-citationSchöneberg, N., & Abellán, G. F. (2022) · Journal of Cosmology and Astroparticle Physics · doi:10.1088/1475-7516/2022/12/001 · Cited by 37
Exploring the Hubble tension with a late time Modified Gravity scenario
Escamilla, L. A., Fiorucci, D., Montani, G., & Valentino, E. D. (2024) · Physics of the Dark Universe · doi:10.1016/j.dark.2024.101652 · Cited by 41
Vogl, C., Taubenberger, S., Csörnyei, G., LEIBUNDGUT, B., Kerzendorf, W., Sim, S. A., Peterson, E. R., Courtois, H. M., Blondin, S., Flörs, A., et al. (2025) · Astronomy and Astrophysics · doi:10.1051/0004-6361/202452910 · Cited by 30
Kinetic model for dark energy—dark matter interaction: Scenario for the hubble tension
Montani, G., Carlevaro, N., Escamilla, L. A., & Valentino, E. D. (2025) · Physics of the Dark Universe · doi:10.1016/j.dark.2025.101848 · Cited by 26
Li, S., Casertano, S., & Riess, A. G. (2022) · The Astrophysical Journal · doi:10.3847/1538-4357/ac7559 · Cited by 26
Self-citationDhawan, S., Thorp, S., Mandel, K. S., Ward, S. M., Narayan, G., Jha, S. W., & Chant, T. (2023) · Monthly Notices of the Royal Astronomical Society · doi:10.1093/mnras/stad1590 · Cited by 26
Towards a possible solution to the Hubble tension with Horndeski gravity
Tiwari, Y., Ghosh, B., & Jain, R. K. (2024) · The European Physical Journal C · doi:10.1140/epjc/s10052-024-12577-0 · Cited by 26
The TRGB-SBF Project. I. A Tip of the Red Giant Branch Distance to the Fornax Cluster with JWST
Anand, G. S., Tully, R. B., Cohen, Y., Makarov, D. I., Makarova, L. N., Jensen, J. B., Blakeslee, J. P., Cantiello, M., Kourkchi, E., & Raimondo, G. (2024) · The Astrophysical Journal · doi:10.3847/1538-4357/ad64c7 · Cited by 23
Self-citationQuantifying Uncertainties on the Tip of the Red Giant Branch Method
Madore, B. F., Freedman, W. L., Owens, K. A., & Jang, I. S. (2023) · The Astronomical Journal · doi:10.3847/1538-3881/acd3f3 · Cited by 23
Wu, J., Scolnic, D. M., Riess, A. G., Anand, G. S., Beaton, R. L., Casertano, S., Ke, X., & Li, S. (2023) · The Astrophysical Journal · doi:10.3847/1538-4357/acdd7b · Cited by 21
Self-citationRunning Hubble constant: Evolutionary Dark Energy
Montani, G., Carlevaro, N., & Dainotti, M. G. (2025) · Physics of the Dark Universe · doi:10.1016/j.dark.2025.101847 · Cited by 21
Ramadan, O. F., Karwal, T., & Sakstein, J. (2024) · Physical review. D/Physical review. D. · doi:10.1103/physrevd.109.063525 · Cited by 20
Camilleri, R., Davis, T. M., Hinton, S. R., Armstrong, P., Brout, D., Galbany, L., Glazebrook, K., Lee, J., Lidman, C. E., Möller, A., et al. (2025) · Monthly Notices of the Royal Astronomical Society · doi:10.1093/mnras/staf122 · Cited by 19
Pseudoscalar sterile neutrino self-interactions in light of Planck, SPT and ACT data
Corona, M. A., Murgia, R., Cadeddu, M., Archidiacono, M., Gariazzo, S., Carlo Giunti, A., & Hannestad, S. (2022) · Journal of Cosmology and Astroparticle Physics · doi:10.1088/1475-7516/2022/06/010 · Cited by 18
Naik, D. M., Kavya, N. S., Sudharani, L., & Venkatesha, V. (2023) · Physics Letters B · doi:10.1016/j.physletb.2023.138117 · Cited by 18
Wong, K. C., Dux, F., Shajib, A. J., Suyu, S. H., Millon, M., Mozumdar, P., Wells, P. R., Agnello, A., Birrer, S., Buckley‐Geer, E., et al. (2024) · Astronomy and Astrophysics · doi:10.1051/0004-6361/202450979 · Cited by 18
Naik, D. M., Kavya, N. S., Sudharani, L., & Venkatesha, V. (2023) · The European Physical Journal C · doi:10.1140/epjc/s10052-023-12029-1 · Cited by 17
Li, S., Anand, G. S., Riess, A. G., Casertano, S., Yuan, W., Breuval, L., Macri, L. M., Scolnic, D. M., Beaton, R. L., & Anderson, R. I. (2024) · The Astrophysical Journal · doi:10.3847/1538-4357/ad84f3 · Cited by 17
Self-citationRelativistic corrections for measuring Hubble’s constant to 1% using stellar standard candles
Anderson, R. I. (2021) · Astronomy and Astrophysics · doi:10.1051/0004-6361/202141644 · Cited by 16
The properties of magnetised cold filaments in a cool-core galaxy cluster
Fournier, M., Grete, P., Brüggen, M., Glines, F. W., & O’Shea, B. W. (2024) · Astronomy and Astrophysics · doi:10.1051/0004-6361/202451031 · Cited by 16
Addressing Cosmological Tensions by Non-Local Gravity
Bouchè, F., Capozzıello, S., & Salzano, V. (2022) · Universe · doi:10.3390/universe9010027 · Cited by 16
Consistency of Type IIP supernova sibling distances
Csörnyei, G., Vogl, C., Taubenberger, S., Flörs, A., Blondin, S., Cudmani, M. G., Holas, A., Kressierer, S., LEIBUNDGUT, B., & Hillebrandt, W. (2023) · Astronomy and Astrophysics · doi:10.1051/0004-6361/202245379 · Cited by 15
Xie, Y., Chatterjee, D., Holder, G. P., HOLZ, D. E., Perkins, S., Yagi, K., & Yunes, N. (2023) · Physical review. D/Physical review. D. · doi:10.1103/physrevd.107.043010 · Cited by 15
Csörnyei, G., Anderson, R. I., Vogl, C., Taubenberger, S., Blondin, S., LEIBUNDGUT, B., & Hillebrandt, W. (2023) · Astronomy and Astrophysics · doi:10.1051/0004-6361/202346971 · Cited by 14
Jacoby, G. H., Ciardullo, R., Roth, M. M., Arnaboldi, M., & Weilbacher, P. M. (2024) · The Astrophysical Journal Supplement Series · doi:10.3847/1538-4365/ad2166 · Cited by 13
SN 2023ixf in the Pinwheel Galaxy M101: From Shock Breakout to the Nebular Phase
Zheng, W., Dessart, L., Filippenko, A. V., Yang, Y., Brink, T. G., de Jaeger, T., Vasylyev, S. S., Dyk, S. D. V., Patra, K. C., Jacobson-Galán, W. V., et al. (2025) · The Astrophysical Journal · doi:10.3847/1538-4357/ade0bf · Cited by 12
Visual tool for assessing tension-resolving models in the H0−σ8 plane
Pedreira, I. D. O. C., Benetti, M., Ferreira, E. G. M., Graef, L. L., & Herold, L. (2024) · Physical review. D/Physical review. D. · doi:10.1103/physrevd.109.103525 · Cited by 12
Sudharani, L., Bamba, K., Kavya, N. S., & Venkatesha, V. (2024) · Physics of the Dark Universe · doi:10.1016/j.dark.2024.101522 · Cited by 11
Hoyt, T. J., Jang, I. S., Freedman, W. L., Madore, B. F., Lee, A. J., & Owens, K. A. (2024) · The Astrophysical Journal · doi:10.3847/1538-4357/ad7952 · Cited by 11
Spatial curvature sensitivity to local H0 from the Cepheid distance ladder
Zuckerman, L., & Anchordoqui, L. A. (2021) · Journal of High Energy Astrophysics · doi:10.1016/j.jheap.2021.10.002 · Cited by 11
Li, S., Riess, A. G., Scolnic, D. M., Anand, G. S., Wu, J., Casertano, S., Yuan, W., Beaton, R. L., & Anderson, R. I. (2023) · The Astrophysical Journal · doi:10.3847/1538-4357/acf4fb · Cited by 11
Self-citationUpdated constraints on omnipotent dark energy: A comprehensive analysis with CMB and BAO data
Specogna, E., Adil, S. A., Özülker, E., Valentino, E. D., Nunes, R. C., Akarsu, Ö., & Sen, A. A. (2026) · Physical review. D/Physical review. D. · doi:10.1103/b7ht-lx26 · Cited by 13
Discord in Concordance Cosmology and Anomalously Massive Early Galaxies
McGaugh, S. (2024) · Universe · doi:10.3390/universe10010048 · Cited by 10
ΛsCDM cosmology from a type-II minimally modified gravity
Akarsu, Ö., Felice, A. D., Valentino, E. D., Kumar, S., Nunes, R. C., Özülker, E., Vazquez, J. A., & Yadav, A. (2025) · Monthly Notices of the Royal Astronomical Society · doi:10.1093/mnras/staf2276 · Cited by 20
The TRGB–SBF Project. II. Resolving the Virgo Cluster with JWST
Anand, G. S., Tully, R. B., Cohen, Y., Shaya, E. J., Makarov, D. I., Makarova, L. N., Chazov, M. I., Blakeslee, J. P., Cantiello, M., Jensen, J. B., et al. (2025) · The Astrophysical Journal · doi:10.3847/1538-4357/adb399 · Cited by 10
Self-citationTwo Dynamical Scenarios for Binned Master Sample Interpretation
Montani, G., Fazzari, E., Carlevaro, N., & Dainotti, M. G. (2025) · Entropy · doi:10.3390/e27090895 · Cited by 17
I. Linear interacting dark energy: Analytical solutions and theoretical pathologies
van der Westhuizen, M. A., Abebe, A., & Valentino, E. D. (2025) · Physics of the Dark Universe · doi:10.1016/j.dark.2025.102119 · Cited by 16
Exploring bulk viscous unified scenarios with gravitational waves standard sirens
Yang, W., Pan, S., Valentino, E. D., Escamilla‐Rivera, C., & Paliathanasis, A. (2023) · Monthly Notices of the Royal Astronomical Society · doi:10.1093/mnras/stad115 · Cited by 10
A geometric calibration of the tip of the red giant branch in the Milky Way using Gaia DR3
Dixon, M. E., Mould, J. R., Flynn, C., Taylor, E. N., Lidman, C. E., & Duffy, A. R. (2023) · Monthly Notices of the Royal Astronomical Society · doi:10.1093/mnras/stad1500 · Cited by 9
Hubble Constant, S 8, and Sound Horizon Tensions: A Study Within the Teleparallel Framework
Mishra, S. S., & Sahoo, P. K. (2025) · Progress of Theoretical and Experimental Physics · doi:10.1093/ptep/ptaf134 · Cited by 8
Li, S., Riess, A. G., Anand, G. S., Scolnic, D. M., Murakami, Y. S., Brout, D., & Peterson, E. R. (2026) · The Astrophysical Journal · doi:10.3847/1538-4357/ae1f17 · Cited by 8
Self-citationRevisiting CPL with sign-switching density: To cross or not to cross the NECB
Gökçen, M., Akarsu, Ö., & Valentino, E. D. (2026) · Physics of the Dark Universe · doi:10.1016/j.dark.2026.102273 · Cited by 23
The Hubble Constant: A Historical Review
Tully, R. B. (2024) · Springer Series in Astrophysics and Cosmology · doi:10.1007/978-981-99-0177-7_2 · Cited by 8
Self-citationConsequences of using a smooth cosmic distance in a lumpy universe. I.
Umeh, O. (2022) · Physical review. D/Physical review. D. · doi:10.1103/physrevd.106.023514 · Cited by 8
Aspects of Everpresent Λ. Part II. Cosmological tests of current models
Das, S., Nasiri, A., & Yazdi, Y. K. (2024) · Journal of Cosmology and Astroparticle Physics · doi:10.1088/1475-7516/2024/10/076 · Cited by 10
dos Santos, F. B. M., Morais, J., Pan, S., Yang, W., & Valentino, E. D. (2026) · Journal of Cosmology and Astroparticle Physics · doi:10.1088/1475-7516/2026/07/022 · Cited by 7
The red giant branch tip in the SDSS, PS1, JWST, NGRST, and Euclid photometric systems
Bellazzini, M., & Pascale, R. (2024) · Astronomy and Astrophysics · doi:10.1051/0004-6361/202449575 · Cited by 7
Forconi, M., & Valentino, E. D. (2025) · Physics of the Dark Universe · doi:10.1016/j.dark.2025.101904 · Cited by 7
Corasaniti, P.-S., Brun, A. M. C. L., Richardson, T. R. G., Rasera, Y., Ettori, S., Arnaud, M., & Pratt, G. W. (2022) · Monthly Notices of the Royal Astronomical Society · doi:10.1093/mnras/stac2196 · Cited by 7
Hoyt, T. J., Jang, I. S., Freedman, W. L., Madore, B. F., Owens, K. A., & Lee, A. J. (2026) · The Astrophysical Journal · doi:10.3847/1538-4357/ae29eb · Cited by 6
Shao, Z., Wang, S. M., Jiang, B., Wang, X., Ge, Z., & 祝, H. 海. Z. (2025) · The Astrophysical Journal · doi:10.3847/1538-4357/adae8e · Cited by 6
Koblischke, N. W., & Anderson, R. I. (2024) · The Astrophysical Journal · doi:10.3847/1538-4357/ad7095 · Cited by 6
Measuring the Hubble Constant through the Galaxy Pairwise Peculiar Velocity
Zhang, W., Chu, M. C., Liao, S., Yeung, S., & Hu, H. (2024) · The Astrophysical Journal Letters · doi:10.3847/2041-8213/ad9aa7 · Cited by 5
ΛsCDM cosmology from a type-II minimally modified gravity
Akarsu, Ö., Felice, A. D., Valentino, E. D., Kumar, S., Nunes, R. C., Özülker, E., Vazquez, J. A., & Yadav, A. (2026) · White Rose Research Online (University of Leeds, The University of Sheffield, University of York) · Cited by 5
Large-scale peculiar velocities in the universe
Tsagas, C. G., Perivolaropoulos, L., & Asvesta, K. (2026) · Physics Reports · doi:10.1016/j.physrep.2026.03.001 · Cited by 5
Challenges to a sharp change in G as a solution to the Hubble tension
Banik, I., Desmond, H., & Samaras, N. (2025) · Monthly Notices of the Royal Astronomical Society · doi:10.1093/mnras/staf567 · Cited by 5
Early-time spectroscopic modelling of the transitional Type Ia Supernova 2021rhu with tardis
Harvey, L., Maguire, K., Magee, M., Bulla, M., Dhawan, S., Schulze, S., Sollerman, J., Deckers, M., Dimitriadis, G., Reusch, S., et al. (2023) · Monthly Notices of the Royal Astronomical Society · doi:10.1093/mnras/stad1226 · Cited by 5
Lu, X., Zhu, C., Lü, G., Guo, S., Li, Z., & Zhao, G. (2025) · Physical review. D/Physical review. D. · doi:10.1103/physrevd.111.103004 · Cited by 5
Constraining fifth forces using the local distance ladder: Implications for the Hubble tension
Högås, M., Mörtsell, E., Desmond, H., & Riess, A. G. (2026) · Physical review. D/Physical review. D. · doi:10.1103/j4yp-9m6h · Cited by 3
Self-citationRevisiting the Hubble Constant, Sound Horizon, and Cosmography from Late-time Universe Observations
Yang, Z., Liu, T., & Li, X. (2025) · The Astrophysical Journal · doi:10.3847/1538-4357/adb7e5 · Cited by 3
Consistencies and inconsistencies in redshift-independent distances
Nájera, J. A., & Desmond, H. (2025) · Monthly Notices of the Royal Astronomical Society · doi:10.1093/mnras/staf1005 · Cited by 3
Nonlinear matter power spectrum from relativistic N -body simulations: Λ s CDM versus Λ CDM
Akarsu, Ö., Valentino, E. D., Vyskocil, J., Y𝚤lmaz, E., Yükselci, A. E., & Zhuk, A. (2026) · Physical review. D/Physical review. D. · doi:10.1103/lmt4-hshz · Cited by 5
A Review on Resolving the Hubble Tension via Late-Universe Physics
Jia, X.-D., Dai, X.-Y., Yang, Y., & Wang, F. Y. (2026) · Galaxies · doi:10.3390/galaxies14030055 · Cited by 2
Intertwined constraints in extended cosmologies: Dark energy, curvature, neutrinos, and inflation
Giarè, W., Lee, D. H., & Valentino, E. D. (2026) · New Astronomy Reviews · doi:10.1016/j.newar.2026.101759 · Cited by 15
Turner, R. J., & Blake, C. (2023) · Monthly Notices of the Royal Astronomical Society · doi:10.1093/mnras/stad2713 · Cited by 2
Can future CMB data discriminate between a cosmological constant and dynamical dark energy?
Ferri, A. C., & MELCHIORRI, A. (2025) · Journal of High Energy Astrophysics · doi:10.1016/j.jheap.2025.100504 · Cited by 1
Tang, Y., Anand, G. S., Romanowsky, A. J., van Dokkum, P., & Bundy, K. A. (2026) · The Astrophysical Journal Letters · doi:10.3847/2041-8213/ae77ef · Cited by 1
Self-citation“Supernovae Ia Twins” in the Hubble Flow, and the Determination of H 0
Ruiz-Lapuente, P., Quintana, A., Hernández, J. I. G., & Pastorello, A. (2026) · The Astrophysical Journal · doi:10.3847/1538-4357/ae632a · Cited by 1
The Tip of the Red Giant Branch as a Cosmological Tool
Lee, M. G. (2022) · Proceedings of the International Astronomical Union · doi:10.1017/s1743921323002685 · Cited by 1
Metadata
- Authors
- Anand, G. S., Tully, R. B., Rizzi, L., Riess, A. G., & Yuan, W.
- Affiliations
- University of Hawaiʻi at Mānoa (US)
- W.M. Keck Observatory (US)
- Space Telescope Science Institute (US)
- Johns Hopkins University (US)
- Corresponding author
- Anand, Gagandeep S.
- Venue
- The Astrophysical Journal
- Publisher
- American Astronomical Society
- Published
- 2022-06-01
- Volume
- 932
- Issue
- 1
- Pages
- 15
- ISSN
- 0004-637X (ISSN-L)
- 1538-4357
- OpenAlex
- W3187894162
- Cited by
- 109
- References
- 72
- Citations by year
- 2026: 16 · 2025: 23 · 2024: 27 · 2023: 22 · 2022: 18
- FWCI
- 9.00
- Type
- journal article
- Language
- en
- Open access
- gold
- doi.org
- Licence
- Locations
- The Astrophysical Journal (publishedVersion, cc-by)
- arXiv (Cornell University) (submittedVersion)
- arXiv (Cornell University)
- Funders
- HST (SNAP-15922)
- Topics
- Physical Sciences › Physics and Astronomy › Astronomy and Astrophysics › Cosmology and Gravitation Theories
- Physical Sciences › Physics and Astronomy › Astronomy and Astrophysics › Stellar, planetary, and galactic studies
- Physical Sciences › Physics and Astronomy › Astronomy and Astrophysics › Galaxies: Formation, Evolution, Phenomena
- Keywords
- tip of the red giant branch, Hubble constant, asymptotic giant branch stars, Type Ia supernovae, Pantheon sample, Carnegie Supernova Project, surface brightness fluctuations, Hubble Space Telescope imaging
About these checks
Registry, retraction, Cites and statistics results are computed, not judged, with one exception: a printed reference that no index lists is read once by a model before it counts as a citation error. Claims are extracted by a model and kept only when their quote appears verbatim in the text; each cited source is then checked, with a model’s help, for whether it says what the claim relies on. Those verdicts can be wrong — read the claim’s quote and the cited source before relying on one.
Statistics and arithmetic are recomputed, not judged.
Confidence bands are shown only for fields calibrated on our annotated test set. None is calibrated yet, so no band is shown.
What counts as a claim ›How we measure confidence ›How we check this ›
Are you an author, or do you see a problem with this page? Request a review
