

The DOI matches its Crossref record; 2 of the 2 references it cites were found in a registry or an index.
Effects of transcription factor EB on oxidative stress and apoptosis induced by high glucose in podocytes
Overview
The claims and statistics of this paper haven’t been checked yet.
Run the check — free, no account needed. It reads the open-access text and checks the sources it cites.
Integrity signals
Registry
Cites
Statistics
Figures
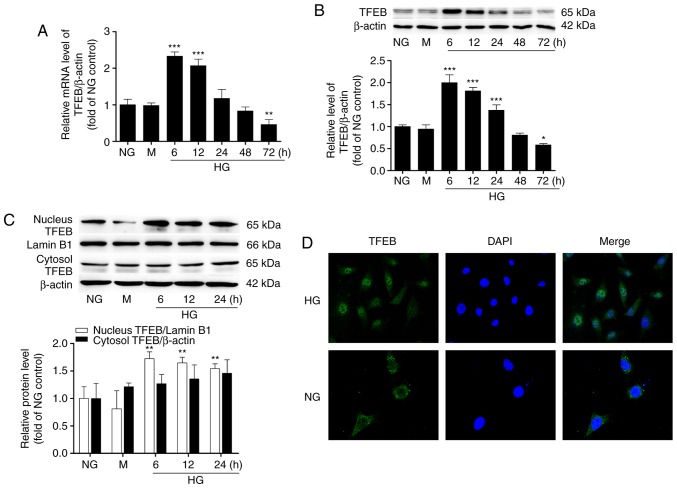
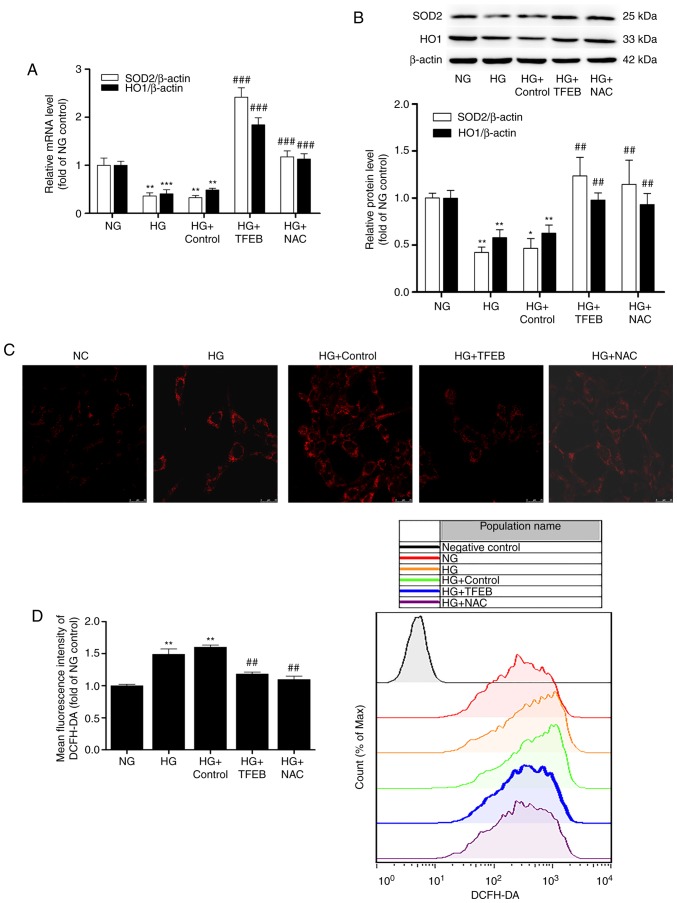
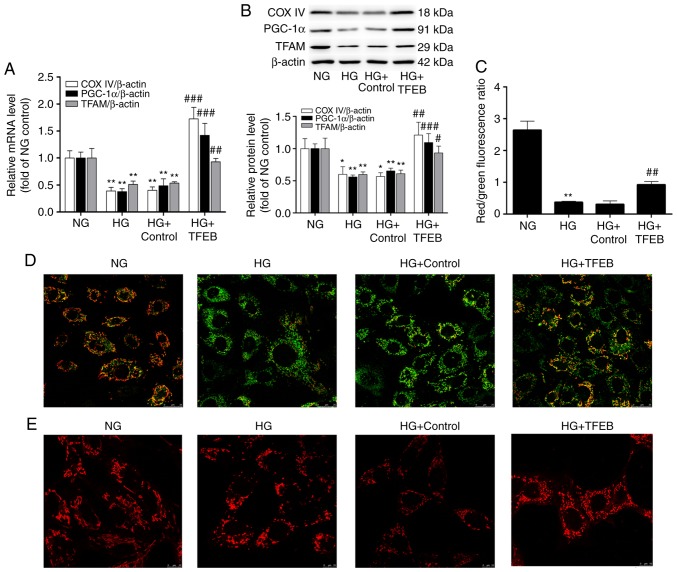
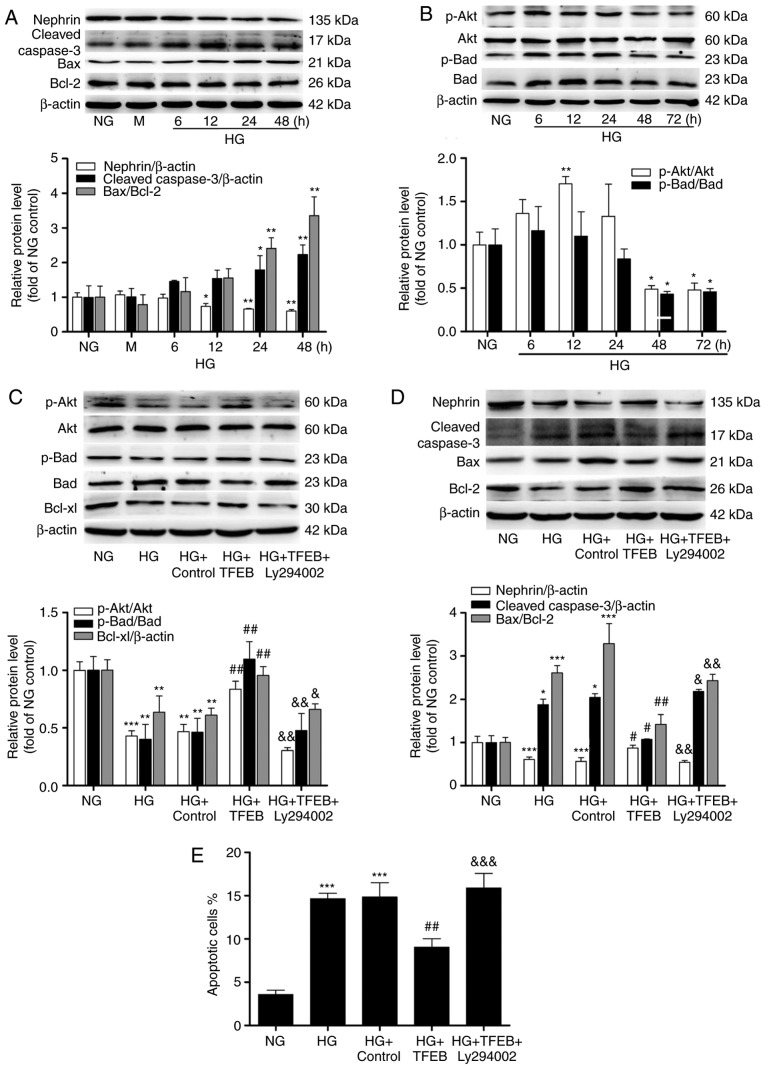
Verification
Claims the paper makes
The claims and statistics of this paper haven’t been checked yet.
Run the check — free, no account needed. It reads the open-access text and checks the sources it cites.
Claims other papers make about this one
Each is checked against this paper’s own text: does it say what the citing paper says it does?
The source backs part of the claim, not all of it — or backs it for a different population, condition or comparison.
In the citing paper
“We and others have recently reported activation of TFEB and TFE3 in response to oxidative stress both in vivo and in vitro23–25, as well as their involvement in the expression of antioxidant genes26.”
From TMEM55B links autophagy flux, lysosomal repair, and TFE3 activation in response to oxidative stress (2024) · cites this paper as [24]
Experimental — accuracy not yet measured
Self-check
Percentages, sums and reported differences re-computed from the paper’s own numbers.
The self-check needs the paper’s full text.
Citations
Cites
MCOLN1 is a ROS sensor in lysosomes that regulates autophagy
Zhang, X., Cheng, X., Yu, L., Yang, J., Calvo, R., Patnaik, S., Hu, X., Gao, Q., Yang, M., Lawas, M., et al. (2016) · Nature Communications · doi:10.1038/ncomms12109 · Cited by 558
Mitochondrial and lysosomal biogenesis are activated following PINK 1/parkin‐mediated mitophagy
Ivankovic, D., Chau, K., Schapira, A. H. V., & Gegg, M. E. (2016) · Journal of Neurochemistry · doi:10.1111/jnc.13412 · Cited by 264
Research works printed but not linked: 40
- Afkarian, 2013, Kidney disease and increased mortality risk in type 2 diabetes, J Am Soc Nephrol, 24, 302, 10.1681/ASN.2012070718 · DOI · Paper page
- Collins, 2014, US Renal Data System 2013 Annual Data Report, Am J Kidney Dis, 63, A7, 10.1053/j.ajkd.2013.11.001 · DOI
- Ogurtsova, 2017, IDF Diabetes Atlas: Global estimates for the prevalence of diabetes for 2015-2040, Diabetes Res Clin Pract, 128, 40, 10.1016/j.diabres.2017.03.024 · DOI
- Kawakami, 2013, Wnt signalling in kidney diseases: Dual roles in renal injury and repair, J Pathol, 229, 221, 10.1002/path.4121 · DOI
- Conti, 2018, Early and late scanning electron microscopy findings in diabetic kidney disease, Sci Rep, 8, 4909, 10.1038/s41598-018-23244-2 · DOI
- Khazim, 2013, The antioxidant silybin prevents high glucose-induced oxidative stress and podocyte injury in vitro and in vivo, Am J Physiol Renal Physiol, 305, F691, 10.1152/ajprenal.00028.2013 · DOI
- Newsholme, 2007, Diabetes associated cell stress and dysfunction: Role of mitochondrial and non-mitochondrial ROS production and activity, J Physiol, 583, 9, 10.1113/jphysiol.2007.135871 · DOI · Paper page
- Claussen, 2013, D-methionine pre-loading reduces both noise-induced permanent threshold shift and outer hair cell loss in the chinchilla, Int J Audiol, 52, 801, 10.3109/14992027.2013.840933 · DOI
- Tsukagoshi, 2010, Transcriptional regulation of ROS controls transition from proliferation to differentiation in the root, Cell, 143, 606, 10.1016/j.cell.2010.10.020 · DOI
- Fubini, 2003, Reactive oxygen species (ROS) and reactive nitrogen species (RNS) generation by silica in inflammation and fibrosis, Free Radic Biol Med, 34, 1507, 10.1016/S0891-5849(03)00149-7 · DOI · Paper page
- Yang, 1998, Detection of reactive oxygen species (ROS) and apoptosis in human fragmented embryos, Hum Reprod, 13, 998, 10.1093/humrep/13.4.998 · DOI
- Brownlee, 2001, Biochemistry and molecular cell biology of diabetic complications, Nature, 414, 813, 10.1038/414813a · DOI · Paper page
- Kim, 2005, Exposure to chronic high glucose induces beta-cell apoptosis through decreased interaction of glucokinase with mitochondria: Downregulation of glucokinase in pancreatic beta-cells, Diabetes, 54, 2602, 10.2337/diabetes.54.9.2602 · DOI
- Steingrimsson, 2004, Melanocytes and the microphthalmia transcription factor network, Annu Rev Genet, 38, 365, 10.1146/annurev.genet.38.072902.092717 · DOI
- Sardiello, 2009, A gene network regulating lysosomal biogenesis and function, Science, 325, 473, 10.1126/science.1174447 · DOI · Paper page
- Settembre, 2011, TFEB links autophagy to lysosomal biogenesis, Science, 332, 1429, 10.1126/science.1204592 · DOI · Paper page
- Erlich, 2018, Exercise induces TFEB expression and activity in skeletal muscle in a PGC-1α-dependent manner, Am J Physiol Cell Physiol, 314, C62, 10.1152/ajpcell.00162.2017 · DOI
- Martina, 2016, TFEB and TFE3 are novel components of the integrated stress response, EMBO J, 35, 479, 10.15252/embj.201593428 · DOI · Paper page
- Pastore, 2016, TFEB and TFE3 cooperate in the regulation of the innate immune response in activated macrophages, Autophagy, 12, 1240, 10.1080/15548627.2016.1179405 · DOI · Paper page
- Peres, 2017, Impact of high glucose and AGEs on cultured kidney-derived cells. Effects on cell viability, lysosomal enzymes and effectors of cell signaling pathways, Biochimie, 135, 137, 10.1016/j.biochi.2017.02.004 · DOI
- Alghamdi, 2017, Janus kinase 2 regulates transcription factor EB expression and autophagy completion in glomerular podocytes, J Am Soc Nephrol, 28, 2641, 10.1681/ASN.2016111208 · DOI · Paper page
- Covington, 2012, Chronic high glucose downregulates mitochondrial calpain 10 and contributes to renal cell death and diabetes-induced renal injury, Kidney Int, 81, 391, 10.1038/ki.2011.356 · DOI
- Hou, 2015, CD36 is involved in high glucose-induced epithelial to mesenchymal transition in renal tubular epithelial cells, Biochem Biophys Res Commun, 468, 281, 10.1016/j.bbrc.2015.10.112 · DOI
- Ito, 2017, Protein tyrosine phosphatase 1B deficiency in podocytes mitigates hyperglycemia-induced renal injury, Metabolism, 76, 56, 10.1016/j.metabol.2017.07.009 · DOI
- Livak, 2001, Analysis of relative gene expression data using real-time quantitative PCR and the 2(−Delta Delta C(T)) Method, Methods, 25, 402, 10.1006/meth.2001.1262 · DOI · Paper page
- Trivedi, 2016, Glucolipotoxicity diminishes cardiomyocyte TFEB and inhibits lysosomal autophagy during obesity and diabetes, Biochim Biophys Acta, 1861, 1893, 10.1016/j.bbalip.2016.09.004 · DOI
- Tseng, 2017, Lysosomal Ca2+ signaling regulates high glucose-mediated interleukin-1β secretion via transcription factor EB in human monocytic cells, Front Immunol, 8, 1161, 10.3389/fimmu.2017.01161 · DOI
- Yoneshima, 2016, The transcription factor EB (TFEB) regulates osteoblast differentiation through ATF4/CHOP-dependent pathway, J Cell Physiol, 231, 1321, 10.1002/jcp.25235 · DOI
- Lu, 2017, TFEB inhibits endothelial cell inflammation and reduces atherosclerosis, Sci Signal, 10, 10.1126/scisignal.aah4214 · DOI
- Ma, 2015, Regulation of the transcription factor EB-PGC1α axis by beclin-1 controls mitochondrial quality and cardiomyocyte death under stress, Mol Cell Biol, 35, 956, 10.1128/MCB.01091-14 · DOI
- Aquilano, 2010, Peroxisome proliferator-activated receptor gamma co-activator 1alpha (PGC-1alpha) and sirtuin 1 (SIRT1) reside in mitochondria: Possible direct function in mitochondrial biogenesis, J Biol Chem, 285, 21590, 10.1074/jbc.M109.070169 · DOI
- Zsengellér, 2016, The use of cytochrome C oxidase enzyme activity and immunohistochemistry in defining mitochondrial injury in kidney disease, J Histochem Cytochem, 64, 546, 10.1369/0022155416660291 · DOI
- Nezich, 2015, MiT/TFE transcription factors are activated during mitophagy downstream of Parkin and Atg5, J Cell Biol, 210, 435, 10.1083/jcb.201501002 · DOI · Paper page
- Zhang, 2014, Zinc modulates high glucose-induced apoptosis by suppressing oxidative stress in renal tubular epithelial cells, Biol Trace Elem Res, 158, 259, 10.1007/s12011-014-9922-x · DOI
- Zhang, 2016, Berberine activates Nrf2 nuclear translocation and inhibits apoptosis induced by high glucose in renal tubular epithelial cells through a phosphatidylinositol 3-kinase/Akt-dependent mechanism, Apoptosis, 21, 721, 10.1007/s10495-016-1234-5 · DOI
- Zeng, 2011, Hyperoside protects primary rat cortical neurons from neurotoxicity induced by amyloid β-protein via the PI3K/Akt/Bad/Bcl(XL)-regulated mitochondrial apoptotic pathway, Eur J Pharmacol, 672, 45, 10.1016/j.ejphar.2011.09.177 · DOI
- Tao, 2017, Exosomes derived from human platelet-rich plasma prevent apoptosis induced by glucocorticoid-associated endoplasmic reticulum stress in rat osteonecrosis of the femoral head via the Akt/Bad/Bcl-2 signal pathway, Theranostics, 7, 733, 10.7150/thno.17450 · DOI
- Wang, 2014, Interplay between the Notch and PI3K/Akt pathways in high glucose-induced podocyte apoptosis, Am J Physiol Renal Physiol, 306, F205, 10.1152/ajprenal.90005.2013 · DOI
- Nishihama, 2018, Anti-apoptotic activity of human matrix metalloproteinase-2 attenuates diabetes mellitus, Metabolism, 82, 88, 10.1016/j.metabol.2018.01.016 · DOI
- Mansueto, 2017, Transcription factor EB controls metabolic flexibility during exercise, Cell Metab, 25, 182, 10.1016/j.cmet.2016.11.003 · DOI · Paper page
Cited by
Sorted by citations
TMEM55B links autophagy flux, lysosomal repair, and TFE3 activation in response to oxidative stress
Jeong, E., Willett, R., Rissone, A., La Spina, M., & Puertollano, R. (2024) · Nature Communications · doi:10.1038/s41467-023-44316-6 · Cited by 25
Metadata
- Authors
- Kang, Y., Li, Y., Zhang, T., Chi, Y., & Liu, M.
- Affiliations
- Department of Nephrology, The Third Hospital of Hebei Medical University, Shijiazhuang, Hebei 050051, P.R. China
- Venue
- International Journal of Molecular Medicine
- Publisher
- Spandidos Publications
- Published
- 2019-05-24
- ISSN
- 1107-3756
- 1791-244X
- PMC
- PMC6605469
- Cited by
- 7
- References
- 2
About these checks
Registry, retraction, Cites and statistics results are computed, not judged, with one exception: a printed reference that no index lists is read once by a model before it counts as a citation error. Claims are extracted by a model and kept only when their quote appears verbatim in the text; each cited source is then checked, with a model’s help, for whether it says what the claim relies on. Those verdicts can be wrong — read the claim’s quote and the cited source before relying on one.
Statistics and arithmetic are recomputed, not judged.
Confidence bands are shown only for fields calibrated on our annotated test set. None is calibrated yet, so no band is shown.
What counts as a claim ›How we measure confidence ›How we check this ›
Are you an author, or do you see a problem with this page? Request a review
