

The DOI matches its Crossref record; 30 of the 30 references it cites were found in a registry or an index.
Transforming growth factor‑β1 functions as a competitive endogenous RNA that ameliorates intracranial hemorrhage injury by sponging microRNA‑93‑5p
Abstract
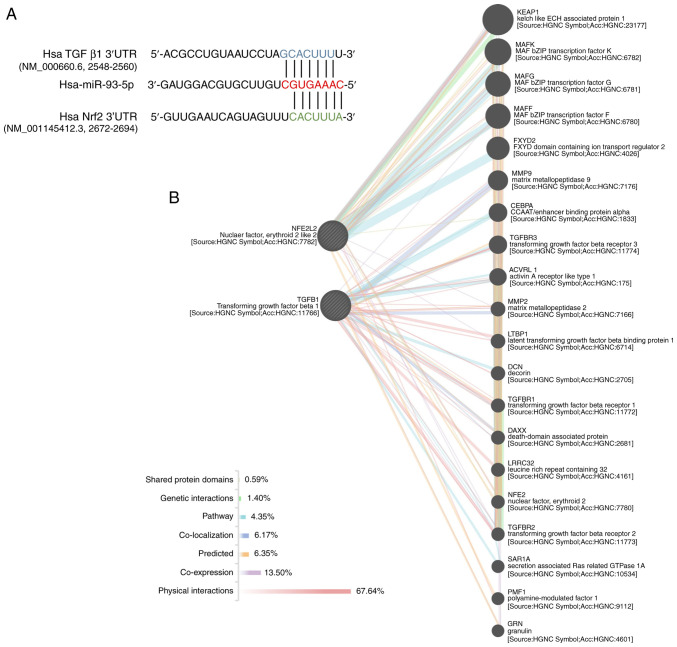
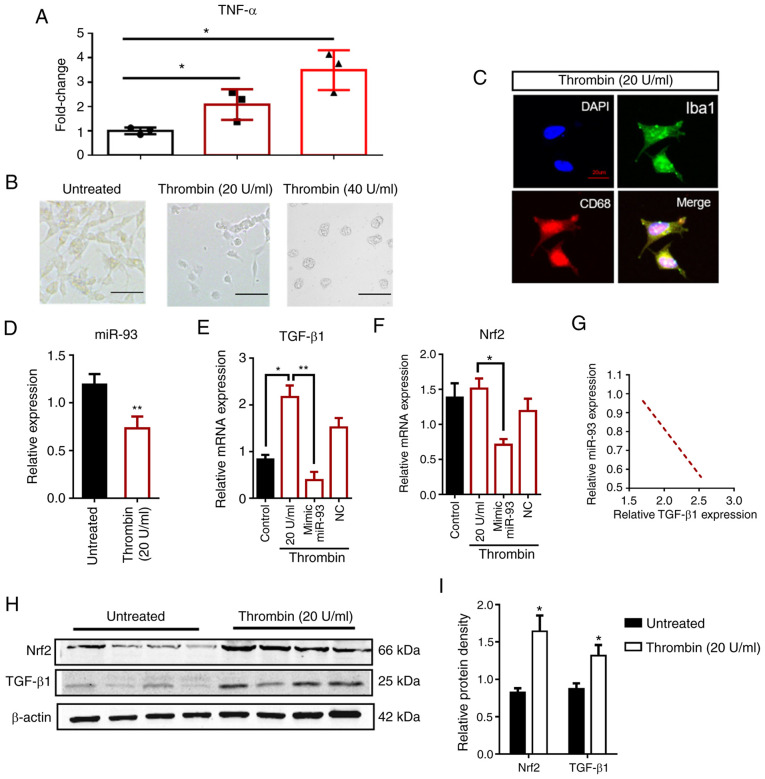
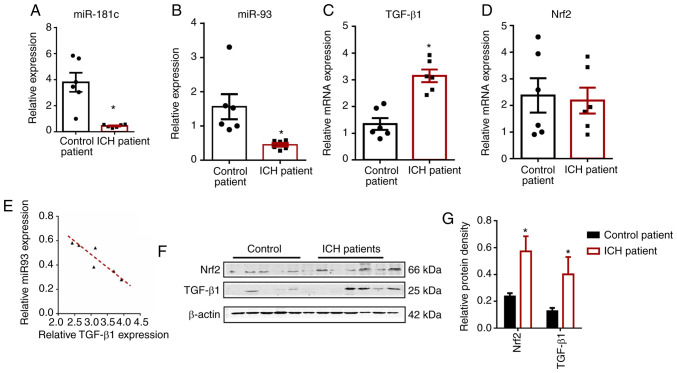
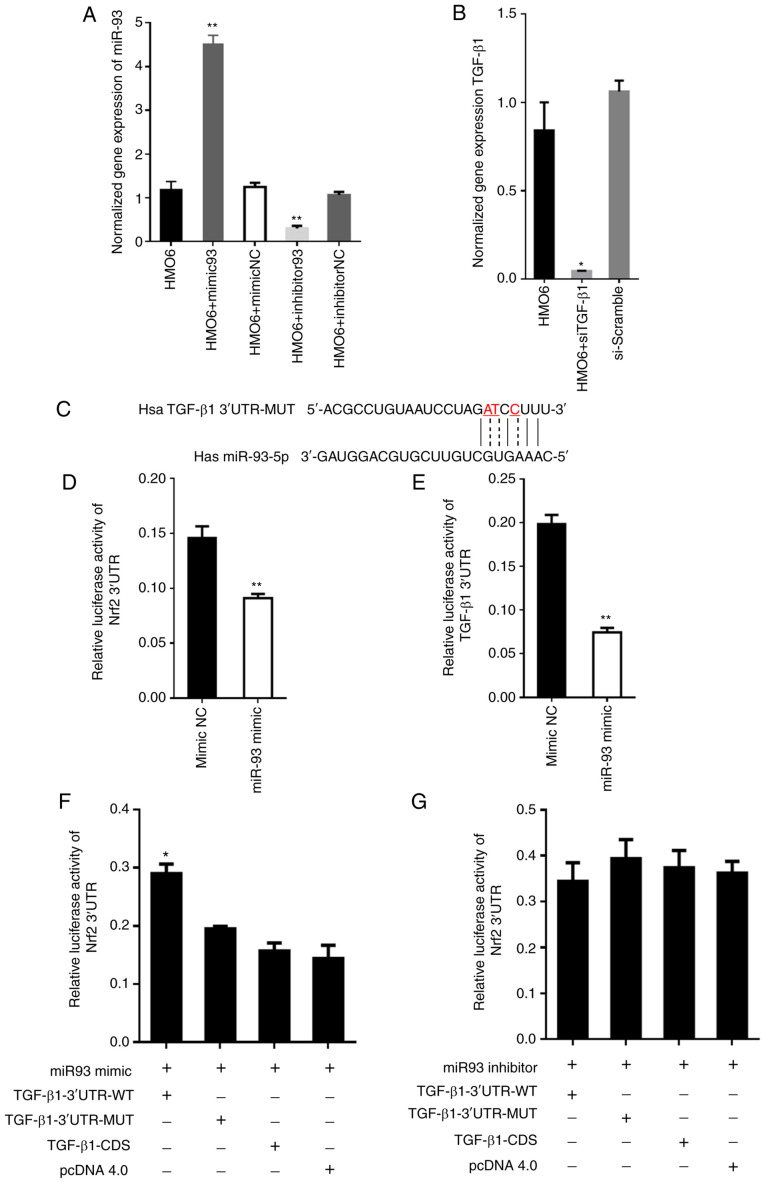
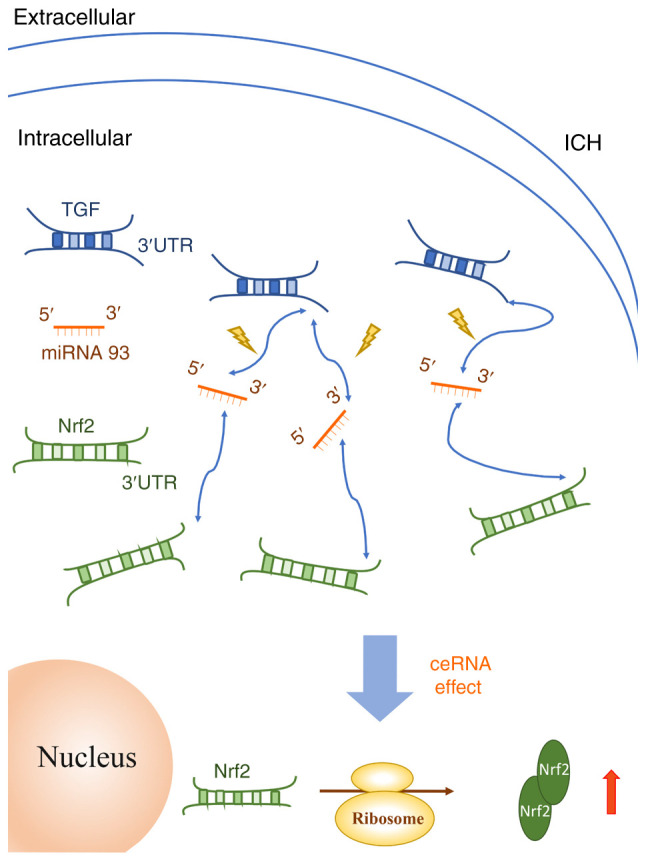
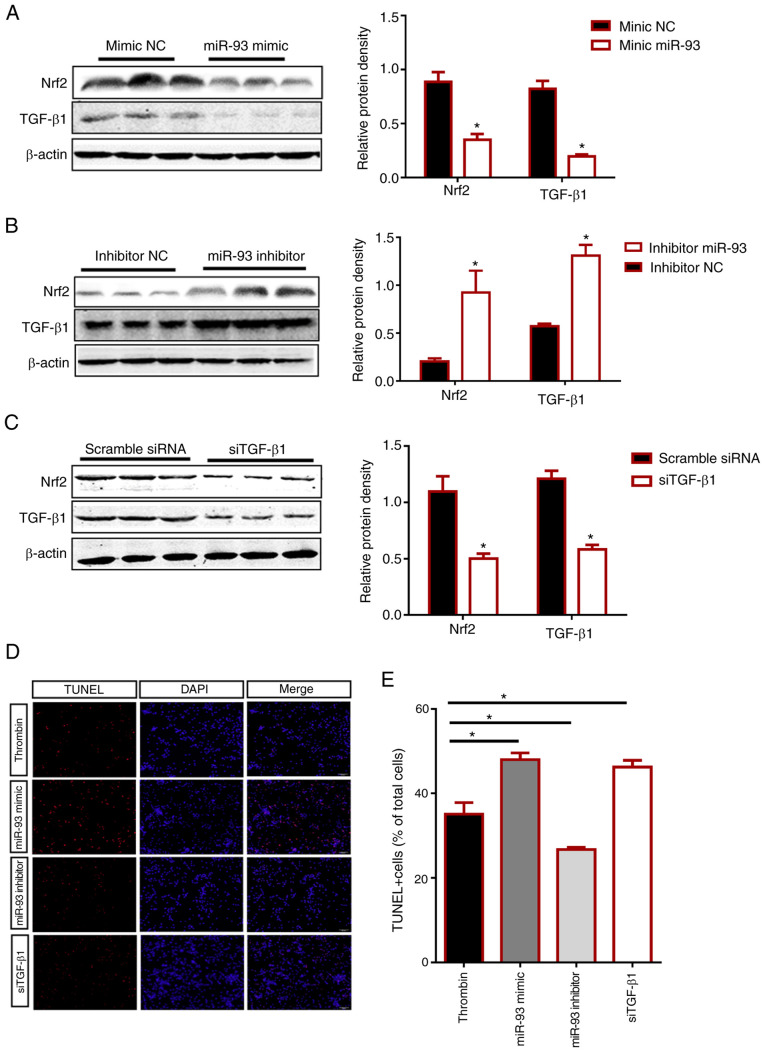
Intracerebral hemorrhage (ICH) has the highest mortality rate of all stroke subtypes but an effective treatment has yet to be clinically implemented. Transforming growth factor‑β1 (TGF‑β1) has been reported to modulate microglia‑mediated neuroinflammation after ICH and promote functional recovery; however, the underlying mechanisms remain unclear. Non‑coding RNAs such as microRNAs (miRNAs) and competitive endogenous RNAs (ceRNAs) have surfaced as critical regulators in human disease. A known miR‑93 target, nuclear factor erythroid 2‑related factor 2 (Nrf2), has been shown to be neuroprotective after ICH. It was hypothesized that TGF‑β1 functions as a ceRNA that sponges miR‑93‑5p and thereby ameliorates ICH injury in the brain. Short interfering RNA (siRNA) was used to knock down TGF‑β1 and miR‑93 expression was also pharmacologically manipulated to elucidate the mechanistic association between miR‑93‑5p, Nrf2, and TGF‑β1 in an in vitro model of ICH (thrombin‑treated human microglial HMO6 cells). Bioinformatics predictive analyses showed that miR‑93‑5p could bind to both TGF‑β1 and Nrf2. It was found that neuronal miR‑93‑5p was dramatically decreased in these HMO6 cells, and similar changes were observed in fresh brain tissue from patients with ICH. Most importantly, luciferase reporter assays were used to demonstrate that miR‑93‑5p directly targeted Nrf2 to inhibit its expression and the addition of the TGF‑β1 untranslated region restored the levels of Nrf2. Moreover, an miR‑93‑5p inhibitor increased the expression of TGF‑β1 and Nrf2 and decreased apoptosis. Collectively, these results identified a novel function of TGF‑β1 as a ceRNA that sponges miR‑93‑5p to increase the expression of neuroprotective Nrf2 and decrease cell death after ICH. The present findings provided evidence to support miR‑93‑5p as a potential therapeutic target for the treatment of ICH.
Overview
The claims and statistics of this paper haven’t been checked yet.
Run the check — free, no account needed. It reads the open-access text and checks the sources it cites.
Integrity signals
Registry
Cites
Statistics
Figures
Verification
Claims the paper makes
The claims and statistics of this paper haven’t been checked yet.
Run the check — free, no account needed. It reads the open-access text and checks the sources it cites.
Claims other papers make about this one
Each is checked against this paper’s own text: does it say what the citing paper says it does?
The source backs part of the claim, not all of it — or backs it for a different population, condition or comparison.
In the citing paper
“Wang et al. reported that elevated miR-93-5p exacerbated microglia-mediated neuroinflammation and delayed the recovery of neurological function following intracerebral hemorrhage [60].”
From M2 microglia-derived small extracellular vesicles modulate NSC fate after ischemic stroke via miR-25-3p/miR-93-5p-TGFBR/PTEN/FOXO3 axis (2025) · cites this paper as [60]
Experimental — accuracy not yet measured
Self-check
Percentages, sums and reported differences re-computed from the paper’s own numbers.
The self-check needs the paper’s full text.
Citations
Cites
MicroRNAs: Target Recognition and Regulatory Functions
Bartel, D. P. (2009) · Cell · doi:10.1016/j.cell.2009.01.002 · Cited by 20,068
A ceRNA Hypothesis: The Rosetta Stone of a Hidden RNA Language?
Salmena, L., Poliseno, L., Tay, Y., Kats, L., & Pandolfi, P. P. (2011) · Cell · doi:10.1016/j.cell.2011.07.014 · Cited by 7,262
Microglial Responses after Ischemic Stroke and Intracerebral Hemorrhage
Taylor, R. A., & Sansing, L. H. (2013) · Clinical and Developmental Immunology · doi:10.1155/2013/746068 · Cited by 394
GeneMANIA: Fast gene network construction and function prediction for Cytoscape
Montojo, J., Zuberi, K., Rodriguez, H., Bader, G. D., & Morris, Q. (2014) · F1000Research · doi:10.12688/f1000research.4572.1 · Cited by 274
RASTINEJAD, F. (1993) · Cell · doi:10.1016/0092-8674(93)90579-f · Cited by 240
Transcription Factor Nrf2 Protects the Brain From Damage Produced by Intracerebral Hemorrhage
Zhao, X., Sun, G., Zhang, J., Strong, R., Dash, P. K., Kan, Y. W., Grotta, J. C., & Aronowski, J. A. (2007) · Stroke · doi:10.1161/strokeaha.107.486506 · Cited by 231
Expression of distinct RNAs from 3′ untranslated regions
Mercer, T. R., Wilhelm, D., Dinger, M. E., Soldà, G., Korbie, D. J., Glazov, E. A., Truong, V., Schwenke, M., Simons, C., Matthaei, K. I., et al. (2010) · Nucleic Acids Research · doi:10.1093/nar/gkq1158 · Cited by 225
Wang, X., Liu, D., Huang, H.-Z., Wang, Z.-H., Hou, T.-Y., Yang, X., Pang, P., Wei, N., Zhou, Y.-F., Dupras, M.-J., et al. (2018) · Biological Psychiatry · doi:10.1016/j.biopsych.2017.07.023 · Cited by 205
MicroRNA-93 regulates NRF2 expression and is associated with breast carcinogenesis
Singh, B. P., Ronghe, A. M., Chatterjee, A., Bhat, N. K., & Bhat, H. K. (2013) · Carcinogenesis · doi:10.1093/carcin/bgt026 · Cited by 201
(‐)‐Epicatechin protects hemorrhagic brain via synergistic Nrf2 pathways
Chang, C.-F., Cho, S., & Wang, J. (2014) · Annals of Clinical and Translational Neurology · doi:10.1002/acn3.54 · Cited by 186
Research works printed but not linked: 20
- [3]Moses HL Roberts AB Derynck R The discovery and early days of TGF-β: A historical perspective Cold Spring Harb Perspect Biol 8 a021865 2016 10.1101/cshperspect.a021865 27328871 PMC4930926 · DOI
- [5]Gordon KJ Blobe GC Role of transforming growth factor-beta superfamily signaling pathways in human disease Biochim Biophys Acta 1782 197 228 2008 10.1016/j.bbadis.2008.01.006 18313409 · DOI · Paper page
- [6]Brionne TC Tesseur I Masliah E Wyss-Coray T Loss of TGF-beta 1 leads to increased neuronal cell death and microgliosis in mouse brain Neuron 40 1133 1145 2003 10.1016/S0896-6273(03)00766-9 14687548 · DOI · Paper page
- [7]Wyss-Coray T Borrow P Brooker MJ Mucke L Astroglial overproduction of TGF-beta 1 enhances inflammatory central nervous system disease in transgenic mice J Neuroimmunol 77 45 50 1997 10.1016/S0165-5728(97)00049-0 9209267 · DOI
- [10]Buisson A Lesne S Docagne F Ali C Nicole O MacKenzie ET Vivien D Transforming growth factor-beta and ischemic brain injury Cell Mol Neurobiol 23 539 550 2003 10.1023/A:1025072013107 14514014 PMC11530161 · DOI
- [11]Kumar P Kumar A Misra S Sagar R Farooq M Kumari R Vivekanandhan S Srivastava AK Prasad K Association of transforming growth factor-β1 gene C509T, G800A and T869C polymorphisms with intracerebral hemorrhage in North Indian Population: A case-control study Neurol Sci 37 353 359 2016 10.1007/s10072-015-2426-4 26621360 · doi:10.1007/s10072-015-2426-4
- [12]Chen J Bai Q Zhao Z Sui H Xie X Ginsenoside represses symptomatic intracerebral hemorrhage after recombinant tissue plasminogen activator therapy by promoting transforming growth factor-beta1 J Stroke Cerebrovasc Dis 25 549 555 2016 10.1016/j.jstrokecerebrovasdis.2015.11.004 26683593 · DOI
- [13]Zeng J Chen Y Ding R Feng L Fu Z Yang S Deng X Xie Z Zheng S Isoliquiritigenin alleviates early brain injury after experimental intracerebral hemorrhage via suppressing ROS- and/or NF-κB-mediated NLRP3 inflammasome activation by promoting Nrf2 antioxidant pathway J Neuroinflammation 14 119 2017 10.1186/s12974-017-0895-5 28610608 PMC5470182 · DOI · Paper page
- [16]Zhao X Sun G Ting SM Song S Zhang J Edwards NJ Aronowski J Cleaning up after ICH: The role of Nrf2 in modulating microglia function and hematoma clearance J Neurochem 133 144 152 2015 10.1111/jnc.12974 25328080 PMC4361377 · DOI
- [19]Lee RC Feinbaum RL Ambros V The C. elegans heterochronic gene lin-4 encodes small RNAs with antisense complementarity to lin-14 Cell 75 843 854 1993 10.1016/0092-8674(93)90529-Y 8252621 · DOI · Paper page
- [21]Fabbri E Borgatti M Montagner G Bianchi N Finotti A Lampronti I Bezzerri V Dechecchi MC Cabrini G Gambari R Expression of microRNA-93 and Interleukin-8 during Pseudomonas aeruginosa-mediated induction of proinflammatory responses Am J Respir Cell Mol Biol 50 1144 1155 2014 10.1165/rcmb.2013-0160OC 24433094 · DOI
- [25]Lyu X Fang W Cai L Zheng H Ye Y Zhang L Li J Peng H Cho WC Wang E TGFβR2 is a major target of miR-93 in nasopharyngeal carcinoma aggressiveness Mol Cancer 13 51 2014 10.1186/1476-4598-13-51 24606633 PMC4016586 · doi:10.1186/1476-4598-13-51
- [26]Ma J Zhang L Hao J Li N Tang J Hao L Up-regulation of microRNA-93 inhibits TGF-β1-induced EMT and renal fibrogenesis by down-regulation of Orai1 J Pharmacol Sci 136 218 227 2018 10.1016/j.jphs.2017.12.010 29551286 · doi:10.1016/j.jphs.2017.12.010
- [32]Livak KJ Schmittgen TD Analysis of relative gene expression data using real-time quantitative PCR and the 2(-Delta Delta C(T)) Method Methods 25 402 408 2001 10.1006/meth.2001.1262 11846609 · DOI · Paper page
- [33]Qi W Chen X Holian J Mreich E Twigg S Gilbert RE Pollock CA Transforming growth factor-beta1 differentially mediates fibronectin and inflammatory cytokine expression in kidney tubular cells Am J Physiol Renal Physiol 291 F1070 F1077 2006 10.1152/ajprenal.00013.2006 16720864 · DOI
- [38]Yin M Chen Z Ouyang Y Zhang H Wan Z Wang H Wu W Yin X Thrombin-induced, TNFR-dependent miR-181c downregulation promotes MLL1 and NF-κB target gene expression in human microglia J Neuroinflammation 14 132 2017 10.1186/s12974-017-0887-5 28662718 PMC5492717 · DOI
- [42]Rastinejad F Conboy MJ Rando TA Blau HM Tumor suppression by RNA from the 3′ untranslated region of alpha-tropomyosin Cell 75 1107 1117 1993 10.1016/0092-8674(93)90320-P 7505203 · DOI
- [46]Taylor RA Chang CF Goods BA Hammond MD Mac Grory B Ai Y Steinschneider AF Renfroe SC Askenase MH McCullough LD TGF-β1 modulates microglial phenotype and promotes recovery after intracerebral hemorrhage J Clin Invest 127 280 292 2017 10.1172/JCI88647 27893460 PMC5199690 · DOI · Paper page
- [47]Qu MH Han C Srivastava AK Cui T Zou N Gao ZQ Wang QE miR-93 promotes TGF-β-induced epithelial-to-mesenchymal transition through downregulation of NEDD4L in lung cancer cells Tumour Biol 37 5645 5651 2016 10.1007/s13277-015-4328-8 26581907 PMC6528179 · DOI
- [48]Yin XP Chen ZY Zhou J Wu D Bao B Mechanisms underlying the perifocal neuroprotective effect of the Nrf2-ARE signaling pathway after intracranial hemorrhage Drug Des Devel Ther 9 5973 5986 2015 26604696 PMC4655949
Cited by
Zhang, Q., Yi, Y., Chen, T., Ai, Y., Chen, Z., Liu, G., Tang, Z., Chen, J., Xu, T., Chen, X., et al. (2025) · Journal of Nanobiotechnology · doi:10.1186/s12951-025-03390-2 · Cited by 27
Self-citation
Metadata
- Authors
- Wang, H., Cao, X., Wen, X., Li, D., Ouyang, Y., Bao, B., Zhong, Y., Qin, Z., Yin, M., Chen, Z., & Yin, X.
- Affiliations
- Department of Neurology, The Affiliated Hospital of Jiujiang University, Jiujiang, Jiangxi 332000, P.R. China
- Department of Neurology, Jiangxi Provincial People's Hospital, Nanchang, Jiangxi 330006, P.R. China
- Department of Neurology, The Second Affiliated Hospital of Nanchang University, Nanchang, Jiangxi 330006, P.R. China
- Venue
- Molecular Medicine Reports
- Publisher
- Spandidos Publications
- Published
- 2021-05-06
- Volume
- 24
- Issue
- 1
- ISSN
- 1791-2997
- 1791-3004
- PMC
- PMC8127068
- Cited by
- 19
- References
- 30
About these checks
Registry, retraction, Cites and statistics results are computed, not judged, with one exception: a printed reference that no index lists is read once by a model before it counts as a citation error. Claims are extracted by a model and kept only when their quote appears verbatim in the text; each cited source is then checked, with a model’s help, for whether it says what the claim relies on. Those verdicts can be wrong — read the claim’s quote and the cited source before relying on one.
Statistics and arithmetic are recomputed, not judged.
Confidence bands are shown only for fields calibrated on our annotated test set. None is calibrated yet, so no band is shown.
What counts as a claim ›How we measure confidence ›How we check this ›
Are you an author, or do you see a problem with this page? Request a review
Data sources
Bibliographic data: Semantic Scholar, OpenAlex, Crossref.
Contains information from the Semantic Scholar Academic Graph Datasets, made available under the ODC Attribution License (ODC-BY 1.0).
Semantic Scholar’s data is described in: Kinney, R., et al. (2023). The Semantic Scholar Open Data Platform. arXiv:2301.10140.
