Cited by 155

The DOI matches its Crossref record; 2 of the 2 references it cites were found in a registry or an index.

Macroautophagy is deregulated in murine and human lupus T lymphocytes

Gros, Frédéric, Arnold, Johan, Page, Nicolas, Décossas, Marion, Korganow, Anne-Sophie, Martin, Thierry, Muller, Sylviane·2012·Autophagy

Overview

The claims and statistics of this paper haven’t been checked yet.

Run the check — free, no account needed. It reads the open-access text and checks the sources it cites.

A few free checks a day · papers already verified open instantly · results are public

Integrity signals

Registry

Crossref · 10.4161/auto.20275

Cites

2 of 2 references verified0 citation errors · 0 not checkable

Statistics

Figures

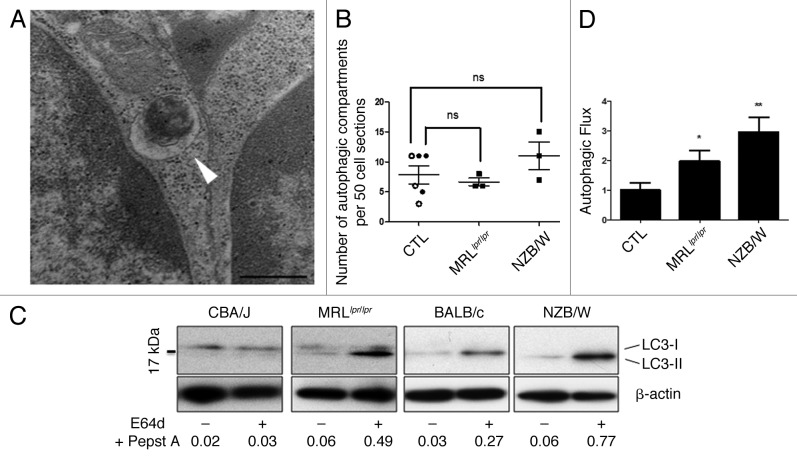
Figure 1. Increased autophagic flux in thymocytes from lupus-prone mice compared with controls (A) A representative autophagosome is indicated by the white arrow (black scale bar: 500 nm). (B) Quantification by TEM of autophagic vacuoles for 50 thymocyte sections randomly selected on thymus sections from 8 week-old CBA/J (open circles) and 12 week-old BALB/c (filled circles) control mice (CTL) and lupus-prone mice MRLlpr/lpr (8 week-old) and NZB/W (12 week-old). Each point represents measurement for an individual mouse. Central bars refer to the mean and vertical bars stand for standard deviation. ns = non-significant using unpaired t-test. (C) LC3 conversion assessed by western immunoblotting. Dissociated thymocytes obtained from 8 week-old control CBA/J and lupus MRLlpr/lpr mice or from 12 week-old control BALB/c and lupus NZB/W mice were cultured at 37°C for 16h. When indicated, cells were treated (+) or not (-) during the last 4 h of the culture with 5 µg/mL pepstatin A and 5 µg/mL E64d to block lysosomal degradation. Cell lysates were resolved by SDS-PAGE, transferred onto PVDF membranes before staining with anti-LC3 Ab. Loading controls were performed by staining actin β-chain. Each immunoblot is representative of three experiments with identical results. LC3-II/β-actin band intensity ratios are indicated as numbers under each immunoblot. (D) LC3-II levels were evaluated by densitometry and normalized to β-actin band intensities for at least three other independent experiments (right panel). Autophagic flux measurement consists on a ratio between the values with and without protease inhibitors (= autophagic flux). Histogram bars represent the means of individual experiments with standard errors. *p < 0.05 and **p < 0.01 using unpaired t-test between control and lupus conditions.
Figure 1. Increased autophagic flux in thymocytes from lupus-prone mice compared with controls (A) A representative autophagosome is indicated by the white arrow (black scale bar: 500 nm). (B) Quantification by TEM of autophagic vacuoles for 50 thymocyte sections randomly selected on thymus sections from 8 week-old CBA/J (open circles) and 12 week-old BALB/c (filled circles) control mice (CTL) and lupus-prone mice MRLlpr/lpr (8 week-old) and NZB/W (12 week-old). Each point represents measurement for an individual mouse. Central bars refer to the mean and vertical bars stand for standard deviation. ns = non-significant using unpaired t-test. (C) LC3 conversion assessed by western immunoblotting. Dissociated thymocytes obtained from 8 week-old control CBA/J and lupus MRLlpr/lpr mice or from 12 week-old control BALB/c and lupus NZB/W mice were cultured at 37°C for 16h. When indicated, cells were treated (+) or not (-) during the last 4 h of the culture with 5 µg/mL pepstatin A and 5 µg/mL E64d to block lysosomal degradation. Cell lysates were resolved by SDS-PAGE, transferred onto PVDF membranes before staining with anti-LC3 Ab. Loading controls were performed by staining actin β-chain. Each immunoblot is representative of three experiments with identical results. LC3-II/β-actin band intensity ratios are indicated as numbers under each immunoblot. (D) LC3-II levels were evaluated by densitometry and normalized to β-actin band intensities for at least three other independent experiments (right panel). Autophagic flux measurement consists on a ratio between the values with and without protease inhibitors (= autophagic flux). Histogram bars represent the means of individual experiments with standard errors. *p < 0.05 and **p < 0.01 using unpaired t-test between control and lupus conditions.CC BY-NC · PubMed Central
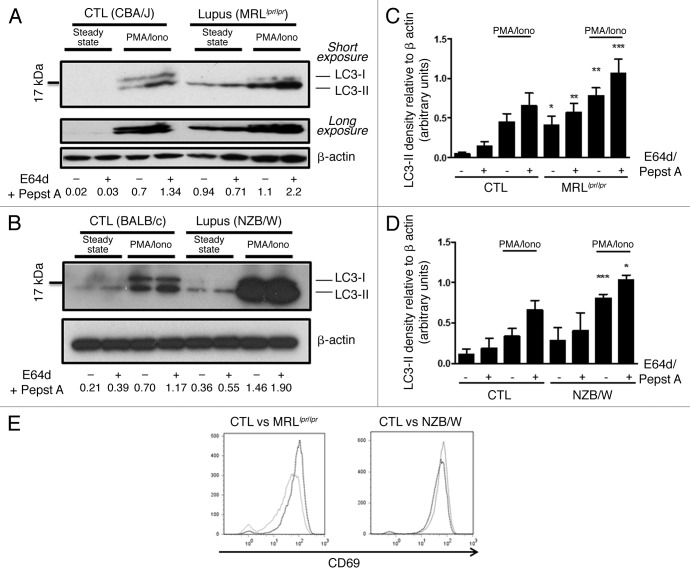
Figure 2. Autophagic activity in peripheral T cells from lupus-prone mice is raised compared with controls T cells sorted from spleens obtained from 8–12 week-old control CBA/J and lupus MRLlpr/lpr mice (A) or from 12–20 week-old control BALB/c and lupus NZB/W mice (B) were left unstimulated (steady-state) or stimulated by 50 ng/mL PMA and 1 µM Ionomycin (PMA/Iono) at 37°C for 16h. When indicated, cells were treated (+) or not (-) during the last 4 h of the culture with 5 µg/mL pepstatin A and 5 µg/mL E64d to block lysosomal degradation. Cell lysates were resolved by SDS-PAGE, transferred onto PVDF membranes before staining with anti-LC3 Ab. Loading controls were performed by staining actin-β chain. Each immunoblot is representative of at least five independent experiments with identical results. *Band corresponding to the Ig heavy chain retained in lysates obtained from oldest lupus mice. LC3-II/β-actin band intensity ratios are indicated as numbers under each immunoblot. (C and D) LC3-II levels were evaluated by densitometry and normalized to β-actin band intensities for at least five independent experiments. Histogram bars represent the means of individual experiments with standard errors. *p < 0.05, **p < 0.01, ***p < 0.001 using paired t-test between control and lupus conditions. Activation of sorted T cells from control and lupus mice was assessed by flow cytometry with CD69 staining (E). Dotted black lines and solid gray lines represent respectively control and lupus mice.
Figure 2. Autophagic activity in peripheral T cells from lupus-prone mice is raised compared with controls T cells sorted from spleens obtained from 8–12 week-old control CBA/J and lupus MRLlpr/lpr mice (A) or from 12–20 week-old control BALB/c and lupus NZB/W mice (B) were left unstimulated (steady-state) or stimulated by 50 ng/mL PMA and 1 µM Ionomycin (PMA/Iono) at 37°C for 16h. When indicated, cells were treated (+) or not (-) during the last 4 h of the culture with 5 µg/mL pepstatin A and 5 µg/mL E64d to block lysosomal degradation. Cell lysates were resolved by SDS-PAGE, transferred onto PVDF membranes before staining with anti-LC3 Ab. Loading controls were performed by staining actin-β chain. Each immunoblot is representative of at least five independent experiments with identical results. *Band corresponding to the Ig heavy chain retained in lysates obtained from oldest lupus mice. LC3-II/β-actin band intensity ratios are indicated as numbers under each immunoblot. (C and D) LC3-II levels were evaluated by densitometry and normalized to β-actin band intensities for at least five independent experiments. Histogram bars represent the means of individual experiments with standard errors. *p < 0.05, **p < 0.01, ***p < 0.001 using paired t-test between control and lupus conditions. Activation of sorted T cells from control and lupus mice was assessed by flow cytometry with CD69 staining (E). Dotted black lines and solid gray lines represent respectively control and lupus mice.CC BY-NC · PubMed Central
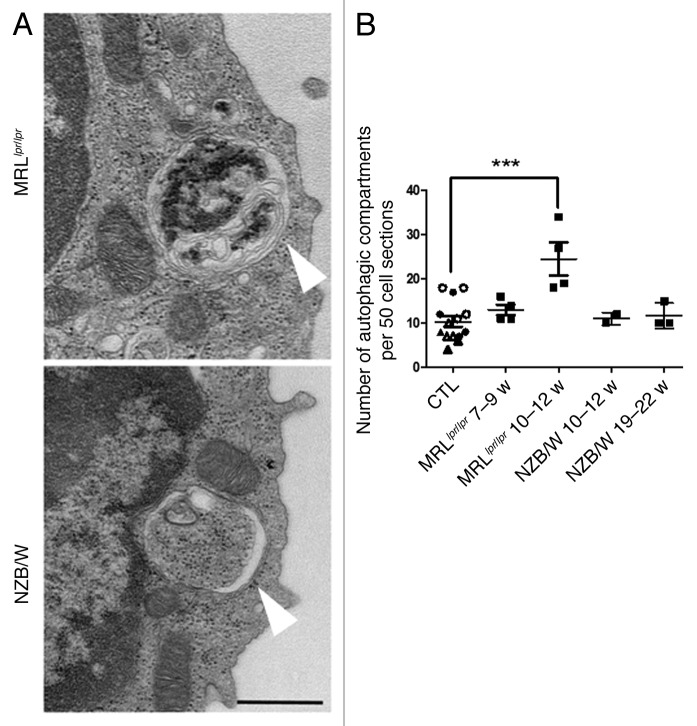
Figure 3. Increased number of autophagic vacuoles in peripheral T cells isolated from lupus mice compared with control mice. (A) Representative autophagic vacuoles indicated by white arrows, in peripheral T cells from lupus MRLlpr/lpr and NZB/W mice. Scale bar stands for both images (black scale bar: 500 nm). (B) Quantification by TEM of autophagosomes counted in 50 peripheral T lymphocyte sections sorted from spleens of control (7–8 week-old CBA/J mice (open circles), 10–12 week-old CBA/J mice (filled circles), 10–12 week-old BALB/c mice (open triangles) and 20–22 week-old BALB/c mice (filled triangles), MRLlpr/lpr and NZB/W lupus mice. Mice were sacrificed at the indicated ages. Each point represents measurement of an individual mouse. Central bars refer to the mean and vertical bars stand for standard deviation. ***p < 0.001 using unpaired t-test, w = week.
Figure 3. Increased number of autophagic vacuoles in peripheral T cells isolated from lupus mice compared with control mice. (A) Representative autophagic vacuoles indicated by white arrows, in peripheral T cells from lupus MRLlpr/lpr and NZB/W mice. Scale bar stands for both images (black scale bar: 500 nm). (B) Quantification by TEM of autophagosomes counted in 50 peripheral T lymphocyte sections sorted from spleens of control (7–8 week-old CBA/J mice (open circles), 10–12 week-old CBA/J mice (filled circles), 10–12 week-old BALB/c mice (open triangles) and 20–22 week-old BALB/c mice (filled triangles), MRLlpr/lpr and NZB/W lupus mice. Mice were sacrificed at the indicated ages. Each point represents measurement of an individual mouse. Central bars refer to the mean and vertical bars stand for standard deviation. ***p < 0.001 using unpaired t-test, w = week.CC BY-NC · PubMed Central
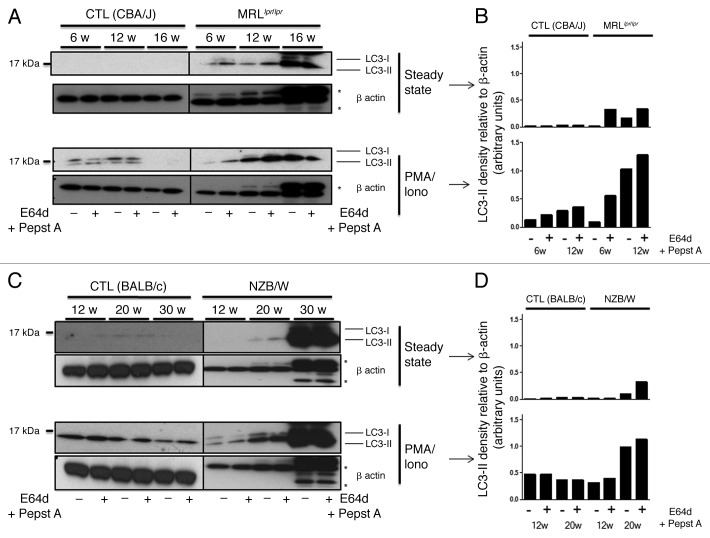
Figure 4. Autophagic activity in peripheral T cells increases with age in lupus-prone mice in contrast to control mice. T cells were sorted from spleens obtained from control (CBA/J) and lupus MRLlpr/lpr mice (A) or control (BALB/c) and lupus NZB/W mice (C) that were sacrificed at the indicated ages indicated in weeks. Cells were left unstimulated (steady-state) or stimulated with 50 ng/mL PMA and 1 µM Ionomycin (PMA/Iono) at 37°C for 16 h. When indicated, cells were treated (+) or not (-) during the last 4 h of culture with 5 µg/mL pepstatin A and 5 µg/mL E64d to block lysosomal degradation. Cell lysates were resolved by SDS-PAGE, transferred onto PVDF membranes before staining with anti-LC3 Ab. Loading controls were performed by staining actin-β chain. Each immunoblot is representative of three experiments with identical results. *Bands corresponding to Ig heavy and light chains retained in lysates obtained from oldest lupus mice. (B and D) LC3-II levels of immunoblots shown in (A and C) were evaluated by densitometry for the indicated ages and normalized to β-actin band intensities.
Figure 4. Autophagic activity in peripheral T cells increases with age in lupus-prone mice in contrast to control mice. T cells were sorted from spleens obtained from control (CBA/J) and lupus MRLlpr/lpr mice (A) or control (BALB/c) and lupus NZB/W mice (C) that were sacrificed at the indicated ages indicated in weeks. Cells were left unstimulated (steady-state) or stimulated with 50 ng/mL PMA and 1 µM Ionomycin (PMA/Iono) at 37°C for 16 h. When indicated, cells were treated (+) or not (-) during the last 4 h of culture with 5 µg/mL pepstatin A and 5 µg/mL E64d to block lysosomal degradation. Cell lysates were resolved by SDS-PAGE, transferred onto PVDF membranes before staining with anti-LC3 Ab. Loading controls were performed by staining actin-β chain. Each immunoblot is representative of three experiments with identical results. *Bands corresponding to Ig heavy and light chains retained in lysates obtained from oldest lupus mice. (B and D) LC3-II levels of immunoblots shown in (A and C) were evaluated by densitometry for the indicated ages and normalized to β-actin band intensities.CC BY-NC · PubMed Central
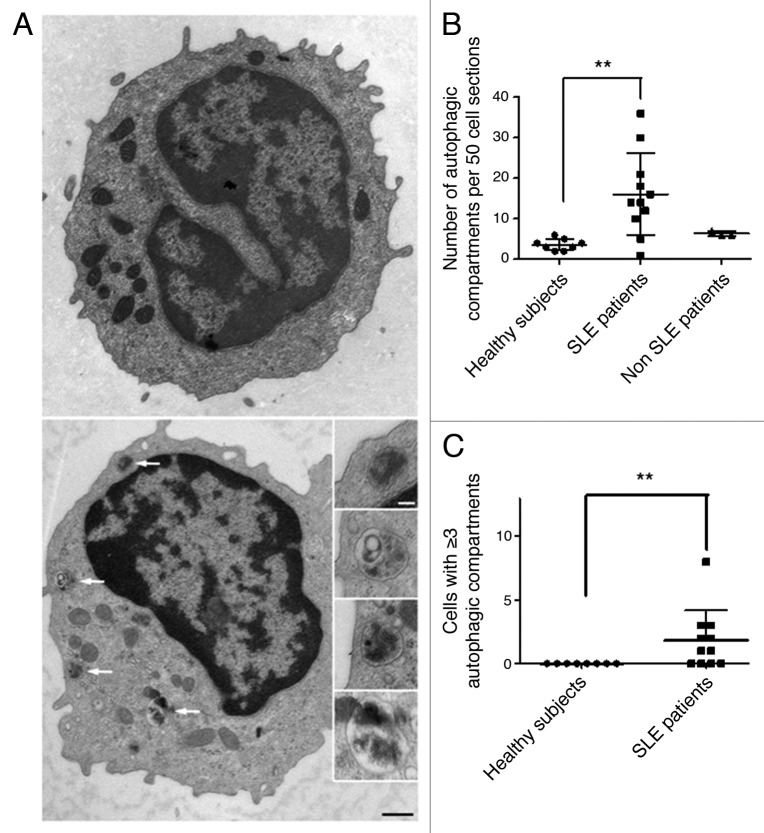
Figure 5. Increased number of autophagic vacuoles in peripheral T cells from SLE patients compared with healthy subjects (A) An example of a cell with a high number of autophagic vacuoles (black scale bar: 500 nm). Magnifications of identified autophagic structures are shown on the right side. The white scale bar (100 nm) stands for all the magnified images (B) Double-blind quantification of autophagic vacuoles in peripheral T cells isolated from the PBMC fraction obtained from healthy donors, patients with SLE or with other autoimmune diseases (Sjögren’s syndrome and vasculitis). Autophagic vacuoles were counted in 50 T lymphocyte sections. (C) Cell sections containing three or more autophagic vacuoles were counted for each subject. Each point represents the result for one subject. Central bars refer to the means and vertical bars stand for standard deviation. **p < 0.01 using unpaired t-test (in B) or Mann-Whitney U test.
Figure 5. Increased number of autophagic vacuoles in peripheral T cells from SLE patients compared with healthy subjects (A) An example of a cell with a high number of autophagic vacuoles (black scale bar: 500 nm). Magnifications of identified autophagic structures are shown on the right side. The white scale bar (100 nm) stands for all the magnified images (B) Double-blind quantification of autophagic vacuoles in peripheral T cells isolated from the PBMC fraction obtained from healthy donors, patients with SLE or with other autoimmune diseases (Sjögren’s syndrome and vasculitis). Autophagic vacuoles were counted in 50 T lymphocyte sections. (C) Cell sections containing three or more autophagic vacuoles were counted for each subject. Each point represents the result for one subject. Central bars refer to the means and vertical bars stand for standard deviation. **p < 0.01 using unpaired t-test (in B) or Mann-Whitney U test.CC BY-NC · PubMed Central
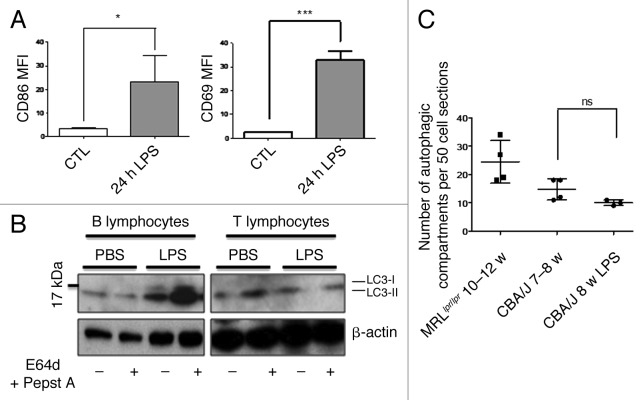
Figure 6. No autophagic compartment accumulation in normal T cells during acute systemic inflammation induced by LPS. (A) CBA/J mice (8 week-old) were injected i.p. with 50 µg LPS or with PBS (Control). B cell (TCR-β/B220+) and T cell (TCR-β+/B220-) activation was checked by measuring CD86 and CD69 expression respectively (represented as mean fluorescence intensity, MFI) in treated (24h LPS) and nontreated mice (control). *p < 0.05 by paired t-test and ***p < 0.005 by paired t-test. (B) LC3 conversion was assessed for splenic B or T cells isolated 24 h after injection of PBS alone or LPS, and left in cultured at 37°C for 4 h with (+) or without (-) lysosomal proteases inhibitors E64d and pepstatin A (5 µg/mL). Each immunoblot is representative of three experiments with identical results. (C) Quantification by TEM of autophagic vacuoles in peripheral T cells from either 10–12 week-old MRLlpr/lpr lupus mice, control 7–8 week-old CBA/J mice, or LPS-treated mice (CBA/J, 8 week-old LPS). Autophagic vacuoles were counted in 50 peripheral T lymphocyte sections. Each point represents measurement for an individual mouse. Central bars refer to the means and vertical bars stand for standard deviation. ns = nonsignificant using unpaired t-test.
Figure 6. No autophagic compartment accumulation in normal T cells during acute systemic inflammation induced by LPS. (A) CBA/J mice (8 week-old) were injected i.p. with 50 µg LPS or with PBS (Control). B cell (TCR-β/B220+) and T cell (TCR-β+/B220-) activation was checked by measuring CD86 and CD69 expression respectively (represented as mean fluorescence intensity, MFI) in treated (24h LPS) and nontreated mice (control). *p < 0.05 by paired t-test and ***p < 0.005 by paired t-test. (B) LC3 conversion was assessed for splenic B or T cells isolated 24 h after injection of PBS alone or LPS, and left in cultured at 37°C for 4 h with (+) or without (-) lysosomal proteases inhibitors E64d and pepstatin A (5 µg/mL). Each immunoblot is representative of three experiments with identical results. (C) Quantification by TEM of autophagic vacuoles in peripheral T cells from either 10–12 week-old MRLlpr/lpr lupus mice, control 7–8 week-old CBA/J mice, or LPS-treated mice (CBA/J, 8 week-old LPS). Autophagic vacuoles were counted in 50 peripheral T lymphocyte sections. Each point represents measurement for an individual mouse. Central bars refer to the means and vertical bars stand for standard deviation. ns = nonsignificant using unpaired t-test.CC BY-NC · PubMed Central

Verification

Claims the paper makes

The claims and statistics of this paper haven’t been checked yet.

Run the check — free, no account needed. It reads the open-access text and checks the sources it cites.

A few free checks a day · papers already verified open instantly · results are public

Claims other papers make about this one

Each is checked against this paper’s own text: does it say what the citing paper says it does?

Self-check

Percentages, sums and reported differences re-computed from the paper’s own numbers.

The self-check needs the paper’s full text.

Citations

Cites

Research works printed but not linked: 29

  1. 10.1016/j.ceb.2009.11.014 · DOI · Paper page
  2. 10.1083/jcb.201002021 · DOI
  3. 10.1038/nature07383 · DOI
  4. 10.4161/auto.5.2.7348 · DOI
  5. 10.1038/ng.81 · DOI · Paper page
  6. 10.1136/ard.2010.137174 · DOI
  7. 10.1136/ard.2008.101766 · DOI · Paper page
  8. 10.1097/BOR.0b013e32832efe6b · DOI
  9. 10.1136/ard.2010.139832 · DOI
  10. 10.4161/auto.7.5.14845 · DOI
  11. 10.1186/ar2711 · DOI
  12. 10.4049/jimmunol.1002223 · DOI
  13. 10.4161/auto.5.5.8133 · DOI
  14. 10.4049/jimmunol.0801143 · DOI
  15. 10.1038/ni.1653 · DOI
  16. 10.1038/cdd.2011.78 · DOI
  17. 10.1097/00002281-200309000-00004 · DOI
  18. 10.1016/j.cell.2010.01.028 · DOI · Paper page
  19. 10.1038/emboj.2008.31 · DOI · Paper page
  20. 10.1016/j.immuni.2007.05.022 · DOI · Paper page
  21. 10.1080/08830180490452602 · DOI
  22. 10.1073/pnas.1014156108 · DOI
  23. 10.1073/pnas.0808597105 · DOI
  24. 10.1172/JCI26185 · DOI
  25. 10.1101/gad.1984410 · DOI
  26. Miller BC, 2008, Autophagy, 4, 309, 10.4161/auto.5474 · DOI · Paper page
  27. 10.1016/j.immuni.2008.03.019 · DOI
  28. 10.1097/BOR.0b013e32834456bf · DOI
  29. 10.4049/jimmunol.1000576 · DOI · Paper page

Cited by

Sorted by citations

See all 155

Metadata

Authors
Gros, F., Arnold, J., Page, N., Décossas, M., Korganow, A.-S., Martin, T., & Muller, S.
Venue
Autophagy
Published
2012-07-13
Volume
8
Issue
7
Pages
1113-1123
ISSN
  • 1554-8627
  • 1554-8635
Cited by
155
References
2
Language
en

About these checks

Registry, retraction, Cites and statistics results are computed, not judged, with one exception: a printed reference that no index lists is read once by a model before it counts as a citation error. Claims are extracted by a model and kept only when their quote appears verbatim in the text; each cited source is then checked, with a model’s help, for whether it says what the claim relies on. Those verdicts can be wrong — read the claim’s quote and the cited source before relying on one.

Statistics and arithmetic are recomputed, not judged.

Confidence bands are shown only for fields calibrated on our annotated test set. None is calibrated yet, so no band is shown.

What counts as a claim ›How we measure confidence ›How we check this ›

Are you an author, or do you see a problem with this page? Request a review