

The DOI matches its Crossref record; 49 of the 50 references it cites were found in a registry or an index.
Power Analysis and Effect Size in Mixed Effects Models: A Tutorial
Open accessPublished version of a preprint
Abstract
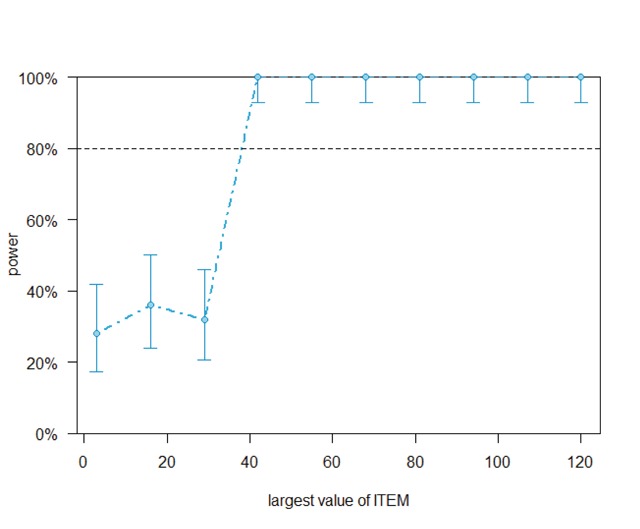
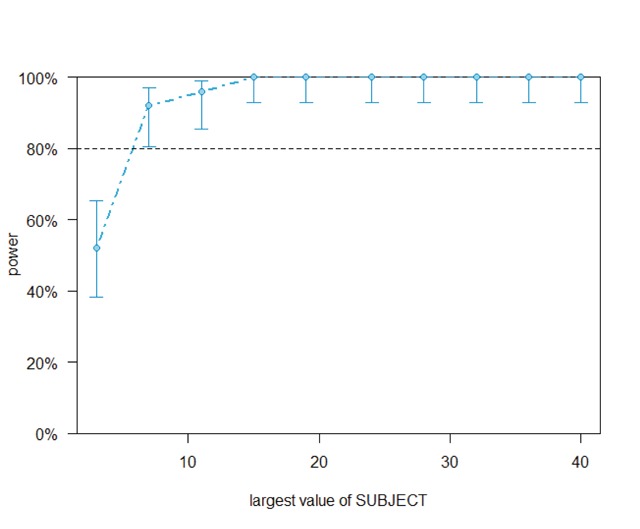
In psychology, attempts to replicate published findings are less successful than expected. For properly powered studies replication rate should be around 80%, whereas in practice less than 40% of the studies selected from different areas of psychology can be replicated. Researchers in cognitive psychology are hindered in estimating the power of their studies, because the designs they use present a sample of stimulus materials to a sample of participants, a situation not covered by most power formulas. To remedy the situation, we review the literature related to the topic and introduce recent software packages, which we apply to the data of two masked priming studies with high power. We checked how we could estimate the power of each study and how much they could be reduced to remain powerful enough. On the basis of this analysis, we recommend that a properly powered reaction time experiment with repeated measures has at least 1,600 word observations per condition (e.g., 40 participants, 40 stimuli). This is considerably more than current practice. We also show that researchers must include the number of observations in meta-analyses because the effect sizes currently reported depend on the number of stimuli presented to the participants. Our analyses can easily be applied to new datasets gathered.
Overview
The claims and statistics of this paper haven’t been checked yet.
Run the check — free, no account needed. It reads the open-access text and checks the sources it cites.
Integrity signals
Registry
Cites
Statistics
Figures
Verification
Claims the paper makes
The claims and statistics of this paper haven’t been checked yet.
Run the check — free, no account needed. It reads the open-access text and checks the sources it cites.
Claims other papers make about this one
Each is checked against this paper’s own text: does it say what the citing paper says it does?
The source backs part of the claim, not all of it — or backs it for a different population, condition or comparison.
In the citing paper
“Aggregations provide independent observations for non-parametric testing and make it appropriate when dealing with small sample sizes and repeated measures [8].”
From How University Disability Services Professionals Write Image Descriptions for HCI Figures Using Generative AI (2026) · cites this paper as [8]
Experimental — accuracy not yet measured
Self-check
Percentages, sums and reported differences re-computed from the paper’s own numbers.
The self-check needs the paper’s full text.
Citations
Cites
Fitting Linear Mixed-Effects Models Using lme4
Bates, D., Mächler, M., Bolker, B., & Walker, S. (2015) · Journal of Statistical Software · doi:10.18637/jss.v067.i01 · Cited by 86,835 · cited 2×
“Table 2: Outcome of the lmer analysis (Bates et al., 2015) of the Adelman et al.”
BackgroundFaul, F., Erdfelder, E., Lang, A.-G., & Buchner, A. (2007) · Behavior Research Methods · doi:10.3758/bf03193146 · Cited by 65,971
Mixed-effects modeling with crossed random effects for subjects and items
Baayen, R. H., Davidson, D. J., & Bates, D. M. (2008) · Journal of Memory and Language · doi:10.1016/j.jml.2007.12.005 · Cited by 8,540
Estimating the reproducibility of psychological science
Open Science Collaboration (2015) · Science · doi:10.1126/science.aac4716 · Cited by 8,515
Power failure: why small sample size undermines the reliability of neuroscience
Button, K. S., Ioannidis, J. P. A., Mokrysz, C., Nosek, B. A., Flint, J., Robinson, E. S. J., & Munafò, M. R. (2013) · Nature Reviews Neuroscience · doi:10.1038/nrn3475 · Cited by 7,641
Simmons, J. P., Nelson, L. D., & Simonsohn, U. (2011) · Psychological Science · doi:10.1177/0956797611417632 · Cited by 6,567 · cited 1×
“What must be avoided, is that authors try out the various options and only report the one that produces a “significant” effect, a phenomenon known as p-hacking (Simmons et al., 2011).”
BackgroundAnalyzing Linguistic Data: A Practical Introduction to Statistics using R
Baayen, R. H. (2008) · doi:10.1017/cbo9780511801686 · Cited by 3,253
The New Statistics: Why and How
Cumming, G. (2014) · Psychological Science · doi:10.1177/0956797613504966 · Cited by 3,200 · cited 1×
“First, p-values show wide sample-to-sample variability, particularly when they are based on studies with small sample sizes (Cumming, 2014; Halsey, Curran-Everett, Vowler, & Drummond, 2015).”
BackgroundSIMR : an R package for power analysis of generalized linear mixed models by simulation
Green, P., & MacLeod, C. J. (2016) · Methods in Ecology and Evolution · doi:10.1111/2041-210x.12504 · Cited by 2,467 · cited 1×
“A particularly interesting R package is simR (Green & MacLeod, 2016; Green, MacLeod, & Alday, 2016).2 2 The authors thank Jason Geller for pointing them to this package.”
BackgroundAnalyzing linguistic data: a practical introduction to statistics using R
Dévière, E. (2009) · Journal of Applied Statistics · doi:10.1080/02664760802366783 · Cited by 2,347 · cited 2×
“Some authors demand the use of transformations to get normal distributions (e.g., Baayen, 2008).”
BackgroundHARKing: Hypothesizing after the results are known
Kerr, N. L. (1998) · Personality and Social Psychology Review · doi:10.1207/s15327957pspr0203_4 · Cited by 1,989
The statistical power of abnormal-social psychological research: A review.
Cohen, J. (1962) · The Journal of Abnormal and Social Psychology · doi:10.1037/h0045186 · Cited by 1,824 · cited 5×
“Even so, Cohen (1962) showed that many experiments published in the established psychology journals have a power considerably below 80% (often as low as 30–40%).”
BackgroundInfluentialPublication bias in the social sciences: Unlocking the file drawer
Franco, A., Malhotra, N., & Simonovits, G. (2014) · Science · doi:10.1126/science.1255484 · Cited by 1,542
Beyond Power Calculations: Assessing Type S (Sign) and Type M (Magnitude) Errors
Gelman, A., & Carlin, J. (2014) · Perspectives on Psychological Science · doi:10.1177/1745691614551642 · Cited by 1,343 · cited 1×
“…problem combined with low power not only results in published papers with effects that do not exist at the population level, but also leads to an unacceptably high number of publications reporting and interpreting effects opposite to the one present at the population level (Gelman & Carlin, 2014).”
BackgroundNegative results are disappearing from most disciplines and countries
Fanelli, D. (2012) · Scientometrics · doi:10.1007/s11192-011-0494-7 · Cited by 1,248 · cited 1×
“Second, there is a file drawer problem (Fanelli, 2011; Franco, Malhotra, & Simonovits, 2014).”
BackgroundLo, S., & Andrews, S. (2015) · Frontiers in Psychology · doi:10.3389/fpsyg.2015.01171 · Cited by 1,057 · cited 2×
“Others warn that transformations may alter the nature of the data (e.g., a logarithmic transformation may alter the interactions between independent variables; Lo & Andrews, 2015).”
BackgroundMethodWestfall, J., Kenny, D. A., & Judd, C. M. (2014) · Journal of Experimental Psychology: General · doi:10.1037/xge0000014 · Cited by 928 · cited 14×
“First, Westfall et al. (2014) showed how you can calculate the effect size (measured as d) for a design with random participants and random items.”
BackgroundMethodInfluentialThe natural selection of bad science
Smaldino, P. E., & McElreath, R. (2016) · Royal Society Open Science · doi:10.1098/rsos.160384 · Cited by 860 · cited 1×
“Unless these are based on a proper power analysis, it is to be expected that many of these “reasons” will be fallacies aimed at decreasing the work load rather than cherishing the quality of the research done (Smaldino & McElreath, 2016).”
BackgroundAn adjusted boxplot for skewed distributions
Hubert, M., & Vandervieren, E. (2008) · Computational Statistics & Data Analysis · doi:10.1016/j.csda.2007.11.008 · Cited by 834 · cited 1×
“As is general practice, RTs of error trials and outliers were excluded (outliers were detected using an adjusted boxplot for skewed distributions, Hubert & Vandervieren, 2008).”
MethodThe fickle P value generates irreproducible results
Halsey, L. G., Curran‐Everett, D., Vowler, S. L., & Drummond, G. B. (2015) · Nature Methods · doi:10.1038/nmeth.3288 · Cited by 787
Measurement error and the replication crisis
Loken, E., & Gelman, A. (2017) · Science · doi:10.1126/science.aal3618 · Cited by 628 · cited 1×
“The consequences of underpowered studies are becoming increasingly clear (Loken & Gelman, 2017).”
BackgroundExperiments with More Than One Random Factor: Designs, Analytic Models, and Statistical Power
Judd, C. M., Westfall, J., & Kenny, D. A. (2017) · Annual Review of Psychology · doi:10.1146/annurev-psych-122414-033702 · Cited by 466 · cited 1×
“They are not more difficult to run anymore and better fit the data (Judd et al., 2017).”
BackgroundKühberger, A., Fritz, A., & Scherndl, T. (2014) · PLoS ONE · doi:10.1371/journal.pone.0105825 · Cited by 399 · cited 1×
“Because such p-values require large observed effect sizes in small designs, the effects sizes reported in the literature tend to be inflated, also those from studies that can be replicated (Kuhberger et al., 2014; Open Science Collaboration, 2015; Vasishth & Gelman, 2017).”
ResultKeuleers, E., Lacey, P., Rastle, K., & Brysbaert, M. (2011) · Behavior Research Methods · doi:10.3758/s13428-011-0118-4 · Cited by 391 · cited 1×
“Keuleers et al. (2012) observed that with a group of 40 participants, one needs 160 words and 160 nonwords per condition to find a word frequency effect of 20 ms with a power of .80 (this is a total of 40 * 160 * 4 = 25,600 observations, of which half are not used in the analysis, namely the data…”
BackgroundSelf-citationA meta-analysis of syntactic priming in language production
Mahowald, K., James, A. N., Futrell, R., & Gibson, E. A. F. (2016) · Journal of Memory and Language · doi:10.1016/j.jml.2016.03.009 · Cited by 350
The earth is flat ( p > 0.05): significance thresholds and the crisis of unreplicable research
Amrhein, V., Korner‐Nievergelt, F., & Roth, T. (2017) · PeerJ · doi:10.7717/peerj.3544 · Cited by 331
A Bayesian Perspective on the Reproducibility Project: Psychology
Etz, A., & Vandekerckhove, J. (2016) · PLOS ONE · doi:10.1371/journal.pone.0149794 · Cited by 295 · cited 1×
“At the same time, it is becoming clear that the definition of replication success may be less straightforward than assumed at first (Amrhein, Korner-Nievergelt, & Roth, 2017; Etz & Vandekerckhove, 2016).”
BackgroundThe Psychology of Replication and Replication in Psychology
Francis, G. (2012) · Perspectives on Psychological Science · doi:10.1177/1745691612459520 · Cited by 249 · cited 1×
“As a result, chances of publishing type I errors are considerably higher than the 5% expected when one uses the p < .05 criterion (Francis, 2012; Leggett, Thomas, Loetscher, & Nicholls, 2013; Simmons, Nelson, & Simonsohn, 2011).”
MethodKeuleers, E., Diependaele, K., & Brysbaert, M. (2010) · Frontiers in Psychology · doi:10.3389/fpsyg.2010.00174 · Cited by 241 · cited 1×
“Keuleers et al. (2012) observed that with a group of 40 participants, one needs 160 words and 160 nonwords per condition to find a word frequency effect of 20 ms with a power of .”
BackgroundSelf-citationLow statistical power in biomedical science: a review of three human research domains
Dumas-Mallet, E., Button, K. S., Boraud, T., Gonon, F., & Munafò, M. R. (2017) · Royal Society Open Science · doi:10.1098/rsos.160254 · Cited by 208
Kgolo-Lotshwao, N. N., & Eisenbeiß, S. (2015) · Language Cognition and Neuroscience · doi:10.1080/23273798.2015.1053813 · Cited by 107 · cited 1×
“…et al. (2015) Lexical decision 8 191 50 1194 Ussishkin et al. (2015) Exp 2a Lexical decision 3 66 36 792 Exp 2b Lexical decision 3 70 36 840 Kgolo & Eisenbeiss (2015) Exp 1 Lexical decision 7 70 55 550 Exp 2 Lexical decision 8 63 55 433 Exp 3 Lexical decision 8 65 55 446 Sulpizio & Job…”
Non-cognate translation priming in masked priming lexical decision experiments: A meta-analysis
Wen, Y., & van Heuven, W. J. B. (2016) · Psychonomic Bulletin & Review · doi:10.3758/s13423-016-1151-1 · Cited by 92 · cited 3×
“It tells us that the estimates of Westfall et al. (2014) are too optimistic.”
BackgroundMethodArticle Commentary: On the Persistence of Low Power in Psychological Science
Vankov, I., Bowers, J., & Munafò, M. R. (2014) · Quarterly Journal of Experimental Psychology · doi:10.1080/17470218.2014.885986 · Cited by 82
Brysbaert, M., Lagrou, E., & Stevens, M. A. (2016) · Bilingualism: Language and Cognition · doi:10.1017/s1366728916000353 · Cited by 81
Self-citationA behavioral database for masked form priming
Adelman, J. S., Johnson, R. L., McCormick, S. F., McKague, M., Kinoshita, S., Bowers, J. S., Perry, J. R., Lupker, S. J., Forster, K. I., Cortese, M. J., et al. (2014) · Behavior Research Methods · doi:10.3758/s13428-013-0442-y · Cited by 77 · cited 29×
“For the Adelman et al. (2014) database, one requires some 6,000 observations for a properly powered experiment (e.g., 60 participants and 100 stimuli, or 80 participants and 80 stimuli, or 100 participants and 60 stimuli).”
BackgroundMethodInfluentialEffects of reading proficiency on embedded stem priming in primary school children
Beyersmann, E., Grainger, J., Casalis, S., & Ziegler, J. C. (2015) · Journal of Experimental Child Psychology · doi:10.1016/j.jecp.2015.06.001 · Cited by 66 · cited 1×
“Bell et al. (2015) Exp 1 Semantic classification 6 23 120 460 Exp 2 Semantic classification 6 41 120 820 Exp 3 Semantic classification 6 39 120 780 Beyersmann et al. (2015) Lexical decision 8 191 50 1194 Ussishkin et al. (2015) Exp 2a Lexical decision 3 66 36 792 Exp 2b Lexical decision 3 70 36…”
The Life of p : “Just Significant” Results are on the Rise
Leggett, N. C., Thomas, N. A., Loetscher, T., & Nicholls, M. E. R. (2013) · Quarterly Journal of Experimental Psychology · doi:10.1080/17470218.2013.863371 · Cited by 64
A Bayesian bird's eye view of ‘Replications of important results in social psychology’
Marsman, M., Schönbrodt, F. D., Morey, R. D., Yao, Y., Gelman, A., & Wagenmakers, E. (2017) · Royal Society Open Science · doi:10.1098/rsos.160426 · Cited by 52
Auditory masked priming in Maltese spoken word recognition
Ussishkin, A., Dawson, C., Wedel, A., & Schluter, K. (2015) · Language Cognition and Neuroscience · doi:10.1080/23273798.2015.1005635 · Cited by 45 · cited 1×
“…460 Exp 2 Semantic classification 6 41 120 820 Exp 3 Semantic classification 6 39 120 780 Beyersmann et al. (2015) Lexical decision 8 191 50 1194 Ussishkin et al. (2015) Exp 2a Lexical decision 3 66 36 792 Exp 2b Lexical decision 3 70 36 840 Kgolo & Eisenbeiss (2015) Exp 1 Lexical decision 7 70…”
Perea, M., Vergara‐Martínez, M., & Gómez, P. (2015) · Cognition · doi:10.1016/j.cognition.2015.05.007 · Cited by 41 · cited 1×
“What must be avoided, is that authors try out the various options and only report the one that produces a “significant” effect, a phenomenon known as p-hacking (Simmons et al., 2011).”
BackgroundMasked priming of complex movements: perceptual and motor processes in unconscious action perception
Güldenpenning, I., Braun, J., Machlitt, D., & Schack, T. (2014) · Psychological Research · doi:10.1007/s00426-014-0607-z · Cited by 26 · cited 1×
“…192 Exp 2 Word naming 6 24 48 192 Exp 3 Word naming 6 24 48 192 Exp 4 Word naming 9 20 56 124 Dasgupta et al. (2015) Lexical decision 10 28 490 1372 Guldenpenning et al. (2015) Exp 1 Action decision 24 44 408 748 Exp 2 Action decision 48 50 576 600 Atas et al. (2015) Direction decision 32 29 2560…”
Kiefer, M., Sim, E. J., & Wentura, D. (2015) · Consciousness and Cognition · doi:10.1016/j.concog.2015.01.010 · Cited by 19 · cited 1×
“…408 748 Exp 2 Action decision 48 50 576 600 Atas et al. (2015) Direction decision 32 29 2560 2320 Perea et al. (2015) Lexical decision 4 40 120 1200 Kiefer et al. (2015) Exp 1 Evaluative decision 8 24 384 1152 Exp 2 Evaluative decision 16 24 768 1152 Exp 3 Evaluative decision 2 20 150 1500 should…”
Some cautions regarding statistical power in split-plot designs
Bradley, D. R., & Russell, R. L. (1998) · Behavior Research Methods, Instruments, & Computers · doi:10.3758/bf03200681 · Cited by 18 · cited 1×
“In contrast, Bradley and Russell (1998), on the basis of simulations, strongly warned against the introduction of an extra, in-between level to a repeated measure, because it decreases the power of the study.”
BackgroundThe statistical significance filter leads to overconfident expectations of replicability
Vasishth, S., & Gelman, A. (2017) · Annual Meeting of the Cognitive Science Society · doi:10.48550/arxiv.1702.00556 · Cited by 14 · cited 1×
“Because such p-values require large observed effect sizes in small designs, the effects sizes reported in the literature tend to be inflated, also those from studies that can be replicated (Kuhberger et al., 2014; Open Science Collaboration, 2015; Vasishth & Gelman, 2017).”
ResultEarly semantic activation in a semantic categorization task with masked primes: Cascaded or not?
Bell, D., Forster, K. I., & Drake, S. (2015) · Journal of Memory and Language · doi:10.1016/j.jml.2015.06.007 · Cited by 11 · cited 1×
“Bell et al. (2015) Exp 1 Semantic classification 6 23 120 460 Exp 2 Semantic classification 6 41 120 820 Exp 3 Semantic classification 6 39 120 780 Beyersmann et al. (2015) Lexical decision 8 191 50 1194 Ussishkin et al. (2015) Exp 2a Lexical decision 3 66 36 792 Exp 2b Lexical decision 3 70 36…”
Sulpizio, S., & Job, R. (2015) · Frontiers in Psychology · doi:10.3389/fpsyg.2015.01612 · Cited by 10 · cited 1×
“…3 70 36 840 Kgolo & Eisenbeiss (2015) Exp 1 Lexical decision 7 70 55 550 Exp 2 Lexical decision 8 63 55 433 Exp 3 Lexical decision 8 65 55 446 Sulpizio & Job (2015) Exp 1 Word naming 6 24 48 192 Exp 2 Word naming 6 24 48 192 Exp 3 Word naming 6 24 48 192 Exp 4 Word naming 9 20 56…”
Atas, A., Anton, E. S., & Axel Cleeremans, B. (2014) · Psychological Research · doi:10.1007/s00426-014-0611-3 · Cited by 9 · cited 1×
“…et al. (2015) Lexical decision 10 28 490 1372 Guldenpenning et al. (2015) Exp 1 Action decision 24 44 408 748 Exp 2 Action decision 48 50 576 600 Atas et al. (2015) Direction decision 32 29 2560 2320 Perea et al. (2015) Lexical decision 4 40 120 1200 Kiefer et al. (2015) Exp 1 Evaluative…”
Computational Modeling of Morphological Effects in Bangla Visual Word Recognition
Dasgupta, T., Sinha, M., & Basu, A. (2014) · Journal of Psycholinguistic Research · doi:10.1007/s10936-014-9302-x · Cited by 7 · cited 1×
“…55 446 Sulpizio & Job (2015) Exp 1 Word naming 6 24 48 192 Exp 2 Word naming 6 24 48 192 Exp 3 Word naming 6 24 48 192 Exp 4 Word naming 9 20 56 124 Dasgupta et al. (2015) Lexical decision 10 28 490 1372 Guldenpenning et al. (2015) Exp 1 Action decision 24 44 408 748 Exp 2 Action decision 48 50…”
Marsman, M., Schönbrodt, F., Morey, R., Yao, Y.-L., Gelman, A., & Wagenmakers, E. (2017) · Royal Society Open Science · doi:10.1098/rsos.170085 · Cited by 6
Cited by
Sorted by citations
Lakens, D. (2022) · Collabra Psychology · doi:10.1525/collabra.33267 · Cited by 1,962
Lakens, D. (2021) · Collabra: Psychology · doi:10.31234/osf.io/9d3yf · Cited by 1,935
Brysbaert, M. (2019) · Journal of Cognition · doi:10.5334/joc.72 · Cited by 996
“Brysbaert and Stevens (2018) recommended 40 participants and 40 stimuli per condition as good practice in reaction time studies with two repeated-measures conditions.”
BackgroundMethodInfluentialSelf-citationBest practice guidance for linear mixed-effects models in psychological science
Meteyard, L., & Davies, R. A. I. (2020) · Journal of Memory and Language · doi:10.1016/j.jml.2020.104092 · Cited by 817
How many words do we read per minute? A review and meta-analysis of reading rate
Brysbaert, M. (2019) · Journal of Memory and Language · doi:10.1016/j.jml.2019.104047 · Cited by 553
Self-citation
Metadata
- Authors
- Brysbaert, M., & Stevens, M.
- Affiliations
- Ghent University (BE)
- Corresponding author
- Brysbaert, Marc
- ORCID
- Brysbaert, Marc
- Venue
- Journal of Cognition
- Publisher
- Ubiquity Press, Ltd.
- Published
- 2018
- Volume
- 1
- Issue
- 1
- Pages
- 9-9
- ISSN
- 2514-4820 (ISSN-L)
- PMC
- PMC6646942
- OpenAlex
- W2783948250
- Cited by
- 1,420
- References
- 50
- Citations by year
- 2026: 154 · 2025: 290 · 2024: 189 · 2023: 195 · 2022: 195 · 2021: 162 · 2020: 130 · 2019: 73 · 2018: 31
- FWCI
- 82.16
- Type
- journal article
- Language
- en
- Open access
- gold
- doi.org
- Licence
- Locations
- Journal of Cognition (publishedVersion, cc-by)
- Europe PMC (PubMed Central) (publishedVersion, cc-by)
- PubMed Central (publishedVersion, cc-by)
- PubMed (publishedVersion)
- Ghent University Academic Bibliography (Ghent University) (submittedVersion, cc-by-sa)
- DOAJ (DOAJ: Directory of Open Access Journals) (submittedVersion, cc-by-sa)
- PsyArXiv (OSF Preprints) (submittedVersion, cc-by)
- PsyArXiv (OSF Preprints) (submittedVersion)
- OSF Preprints (OSF Preprints) (submittedVersion, cc-by)
- Topics
- Physical Sciences › Mathematics › Statistics and Probability › Statistical Methods and Bayesian Inference
- Social Sciences › Decision Sciences › Statistics, Probability and Uncertainty › Meta-analysis and systematic reviews
- Social Sciences › Psychology › Experimental and Cognitive Psychology › Psychology Research and Bibliometrics
- Keywords
- power analysis, effect size, mixed models, replication, cognitive psychology, masked priming, reaction time, repeated measures, sample size, meta-analysis, statistical power
About these checks
Registry, retraction, Cites and statistics results are computed, not judged, with one exception: a printed reference that no index lists is read once by a model before it counts as a citation error. Claims are extracted by a model and kept only when their quote appears verbatim in the text; each cited source is then checked, with a model’s help, for whether it says what the claim relies on. Those verdicts can be wrong — read the claim’s quote and the cited source before relying on one.
Statistics and arithmetic are recomputed, not judged.
Confidence bands are shown only for fields calibrated on our annotated test set. None is calibrated yet, so no band is shown.
What counts as a claim ›How we measure confidence ›How we check this ›
Are you an author, or do you see a problem with this page? Request a review
