

The DOI matches its Crossref record; 122 of the 123 references it cites were found in a registry or an index, and 1 are not checked yet; 3 of the 130 sources its claims cite were checked for support.
Complement 3a Receptor mediates high fat diet induced hypothalamic accumulation of lipid associated microglia to regulate neuroinflammation and obesity
Open accessAbstract
Microglia, the resident macrophages of the central nervous system, are recognized for their heterogeneity and integral role in brain function and diseases. In the context of high fat diet (HFD) feeding and obesity, microglia become overactive, acquiring a prevailing lipid associated microglial phenotype (also known as LAM). Yet, how microgliosis is induced and regulated remains unclear. Here we report a key role for the Complement 3a Receptor (C3aR), on HFD-induced hypothalamic gliosis and weight gain in mice. HFD consumption leads to elevated microglial expression of C3aR, which parallels widespread accumulation of reactive microglia, selectively in the hypothalamus. Conditional microglial C3aR deletion protects mice from HFD-induced hypothalamic reactive microgliosis. C3aR deletion or pharmacological antagonism opposes HFD-induced weight gain in male but not female mice. Mechanistically, we demonstrated that C3aR is essential for lipid-induced lipid droplet formation, and acquisition of a LAM molecular signature. In summary, we uncovered a previously unknown role for C3aR in the acquisition of a LAM signature driving diet-induced gliosis, identifying this receptor as a new viable therapeutic candidate for conditions associated with hypothalamic neuroinflammation.
Verified 2026-11-17 · 1 reference not checked yet
Overview
CoChat Summary
TL;DR
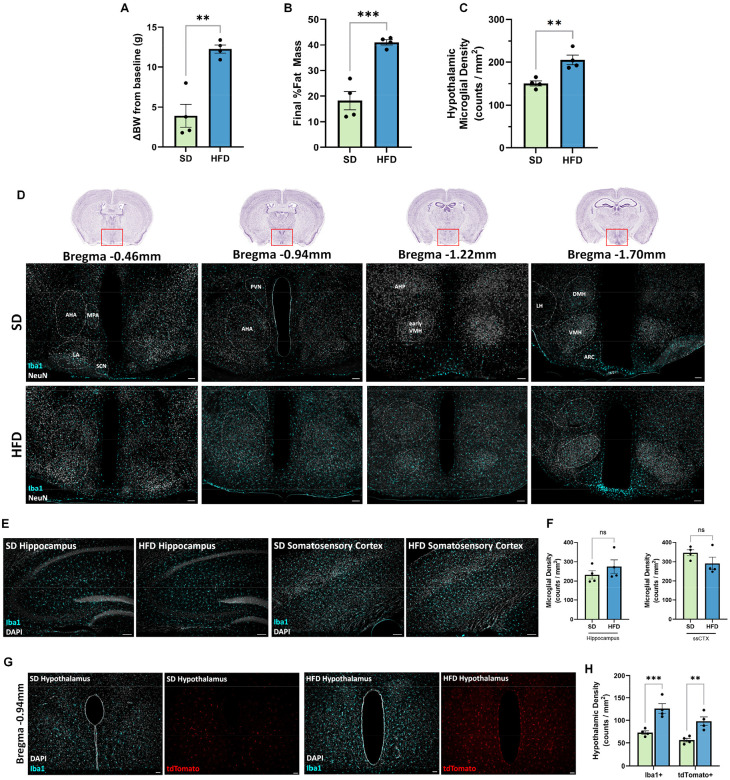
In mice, microglial C3aR is selectively expressed by microglia, marks lipid-associated microglia (LAM), and is required for high-fat-diet (HFD)-induced hypothalamic microgliosis/astrogliosis and lipid droplet formation. Conditional microglial C3aR deletion or intranasal C3aR antagonism protects against HFD-induced hypothalamic gliosis and, in male mice on 45% HFD, weight/fat gain.
Key findings
- C3aR expression was selective to microglia in mouse and human CNS; scRNAseq identified hypothalamic microglial subclusters with foamy/LAM features (FoamDEX > 0.50), with subclusters 4, 7, and 10 showing highest C3ar1 and LAM scores.
- HFD feeding increased hypothalamic microgliosis and astrogliosis independent of sex and body weight, and increased microglial C3aR; conditional microglial C3aR deletion normalized HFD-induced microgliosis, astrogliosis, amoeboid microglial morphology, CD68, and Trem2+ microglia in both sexes.
- C3aR deletion protected male mice from 45% HFD-induced obesity but not 60% HFD, and did not protect females; intranasal DArg10_Aib20 in 45% HFD-fed males limited body weight gain and decreased fat mass gain without changing food intake, and protected against hypothalamic microgliosis.
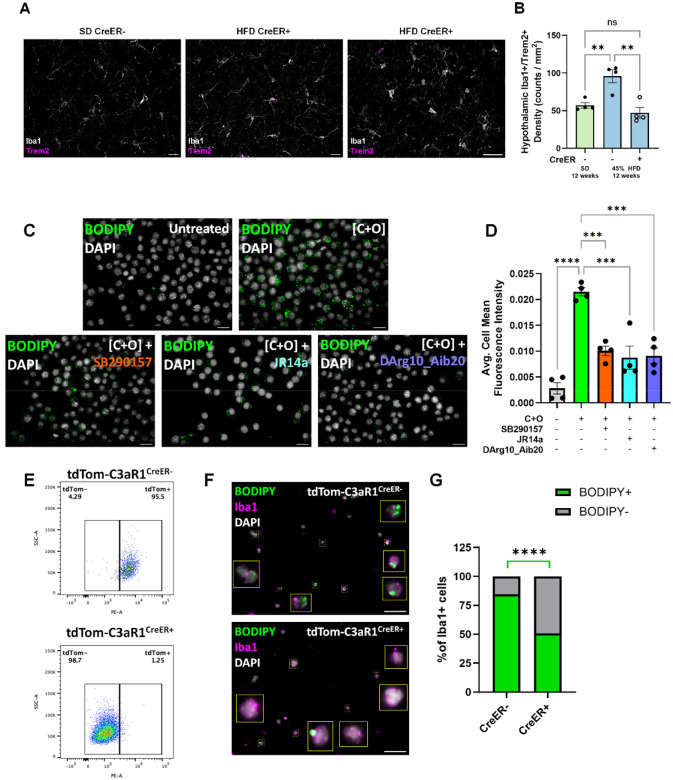
- In vitro, cholesterol + oleate induced lipid droplets and LAM/inflammatory genes; C3aR antagonism blocked lipid droplet accumulation, and primary microglia from C3aR-deleted mice showed <50% lipid-loaded cells versus >80% in controls.
Methods
- Mouse genetics and diets: tdTom-C3aR1lox/lox reporter mice and CX3CR1creERT2-mediated conditional microglial C3aR deletion; tamoxifen 100 mg/kg for 5 days; standard diet, 45% HFD, or 60% HFD for up to 12 weeks; n = 10–12/group/sex for SD/45% HFD and n = 5/group/sex for 60% HFD; body weight, EchoMRI, CLAMS indirect calorimetry, and glucose tolerance tests.
- Pharmacological and imaging experiments: intranasal DArg10_Aib20 (8.33 μg/μl; 12 μl/day; 100 μg daily) or saline for 12 weeks in 45% HFD-fed male mice; Cy5-TLQP-21 in vivo imaging via IVIS.
- In vitro and transcriptomic analysis: BV2 or primary microglia lipid-loaded with 20 μg/ml cholesterol + 400 μM oleic acid; BODIPY staining; antagonists SB290157 (20 μM), JR14a (1 μM), or DArg10_Aib20 (20 μM); public scRNAseq datasets analyzed with Seurat/Harmony, FoamDEX, and LAM scores.
Limitations
- Stated: the mechanism of sex-dependent vulnerability needs further study; further sequencing is needed to determine how hypothalamic microglial subclusters shift in diet-induced obesity; the functional implication of a slight reduction in cumulative energy expenditure in male C3aR1lox/lox-CreER+ mice on 45% HFD is currently unclear.
- Stated/evident: CX3CR1creERT2 can target some peripheral macrophages; the authors found transient C3aR depletion in the small intestine at 2 weeks post-tamoxifen that was later replenished, and state this may have limited metabolic effect.
- Evident: the protective metabolic effect was limited to male mice on 45% HFD, not 60% HFD or females, so generalizability across sexes and diet fat levels is constrained.
Model-written summary. Check it against the paper before relying on it.
Integrity signals
Registry
Cites
Statistics
Figures

![Figure 3. Conditional depletion of microglial C3aR protects against diet-induced obesity and hypothalamic microgliosis. A) Experimental timeline for in vivo studies. Change in body weight from baseline comparisons within male (B) or female (C) C3aR1lox/lox-CreER- or C3aR1lox/lox-CreER+ mice fed either SD, 45% HFD, or 60% HFD for 12 weeks. Male Cre+ animals on 45% HFD were protected against diet-induced weight gain meanwhile female mice regardless of genotype were resistant to 45% HFD-induced weight gain. Males 2-way ANOVA. Diet (main) effect: F(2,50)=18.58, p<0.0001; Genotype effect: F(1,49)=2.415, p=0.1265; Interaction: F(2,50)=1.422, p=0.2507). Females 2-way ANOVA. Diet (main) effect: F(2,47)=26.65, p<0.0001; Genotype effect: F(1,47)=0.02555, p=0.8737; Interaction: F(2,47)=0.3026, p=0.7403). Tukey’s post hoc]. Animals: SD & 45%HFD, N=10–12/genotype/sex; 60% N=5/genotype/sex. Representative 10x IF images (D) and quantification (E) showing HFD-induced hypothalamic microgliosis that was reduced in animals lacking microglial C3aR. Diet-induced hypothalamic microgliosis was protected when microglial C3aR was ablated in both male and female animals, and regardless of which HFD diet they were on. 2-way ANOVA. Diet (main) effect: F(2,45)=23.12, p<0.0001; Genotype effect: F(1,45)=23.41, p<0.0001; Interaction: F(2,45)=7.515, p=0.0015). F) Flow cytometry showing elevated whole brain microglial counts after 12 weeks of 45% HFD that was mitigated in animals with ablated microglial C3aR, consistent with the histology performed on replicate animals in C/D. Sexes were pooled although there appears to be clustering based on sex in HFD-fed CreER+ animals (Fig.S4C). Pooled 2-way ANOVA. Diet (main) effect: F(1,40)=52.62, p<0.0001; Genotype effect: F(1,40)=9.353, p=0.0040; Interaction: F(1,40)=5.290, p=0.0267). Representative IF images (G) and quantification (H) showing HFD-induced hypothalamic astrogliosis that was also reduced in animals lacking microglial C3aR, despite these astrocytes not expressing C3aR. Quantification shows an increase in percent area occupied by GFAP+ pixels in 10x magnification images (20x magnification images shown for representative images, G). Scale bars represent 30μm. 2-way ANOVA. Diet (main) effect: F(2,43)=15.79, p<0.0001; Genotype effect: F(1,43)=23.34, p<0.0001; Interaction: F(2,42)=13.16, p<0.0001). Error bars represent standard error of the mean (SEM).](https://figures.cochat.ai/paper-figures/8acb9c1087a647588b72aa62948d06fa/complement-3a-receptor-mediates-high-fat-diet-induced-hypothalamic-accumulation-figure-3.jpg)


Verification
Claims the paper makes
1 Valid · 1 Not valid · 34 Not checked · 83 Own results and interpretations
At least one cited source doesn’t support this claim or points to a different paper, and none confirmed it — see the verdicts below.
In the paper
“Similarly, HFD resulted in increased CD68 staining as a proxy of phagocytic activity[73,75,85].”
§ Complement 3a Receptor mediates high fat diet induced hypothalamic accumulation of lipid associated microglia to regulate neuroinflammation and obesity > Discussion > An essential role for C3aR in HFD-induced hypothalamic gliosis
What the sources say
- Check pendingcites [73] source
- Disputedcites [75] sourceExperimental — accuracy not yet measured
Our copy of Hendrickx et al. (2017) contains no high-fat-diet experiment at all: it is an immunohistochemical study of HLA-DR, Iba1 and CD68 in human post-mortem microglia/MS tissue (Introduction, §1; Results/Discussion 'Nimmerjahn' section), so the attributed HFD-induced increase in CD68 staining is not this paper's finding. More decisively, the paper contradicts the framing of CD68 staining as a proxy of phagocytic activity: in the Discussion it states that 'studies are inconclusive about cellular CD68 regulation during phagocytosis' (unaltered after zymosan or myelin phagocytosis, upregulated only in THP-1 and BV-2 systems) and concludes 'a convincing correlation between CD68 expression and phagocytic activity has yet to be found.' It does note CD68 intensity is highest in foamy macrophages and that CD68 is functionally involved in phagocytosis of oxLDL and apoptotic cells, but explicitly stops short of endorsing CD68 as a readout of phagocytic activity. (LLM, conf=0.78)
Checked by a reasoning model — may be wrong.
- Check pendingcites [85] source
plainstates a cause- Asserted: passes — The authors put it forward as true.
- Checkable: passes — It can be checked against evidence.
- Load-bearing: unclear — It is unclear whether the paper’s conclusions depend on it.
- Based: passes — The paper gives a reason why it holds.
In the paper
“Analysis of single-cell RNA sequencing datasets[13,54,56] confirms that microglia are the predominant cell type in the CNS expressing C3ar1 in mice (Fig.S2A–C).”
§ Complement 3a Receptor mediates high fat diet induced hypothalamic accumulation of lipid associated microglia to regulate neuroinflammation and obesity > Results > Selective expression of C3aR by microglia in the central nervous system
What the sources say
- Check pendingcites [13] source
- Could not verifycites [54] sourceExperimental — accuracy not yet measured
Our copy of HypoMap contains no passage mentioning C3ar1 (searched: 'C3ar1 microglia', 'complement 3a receptor gene expression marker', 'complement receptor C3aR1 expression cell type'); all returns were semantic neighbours about Glp1r/POMC validation and bacTRAP mapping, none exact-phrase hits. The paper does profile microglia — a large Ly86-expressing cluster subdivided into ten clusters (Results, 'Non-neuronal populations'; and 'The generation of HypoMap', where Ly86 marks the microglia node at C7) — but only for the murine hypothalamus, with no statement about C3ar1 or about which CNS cell type predominantly expresses it. Since the claim's decisive content (C3ar1 expression) is not addressed anywhere in our copy, and nothing contrary is stated, it can be neither confirmed nor disputed. (LLM, conf=0.72)
- Check pendingcites [56] source
boostedstates an association- Asserted: passes — The authors put it forward as true.
- Checkable: passes — It can be checked against evidence.
- Load-bearing: passes — The paper’s conclusions depend on it.
- Based: passes — The paper gives a reason why it holds.
The cited sources support only part of this claim — read each source’s verdict below.
In the paper
“Analysis of publicly available single-cell RNA sequencing datasets[13,54,56] revealed that even under healthy, physiological circumstances, there are unique sub-populations of hypothalamic microglia exhibiting a LAM signature.”
§ Complement 3a Receptor mediates high fat diet induced hypothalamic accumulation of lipid associated microglia to regulate neuroinflammation and obesity > Discussion > C3aR is a new LAM marker, necessary for lipid-induced lipid droplet formation
What the sources say
- Check pendingcites [13] source
- Partly supportedcites [54] sourceExperimental — accuracy not yet measured
Our copy does support the framing: HypoMap was built by integrating 17 publicly available datasets (Main; Methods, 'Dataset download'), and the Non-neuronal populations section reports that 'HypoMap also captures a large cluster of Ly86-expressing microglia ... which could be further divided into ten clusters' — i.e., distinct hypothalamic microglial sub-populations under physiological (ad libitum-fed/fasted) conditions. What our copy never states is the defining qualifier of the claim: no passage describes a LAM (lysosome-associated membrane / lipid-associated macrophage) signature in any microglial sub-cluster; the only state-labelled glial sub-population named is a reactive astrocyte cluster (C66-54: Lgals3.Astrocytes, Gfap/Lgals3). Searches for 'LAM', 'lysosome-associated membrane', 'lysosomal/autophagy microglia markers (Ctsd, Gpnmb, Apoe)' and 'microglia homeostatic markers (Cx3cr1, P2ry12)' returned no such characterization. So the sub-population half is supported and the LAM-signature half is not. (LLM, conf=0.68)
- Check pendingcites [56] source
plain- Asserted: passes — The authors put it forward as true.
- Checkable: passes — It can be checked against evidence.
- Load-bearing: passes — The paper’s conclusions depend on it.
- Based: passes — The paper gives a reason why it holds.
A result the paper reports from its own data — it cites no other source for it, so there is none to check. The quote shows it is in the paper.
In the paper
“HFD consumption leads to elevated microglial expression of C3aR, which parallels widespread accumulation of reactive microglia, selectively in the hypothalamus.”
§ Complement 3a Receptor mediates high fat diet induced hypothalamic accumulation of lipid associated microglia to regulate neuroinflammation and obesity > Abstract
plainstates a cause- Asserted: passes — The authors put it forward as true.
- Checkable: passes — It can be checked against evidence.
- Load-bearing: passes — The paper’s conclusions depend on it.
- Based: passes — The paper gives a reason why it holds.
A result the paper reports from its own data — it cites no other source for it, so there is none to check. The quote shows it is in the paper.
In the paper
“C3aR deletion or pharmacological antagonism opposes HFD-induced weight gain in male but not female mice.”
- Also stated in: § Introduction · plain
“Finally, C3aR deletion or pharmacological antagonism opposes HFD-induced weight gain in a sex dependent-manner.”
§ Complement 3a Receptor mediates high fat diet induced hypothalamic accumulation of lipid associated microglia to regulate neuroinflammation and obesity > Abstract
plainstates a cause- Asserted: passes — The authors put it forward as true.
- Checkable: passes — It can be checked against evidence.
- Load-bearing: passes — The paper’s conclusions depend on it.
- Based: passes — The paper gives a reason why it holds.
- Rests on an assumption not shown here.
- Also stated in: § Introduction · plain
41 more claims
Create a free account to see all 119 claims and to verify the 127 references still open.
- It may state two separate claims as one. 59
- Probably not a substantial claim. 29
Self-check
Percentages, sums and reported differences re-computed from the paper’s own numbers.
Each contradiction between two passages listed here was confirmed by an independent check.
Rated minor: it would not touch a result — a value no result rests on, a p-value that stays on the same side of the significance level, or a conflict that is clerical, resolved elsewhere in the paper, or outside its own findings.
In the paper
§ Complement 3a Receptor mediates high fat diet induced hypothalamic accumulation of lipid associated microglia to regulate neuroinflammation and obesity > Results > Conditional C3aR deletion prevents high fat diet induced hypothalamic gliosis
“there was a slight reduction in cumulative energy expenditure only in male C3aR1lox/lox-CreER+ fed 45% HFD (Fig.S4A–B)”
§ Complement 3a Receptor mediates high fat diet induced hypothalamic accumulation of lipid associated microglia to regulate neuroinflammation and obesity > Discussion > C3aR exerts a sex dependent role in HFD-induced obesity.
“neither food intake measured during the entire study or energy expenditure assessed after 10 weeks on the diet were affected by gene deletion.”
Citations
Cites
Fast, sensitive and accurate integration of single-cell data with Harmony
Korsunsky, I., Millard, N., Fan, J., Slowikowski, K., Zhang, F., Wei, K., Baglaenko, Y., Brenner, M., Loh, P.-R., & Raychaudhuri, S. (2019) · Nature Methods · doi:10.1038/s41592-019-0619-0 · Cited by 10,488
Massively parallel digital transcriptional profiling of single cells
Zheng, G. X. Y., Terry, J. M., Belgrader, P., Ryvkin, P., Bent, Z. W., Wilson, R., Ziraldo, S. B., Wheeler, T. D., McDermott, G. P., Zhu, J., et al. (2017) · Nature Communications · doi:10.1038/ncomms14049 · Cited by 7,353
Dictionary learning for integrative, multimodal and scalable single-cell analysis
Hao, Y., Stuart, T., Kowalski, M. H., Choudhary, S., Hoffman, P., Hartman, A., Srivastava, A., Molla, G., Madad, S., Fernandez-Granda, C., et al. (2024) · Nature Biotechnology · doi:10.1038/s41587-023-01767-y · Cited by 5,631
Pfaffl, M. W., Tichopad, A., Prgomet, C., & Neuvians, T. P. (2004) · Biotechnology Letters · doi:10.1023/b:bile.0000019559.84305.47 · Cited by 5,065
Kopelman, P. G. (2000) · Nature · doi:10.1038/35007508 · Cited by 4,795
Fate Mapping Reveals Origins and Dynamics of Monocytes and Tissue Macrophages under Homeostasis
Yona, S., Kim, K.-W., Wolf, Y., Mildner, A., Varol, D., Breker, M., Strauss-Ayali, D., Viukov, S., Guilliams, M., Misharin, A., et al. (2013) · Immunity · doi:10.1016/j.immuni.2012.12.001 · Cited by 3,245
Krasemann, S., Madore, C., Cialic, R., Baufeld, C., Calcagno, N., El Fatimy, R., Beckers, L., O’Loughlin, E., Xu, Y., Fanek, Z., et al. (2017) · Immunity · doi:10.1016/j.immuni.2017.08.008 · Cited by 2,979
Microglia promote learning-dependent synapse formation through brain-derived neurotrophic factor
Parkhurst, C. N., Yang, G., Ninan, I., Savas, J. N., Yates, J. R., Lafaille, J. J., Hempstead, B. L., Littman, D. R., & Gan, W.-B. (2013) · Cell · doi:10.1016/j.cell.2013.11.030 · Cited by 2,599
Obesity is associated with hypothalamic injury in rodents and humans.
Thaler, J. P., Yi, C.-X., Schur, E. A., Guyenet, S. J., Hwang, B. H., Dietrich, M. O., Zhao, X., Sarruf, D. A., Izgur, V., Maravilla, K. R., et al. (2012) · Journal of Clinical Investigation · doi:10.1172/jci59660 · Cited by 1,857
Marschallinger, J., Iram, T., Zardeneta, M., Lee, S. E., Lehallier, B., Haney, M. S., Pluvinage, J. V., Mathur, V., Hahn, O., Morgens, D. W., et al. (2020) · Nature Neuroscience · doi:10.1038/s41593-019-0566-1 · Cited by 1,586
Research works printed but not linked: 6
- 10.1016/j.tins.2017.02.005/attachment/54e28e50-9278-4d91-b850-bcb32105363e/mmc1.docx · doi:10.1016/j.tins.2017.02.005/attachment/54e28e50-9278-4d91-b850-bcb32105363e/mmc1.docx
- 10.3389/fneur.2024.1396520/bibtex · doi:10.3389/fneur.2024.1396520/bibtex
- 10.1101/2024.09.24.614807 · DOI · Paper page
- 10.1126/scitranslmed.aaf6295/suppl_file/aaf6295_sm.pdf · doi:10.1126/scitranslmed.aaf6295/suppl_file/aaf6295_sm.pdf
- 10.3389/fnins.2021.734158/full · doi:10.3389/fnins.2021.734158/full
- 10.1186/s12974-016-0666-8/figures/5 · doi:10.1186/s12974-016-0666-8/figures/5
Cited by
Vastrad, B. M., Patil, S., & Vastrad, C. M. (2026) · Research Square · doi:10.21203/rs.3.rs-10369268/v1
Metadata
- Authors
- Pallais, J. P., Razzoli, M., Rodriguez, P., McGonigle, S., Daugherty, A., Hillman, H., Verteramo, L., Schrank, P. R., Parthiban, P., Chang, X., Wang, H., Veglia, G., Köhl, J., Bose, M., Ehrlich, M. E., Salton, S. R. J., Araque, A., Barbato, D. L., Revelo, X. S., Ruan, H.-B., Williams, J. W., & Bartolomucci, A.
- Affiliations
- University of Minnesota (US)
- University of Rome Tor Vergata (IT)
- University of Lübeck (DE)
- Icahn School of Medicine at Mount Sinai (US)
- Department of Biology, University of Rome Tor Vergata, Rome, Italy
- Corresponding author
- Bartolomucci, Alessandro
- ORCID
- Venue
- Journal of Neuroinflammation
- Publisher
- openRxiv
- Published
- 2026-04-22
- ISSN
- 1742-2094 (ISSN-L)
- PMC
- PMC13131461
- OpenAlex
- W7215059476
- Cited by
- 1
- References
- 120
- Citations by year
- 2026: 1
- FWCI
- 2.06
- Type
- journal article
- Language
- en
- Open access
- gold
- doi.org
- Licence
- Locations
- Journal of Neuroinflammation (publishedVersion, cc-by-nc-nd)
- bioRxiv (Cold Spring Harbor Laboratory) (submittedVersion, cc-by-nc-nd)
- PubMed Central (publishedVersion, cc-by-nc-nd)
- PubMed (submittedVersion)
- Funders
- National Institute of Allergy and Infectious Diseases (R01AI165553)
- Institute for Diabetes Obesity and Metabolism University of Minnesota (2022 Pilot and Feasibility Program)
- Minnesota Partnership for Biotechnology and Medical Genomics (24.01)
- American Heart Association (25PRE1361476)
- Cure Alzheimer’s Fund
- MN Dept. of Education Award (214654)
- Topics
- Life Sciences › Neuroscience › Neurology › Neuroinflammation and Neurodegeneration Mechanisms
- Health Sciences › Medicine › Endocrinology, Diabetes and Metabolism › Adipokines, Inflammation, and Metabolic Diseases
- Life Sciences › Neuroscience › Endocrine and Autonomic Systems › Regulation of Appetite and Obesity
- Keywords
- C3aR, microglial activation, hypothalamus, high-fat diet, obesity, neuroinflammation, lipid droplet formation, transcriptional remodeling
About these checks
Registry, retraction, Cites and statistics results are computed, not judged, with one exception: a printed reference that no index lists is read once by a model before it counts as a citation error. Claims are extracted by a model and kept only when their quote appears verbatim in the text; each cited source is then checked, with a model’s help, for whether it says what the claim relies on. Those verdicts can be wrong — read the claim’s quote and the cited source before relying on one.
The claim verdicts this report counts are experimental: their accuracy is not yet measured.
A language model drew the claims from the paper on 2026-11-17, under version 3 of the claim definition (model deepseek-v4.1-flash, prompt extract-v3).
A second model labelled each claim on 2026-11-17 (model jev-1.13-20260917, definition revision gold-guideline-v0.2).
Cited sources are checked with a language model’s help (qwen3.8-omni-flash).
Statistics and arithmetic are recomputed, not judged.
Confidence bands are shown only for fields calibrated on our annotated test set. None is calibrated yet, so no band is shown.
What counts as a claim ›How we measure confidence ›How we check this ›
Are you an author, or do you see a problem with this page? Request a review
How to cite
Cite CoChat for the checks on this page, and the paper for its own findings.
- This page
- CoChat. (2026). Citation check: Complement 3a Receptor mediates high fat diet induced hypothalamic accumulation of lipid associated microglia to regulate neuroinflammation and obesity. https://app.cochat.ai/papers/10.64898/2026.04.18.719397
- The paper
- Pallais, J. P., Razzoli, M., Rodriguez, P., McGonigle, S., Daugherty, A., Hillman, H., Verteramo, L., Schrank, P. R., Parthiban, P., Chang, X., Wang, H., Veglia, G., Köhl, J., Bose, M., Ehrlich, M. E., Salton, S. R. J., Araque, A., Barbato, D. L., Revelo, X. S., . . . Bartolomucci, A. (2026). Complement 3a Receptor mediates high fat diet induced hypothalamic accumulation of lipid associated microglia to regulate neuroinflammation and obesity. Journal of Neuroinflammation. https://doi.org/10.64898/2026.04.18.719397
Data sources
Bibliographic data: Semantic Scholar, OpenAlex, Crossref.
Contains information from the Semantic Scholar Academic Graph Datasets, made available under the ODC Attribution License (ODC-BY 1.0).
Semantic Scholar’s data is described in: Kinney, R., et al. (2023). The Semantic Scholar Open Data Platform. arXiv:2301.10140.
