

The DOI matches its Crossref record; 21 of the 21 references it cites were found in a registry or an index.
Decoding gene networks controlling hypothalamic and prethalamic neuron development
Published version of a preprint
Overview
The claims and statistics of this paper haven’t been checked yet.
Free: it reads the open-access text and checks the first 5 claims that cite a source we can check. Create a free account to check every claim.
Integrity signals
Registry
Cites
Statistics
Figures
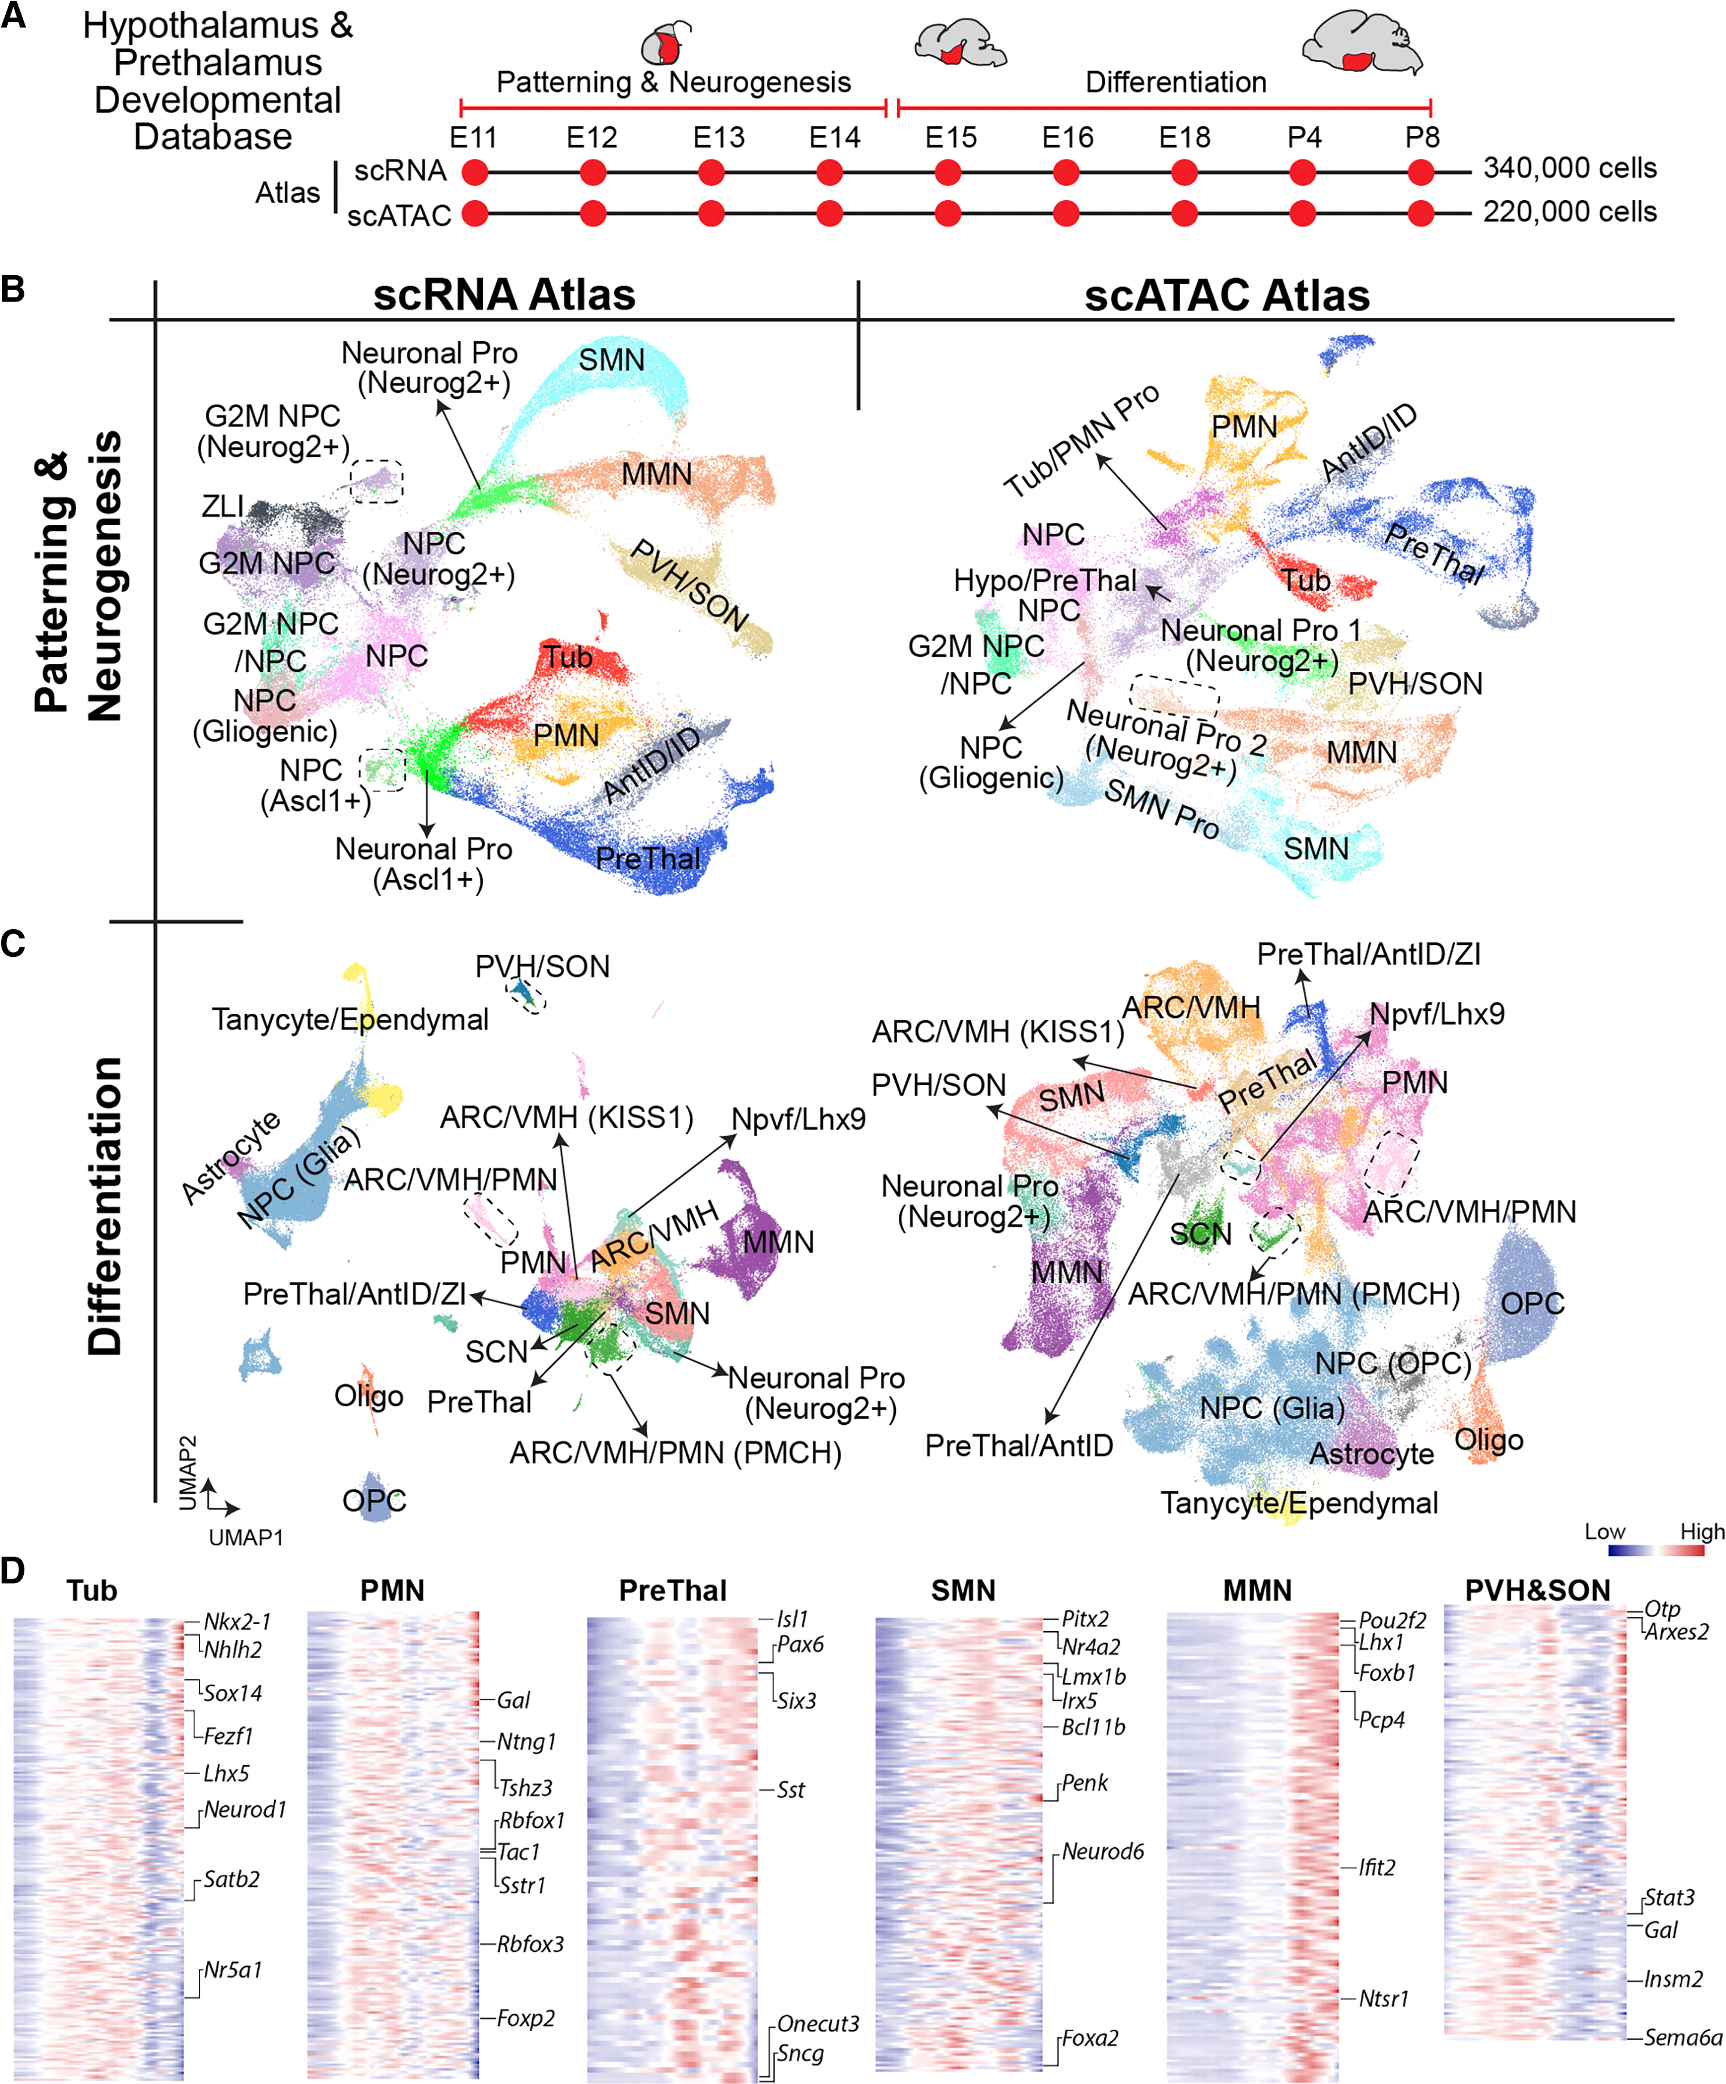
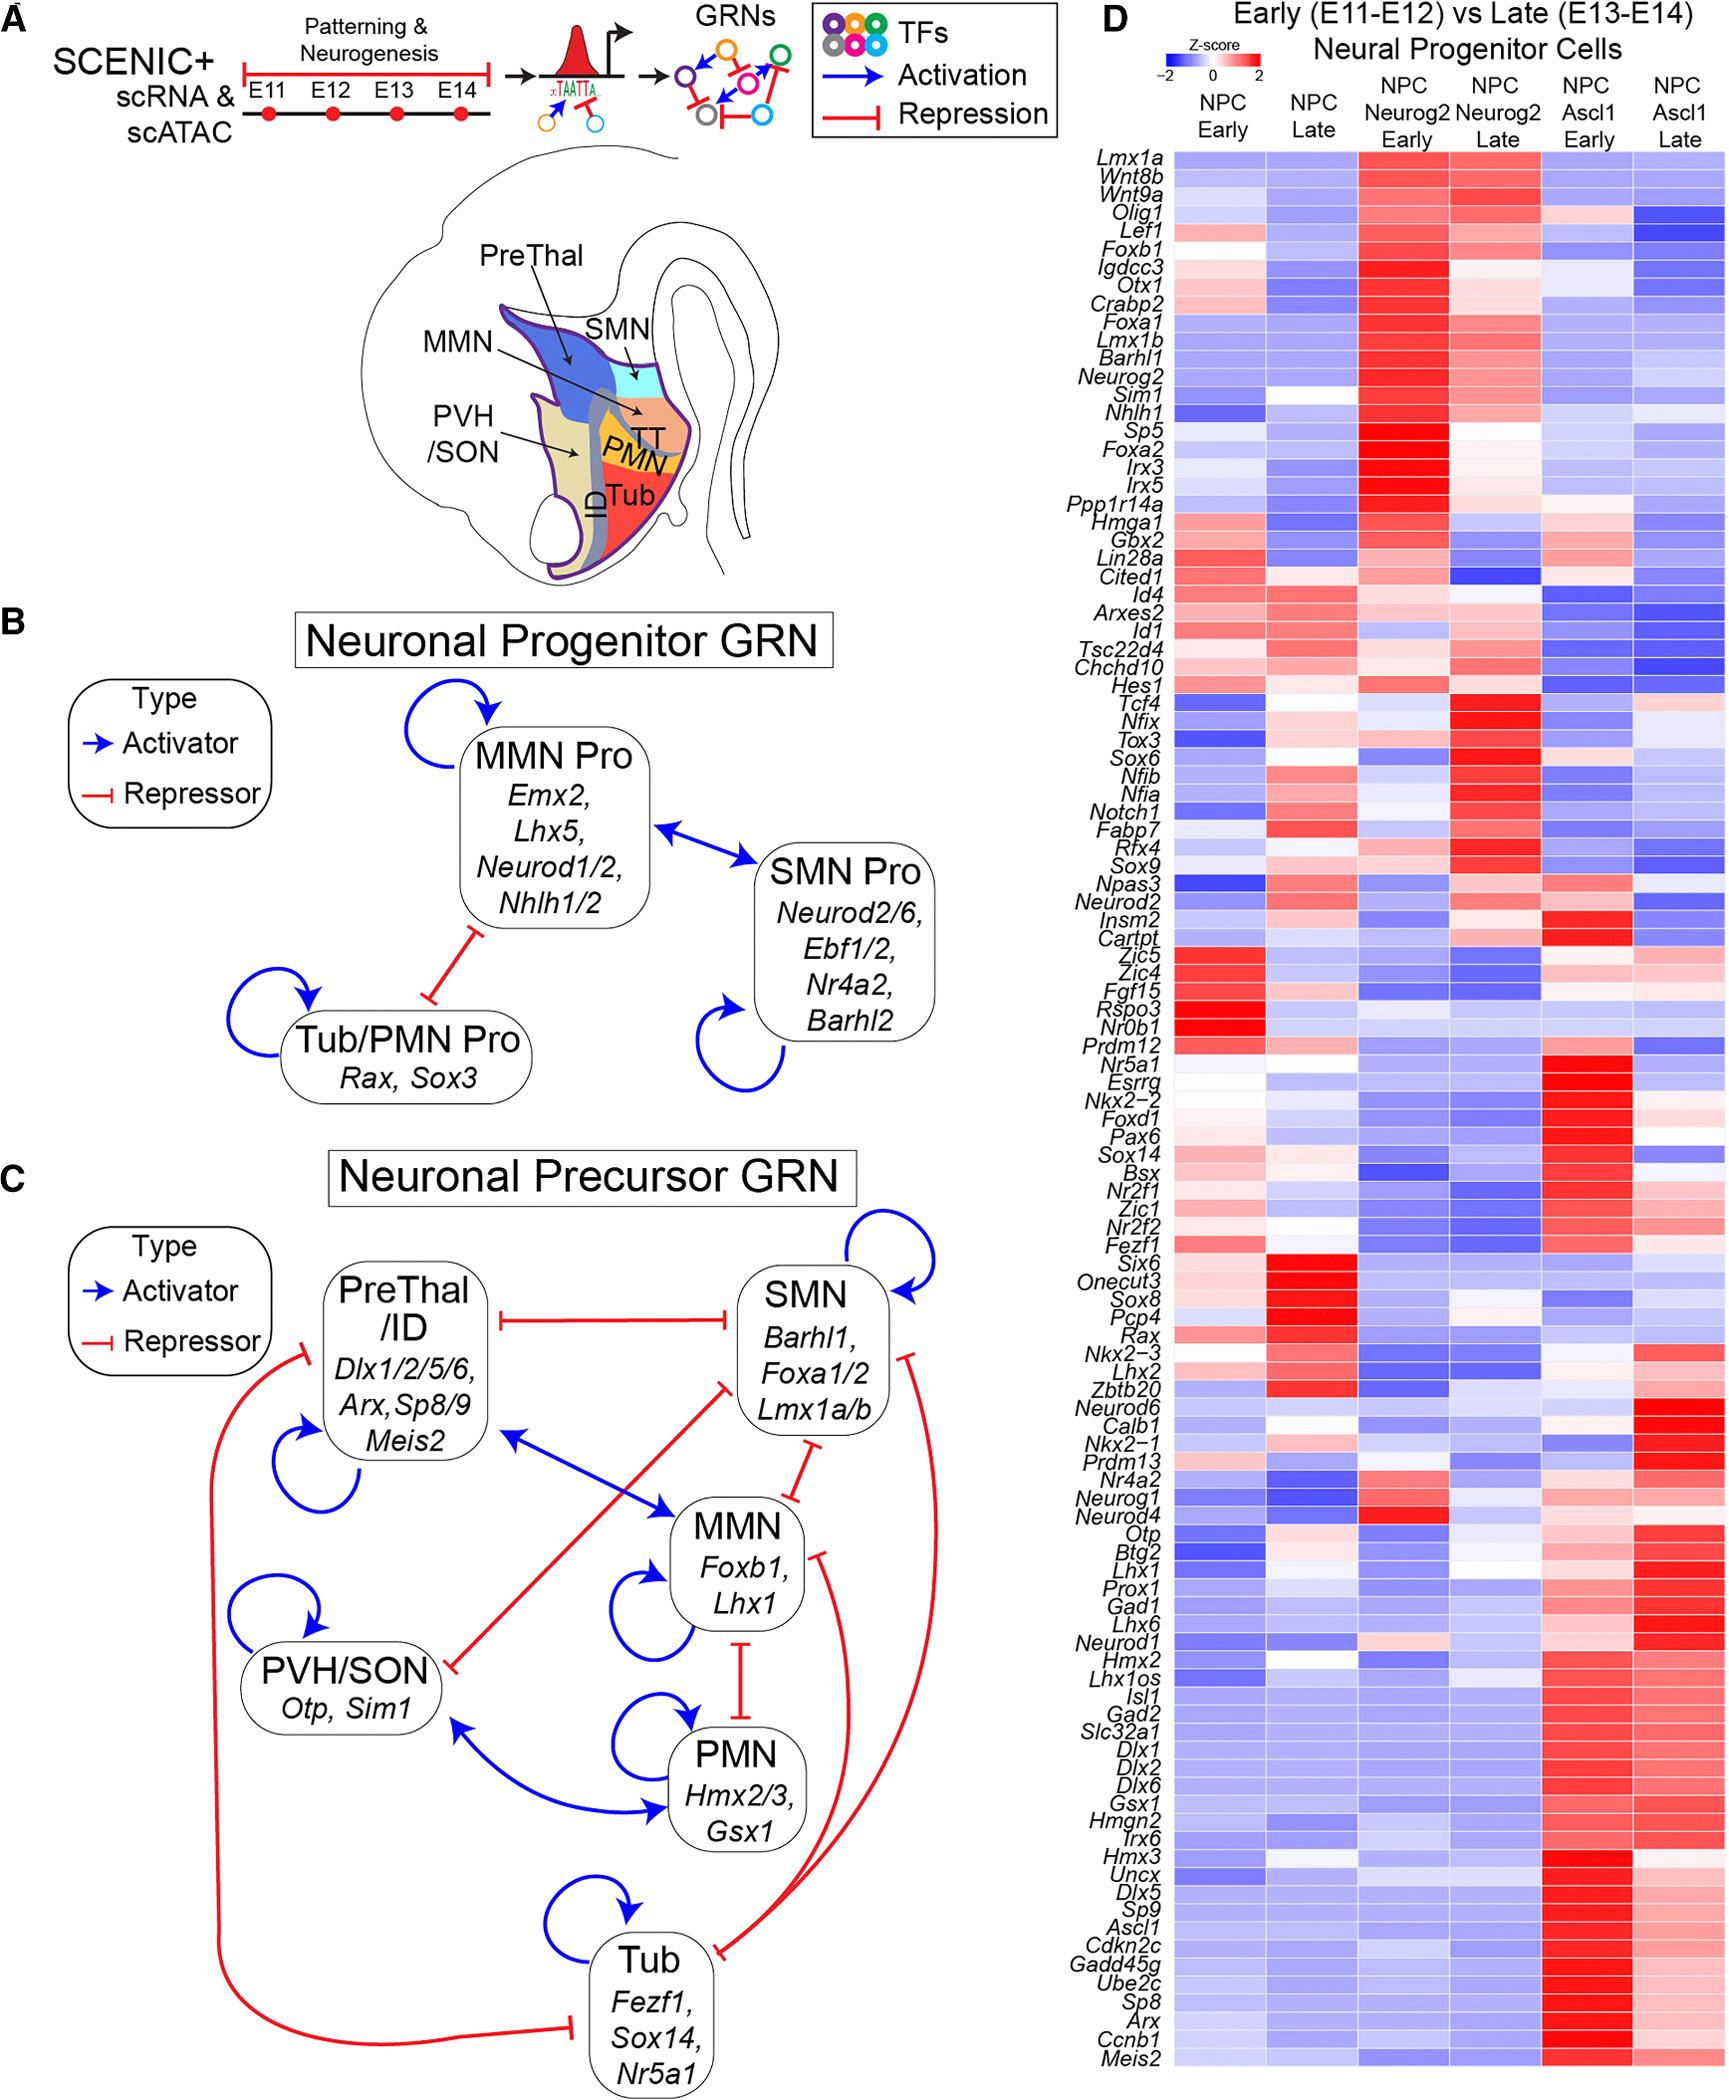
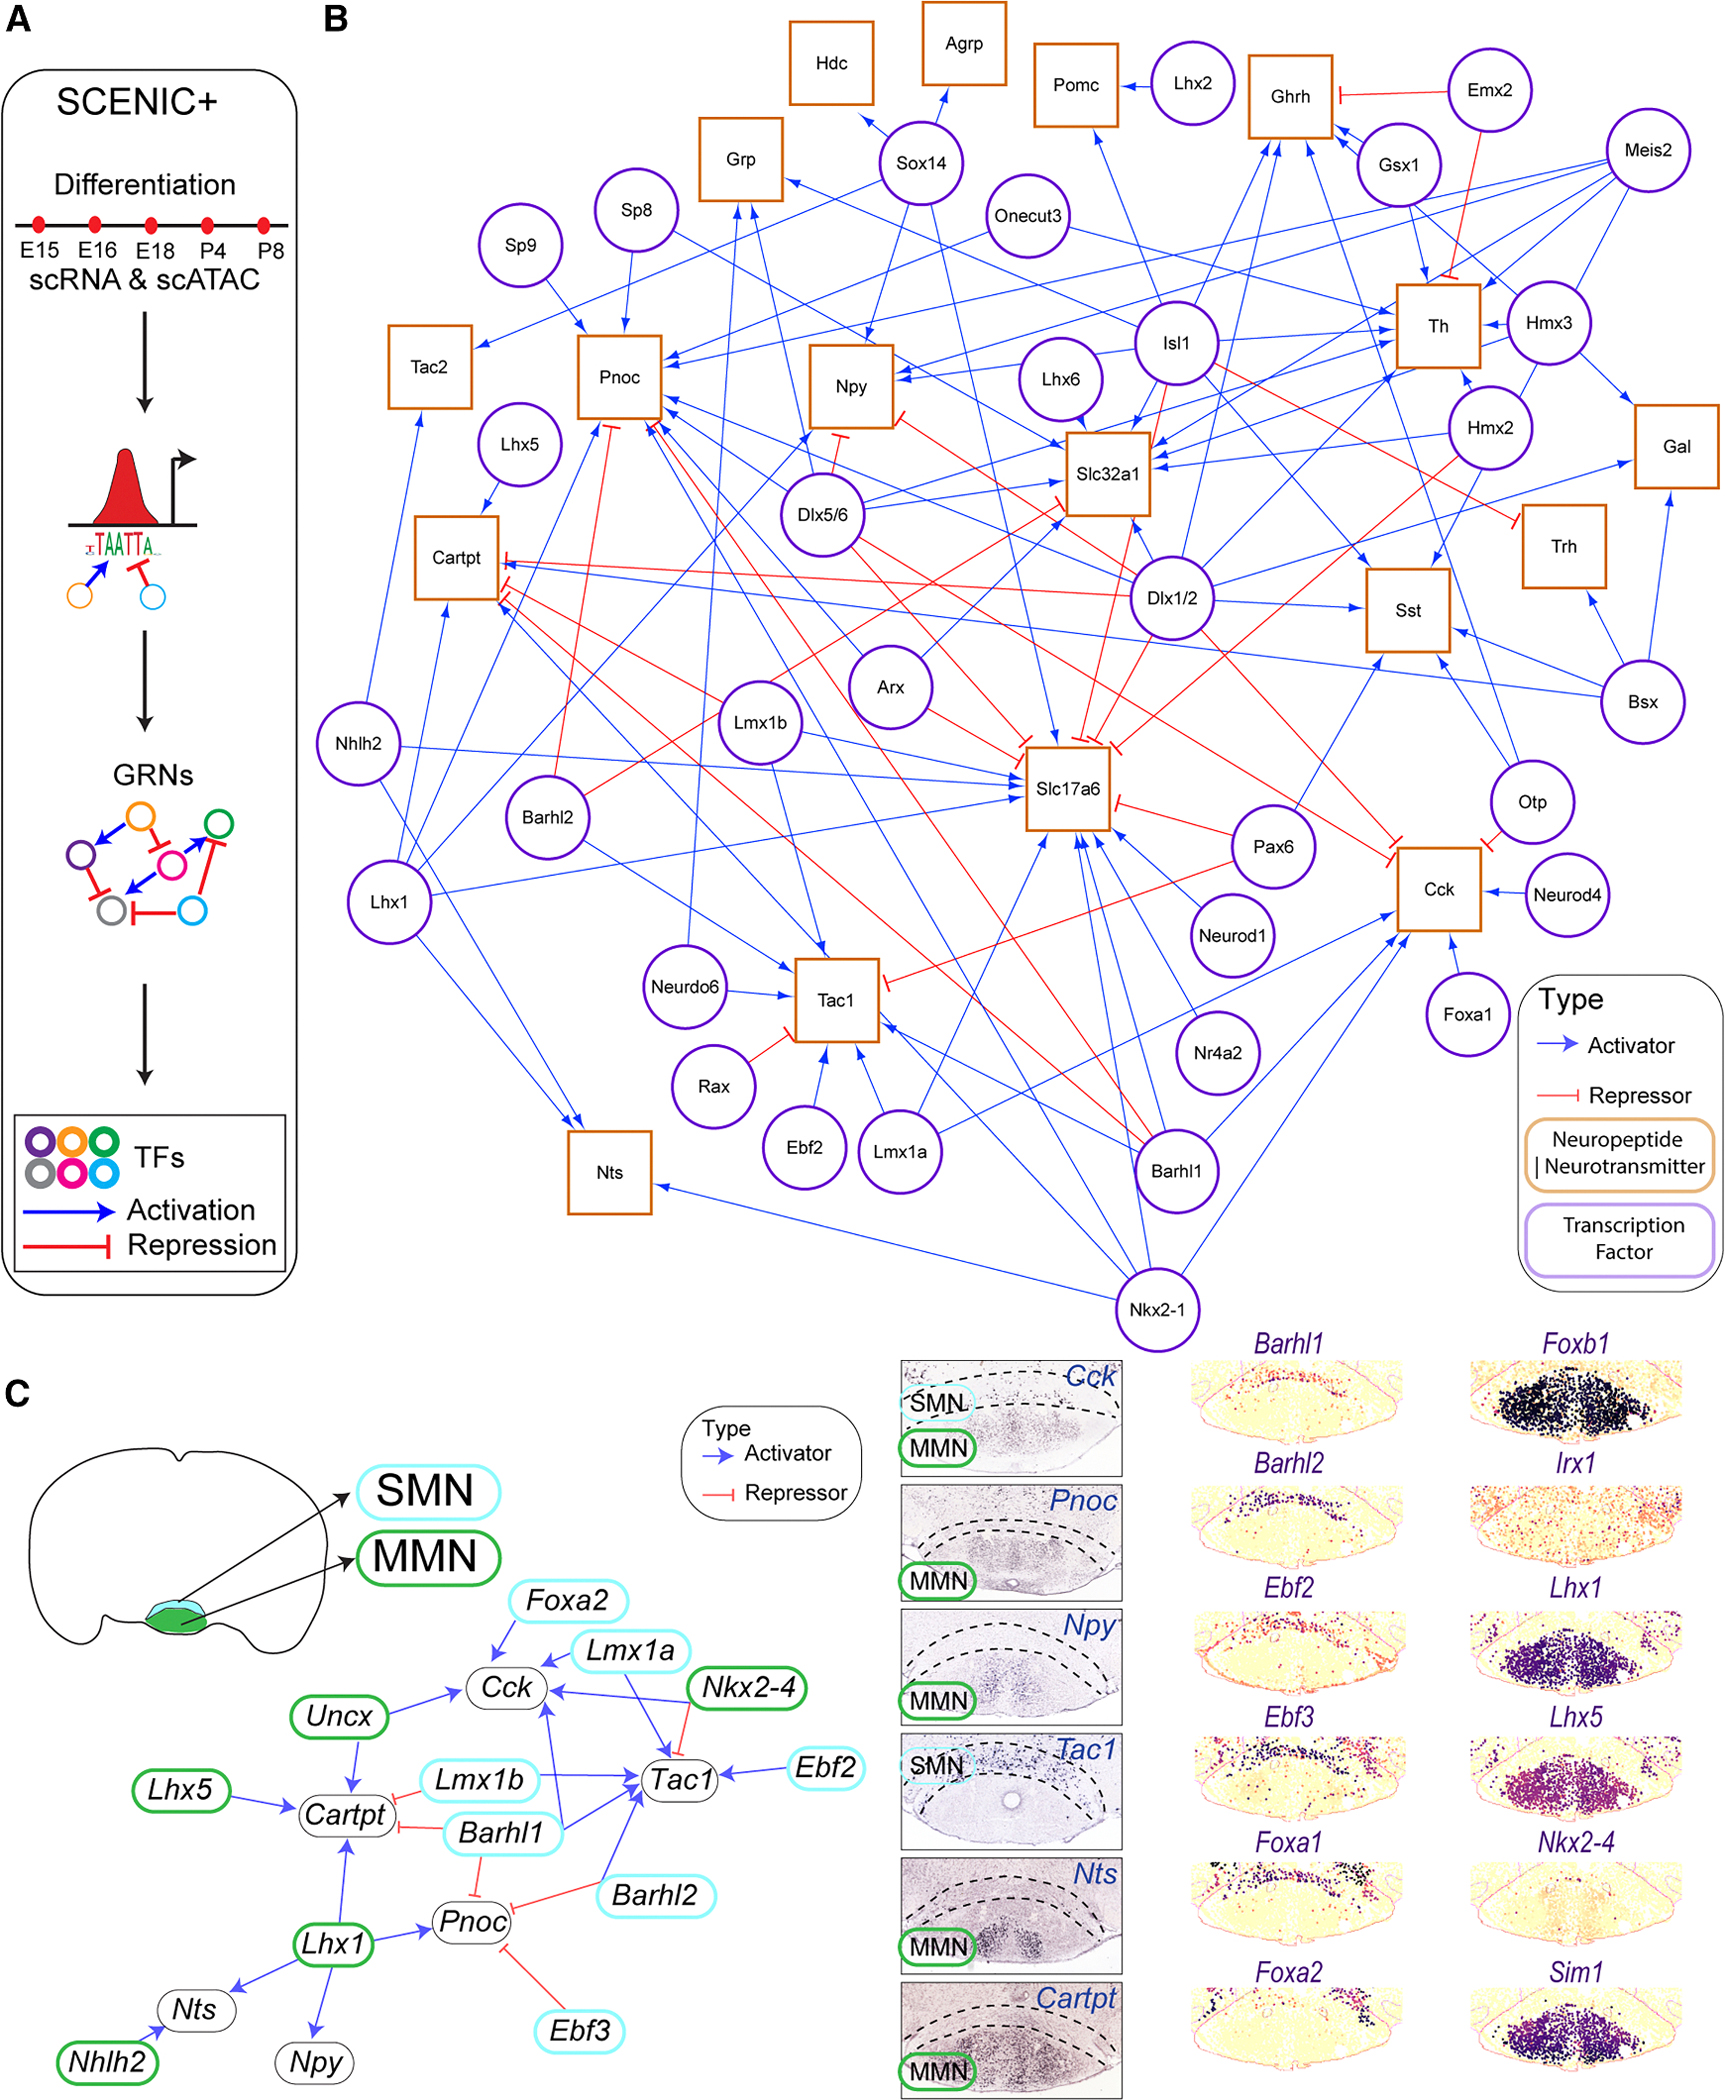
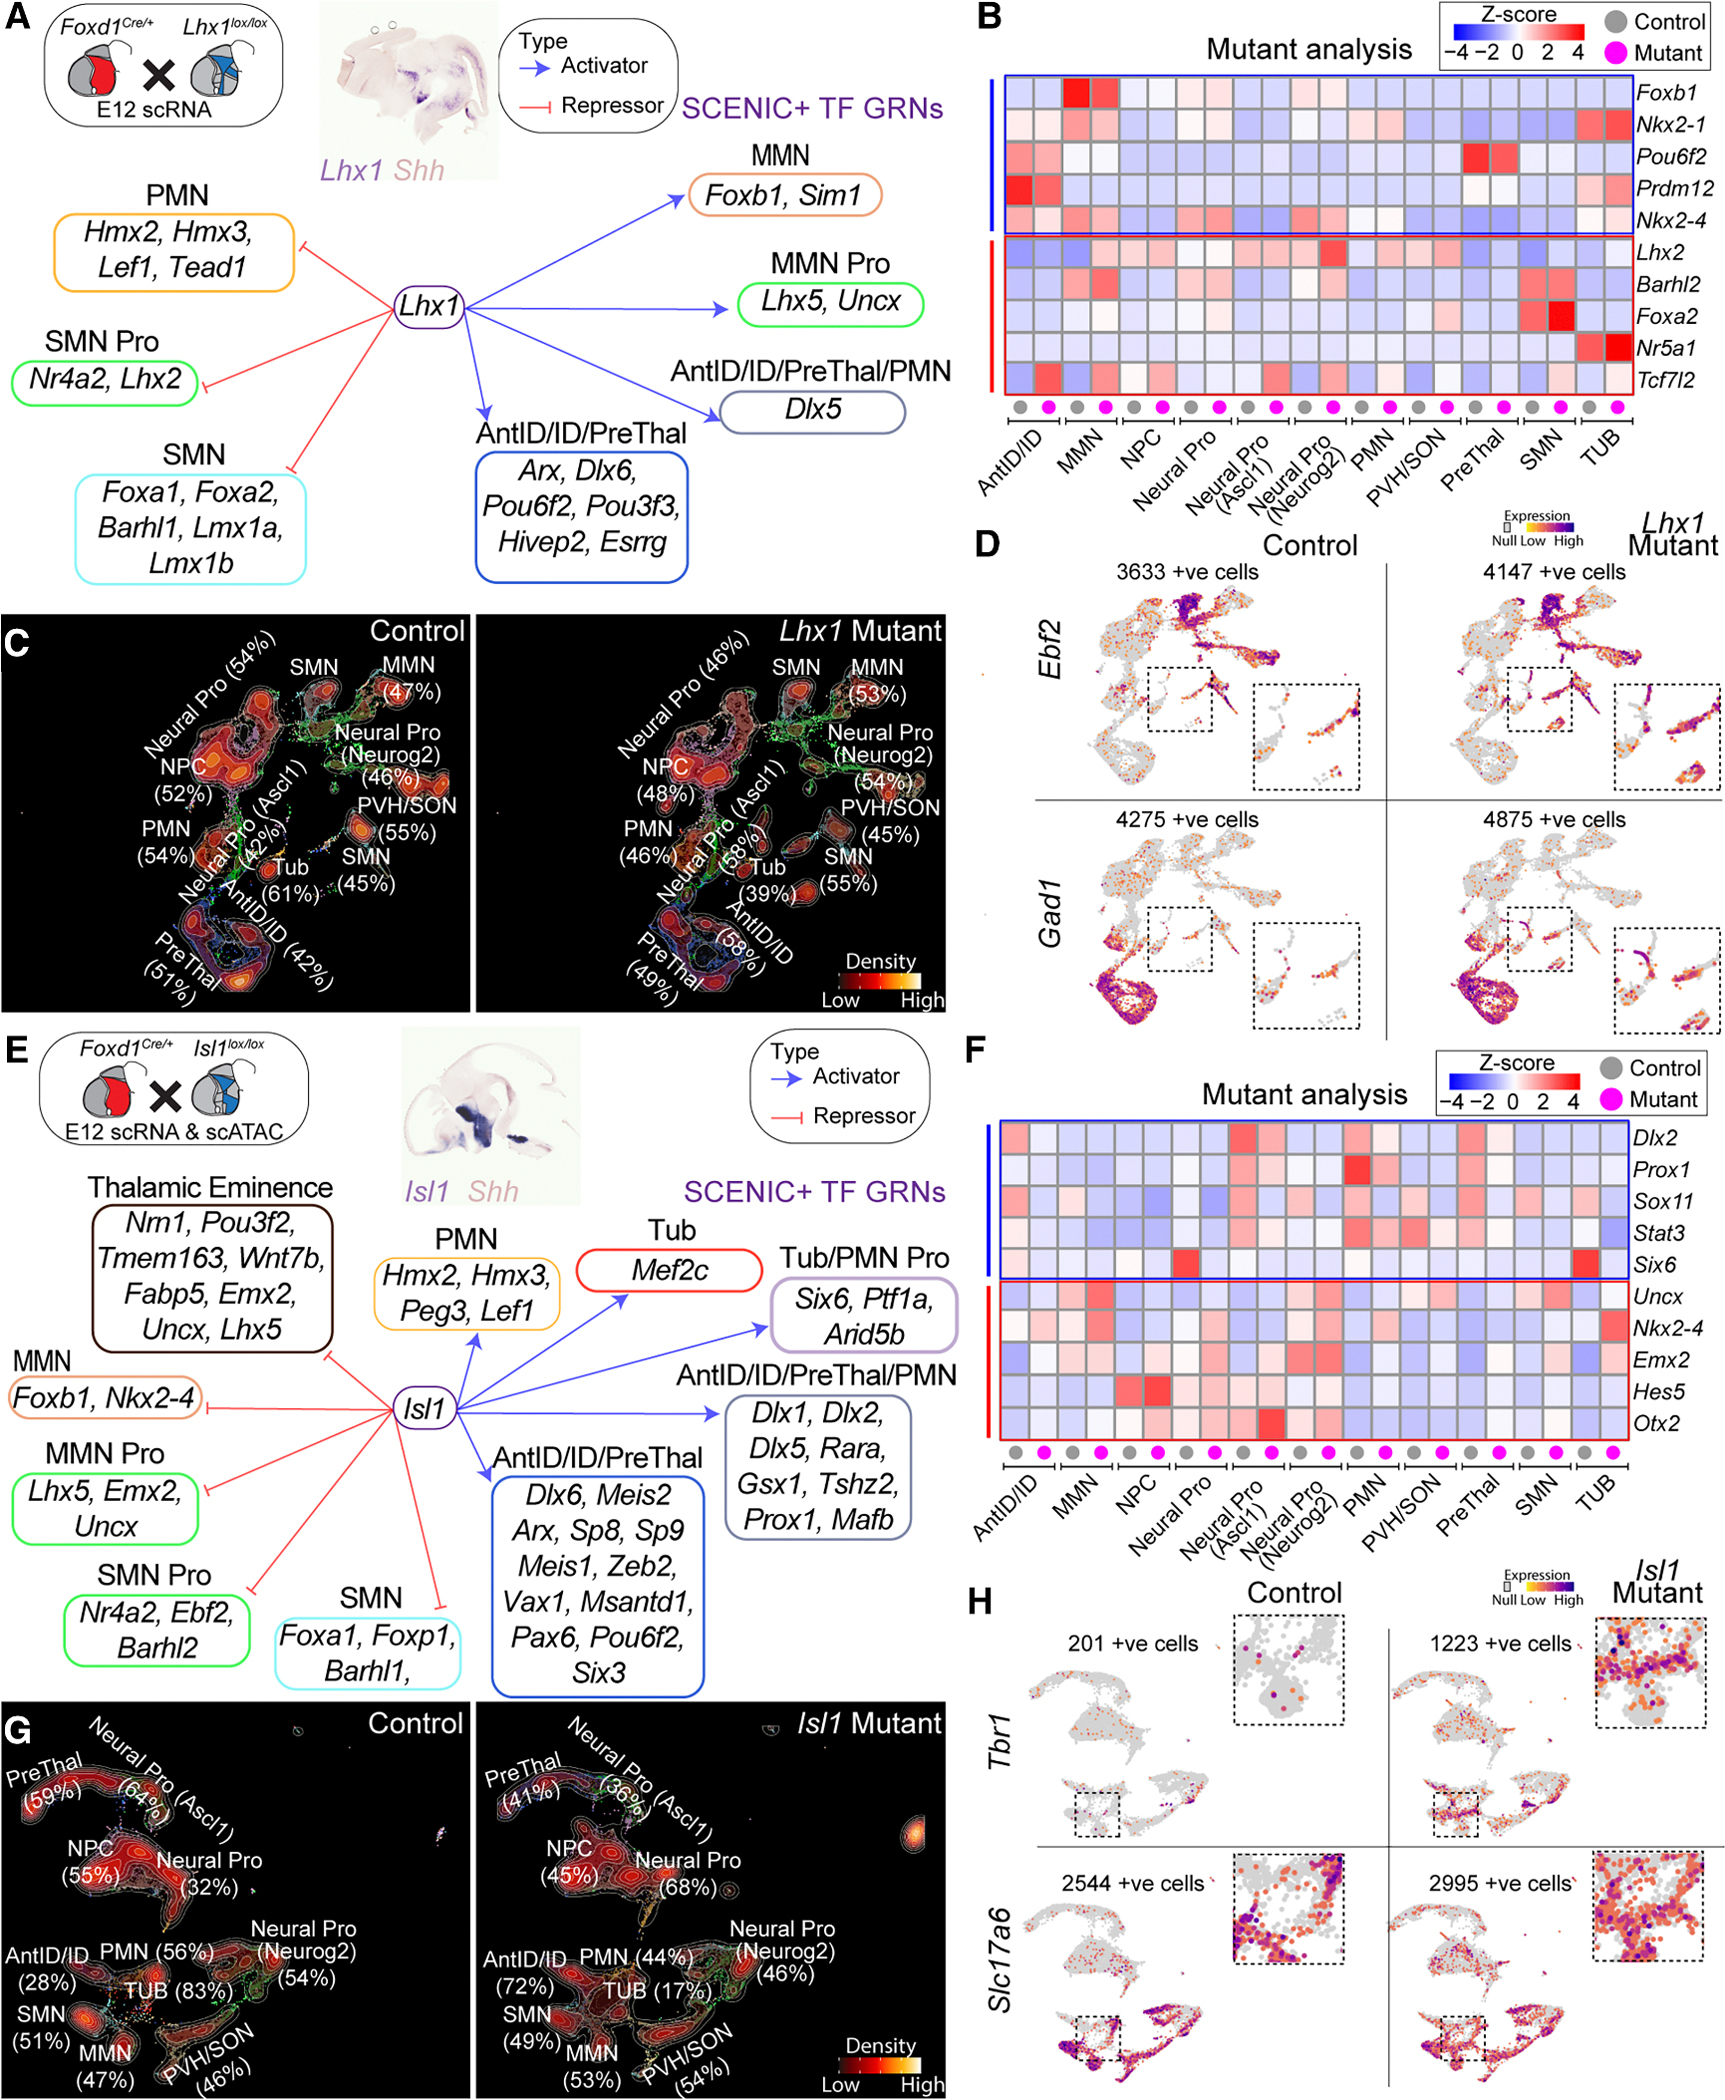
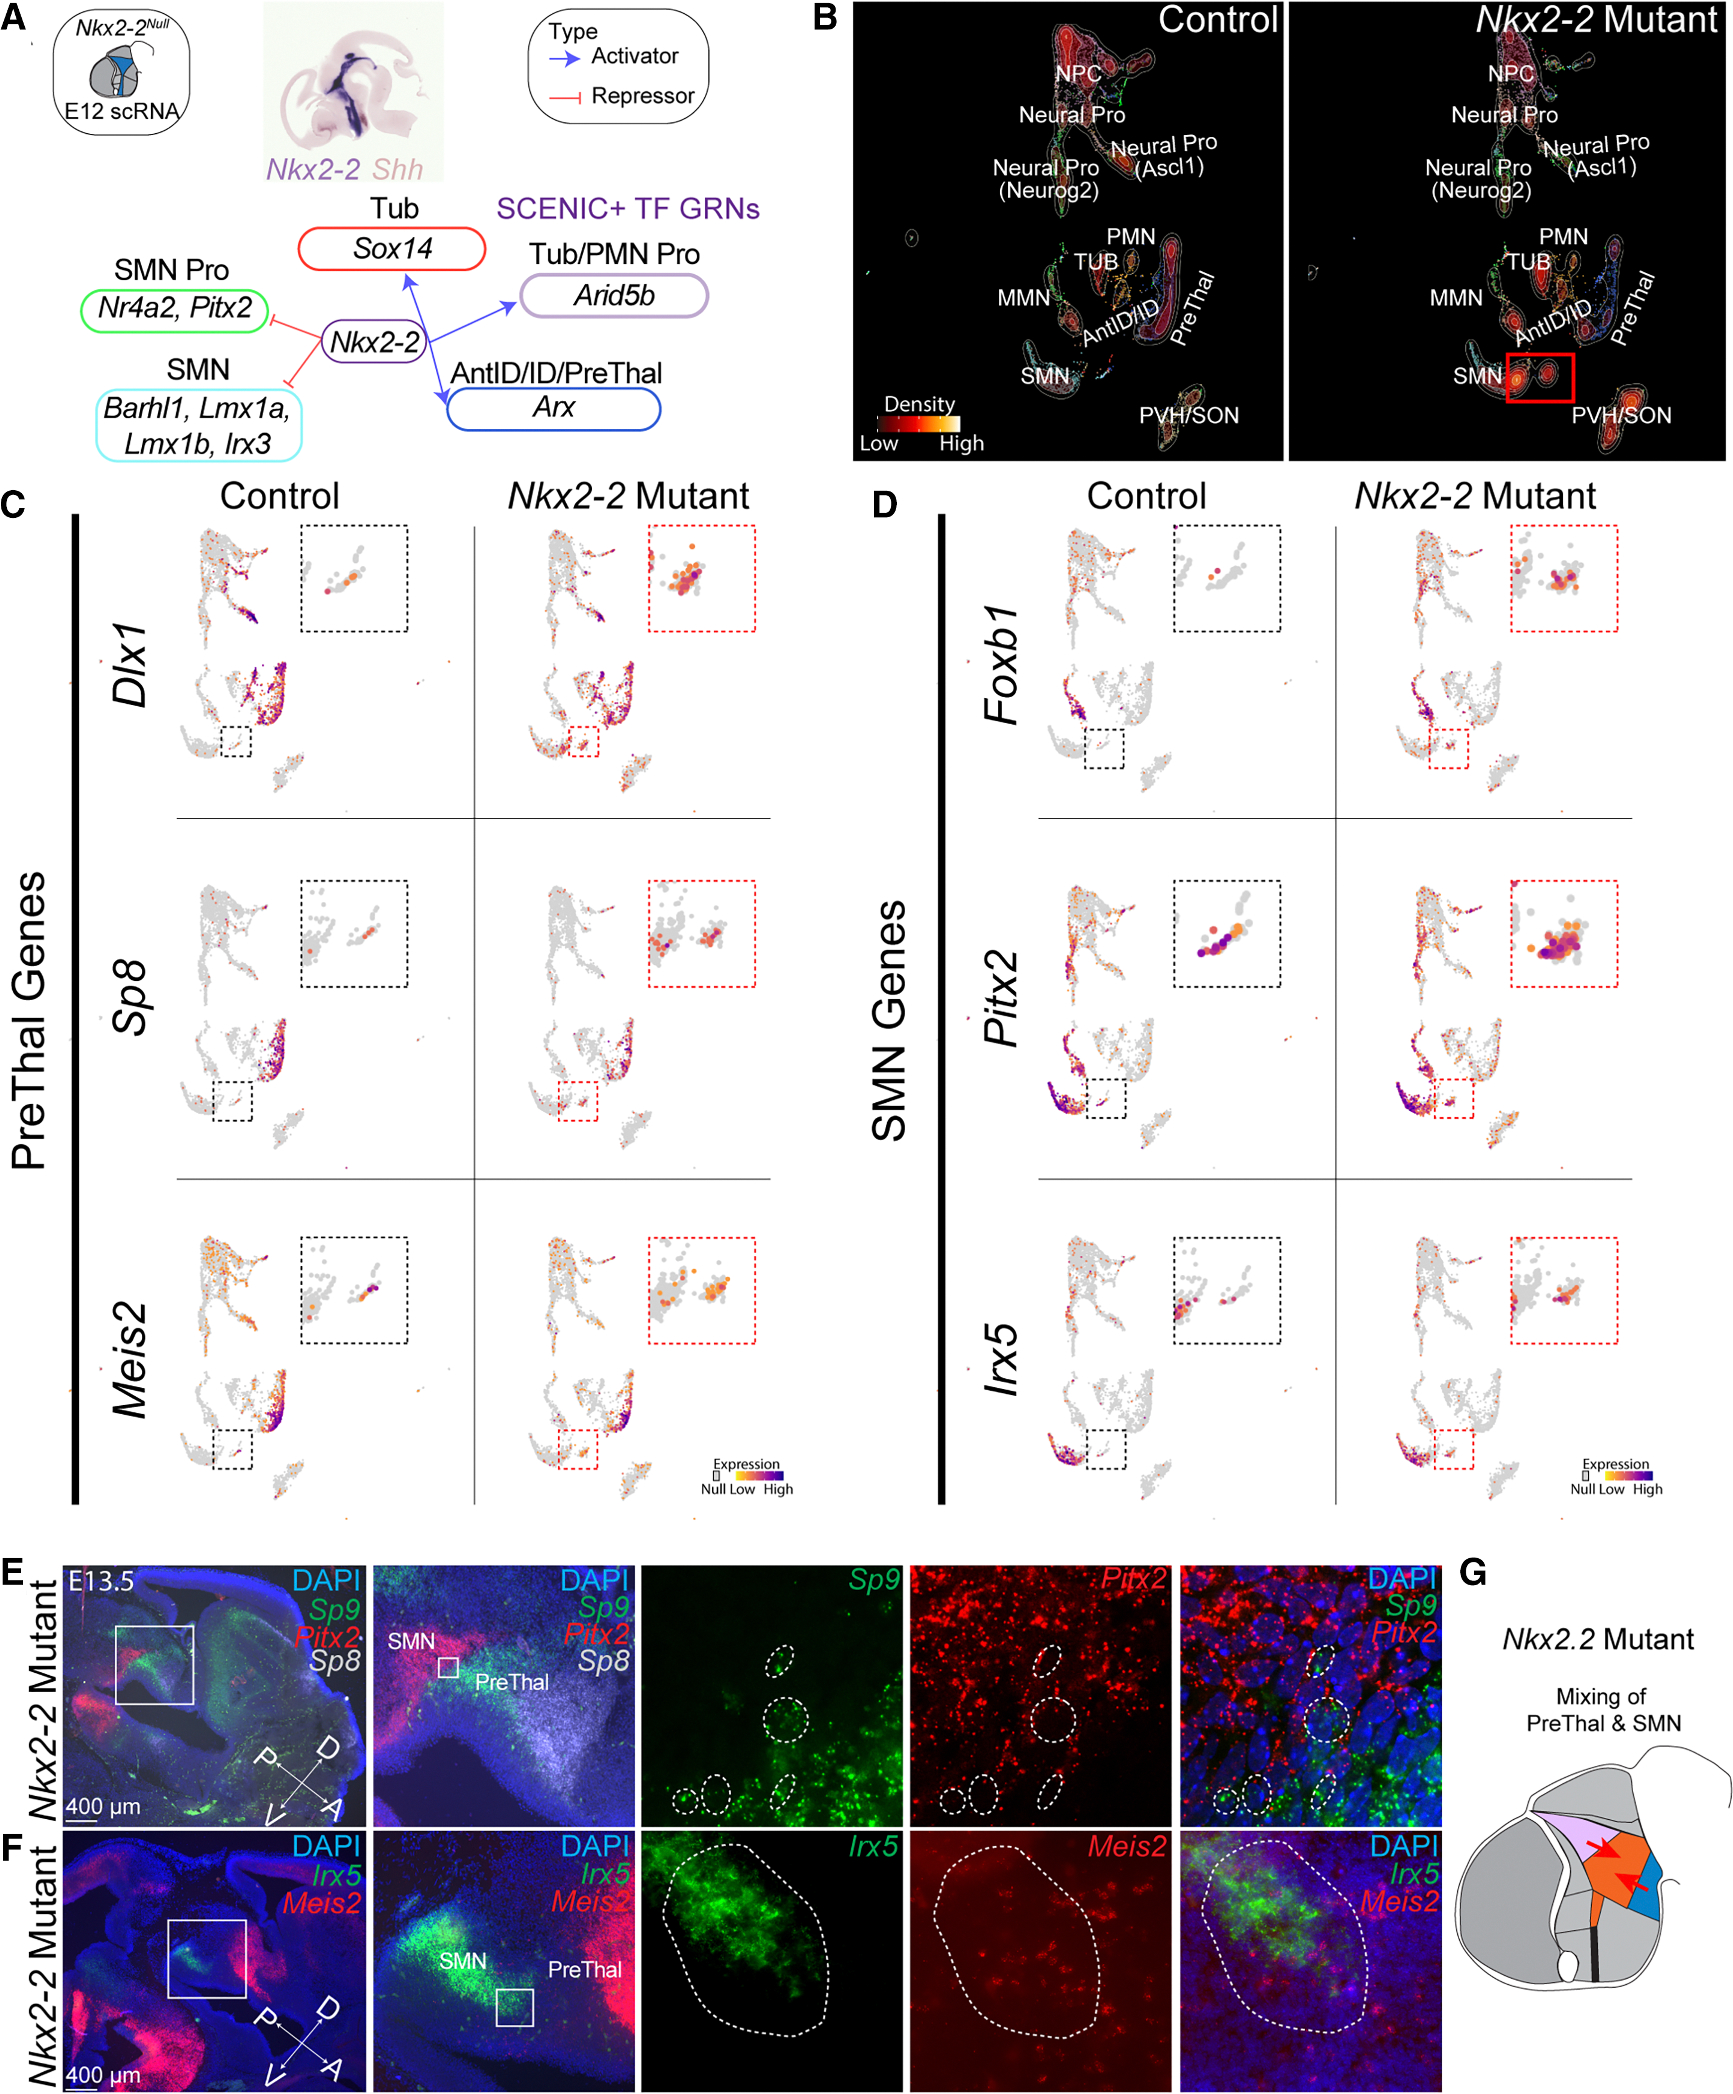
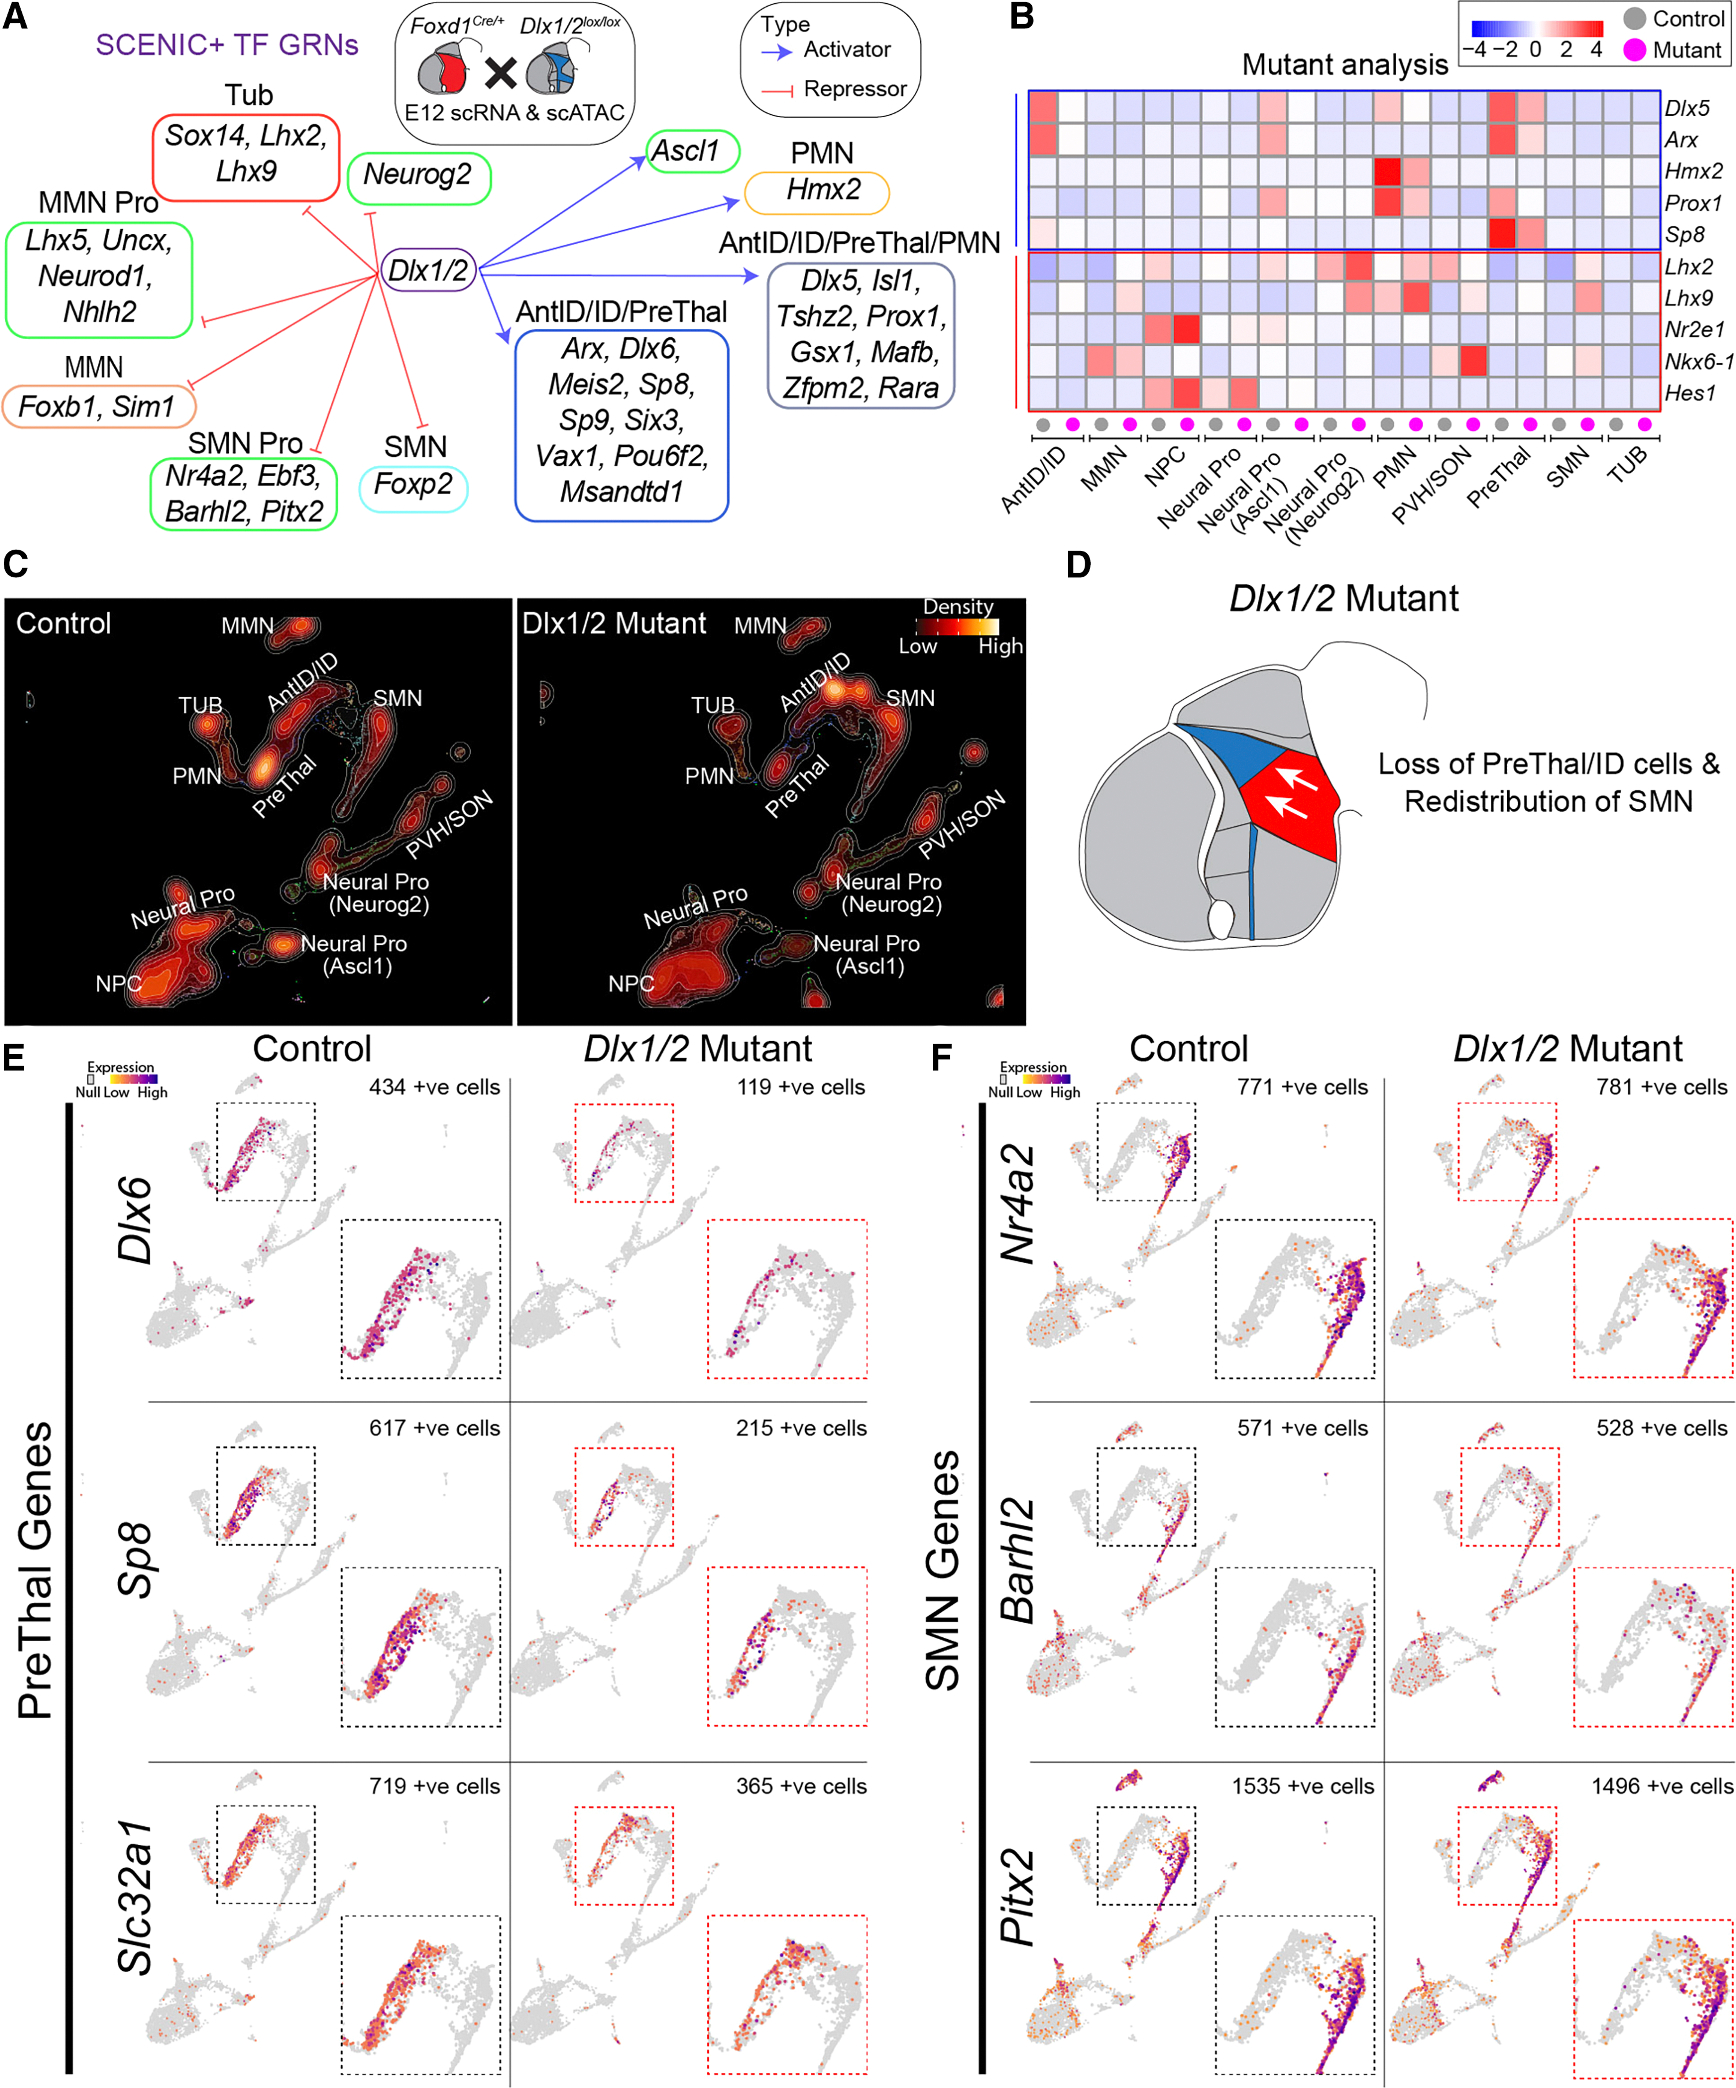
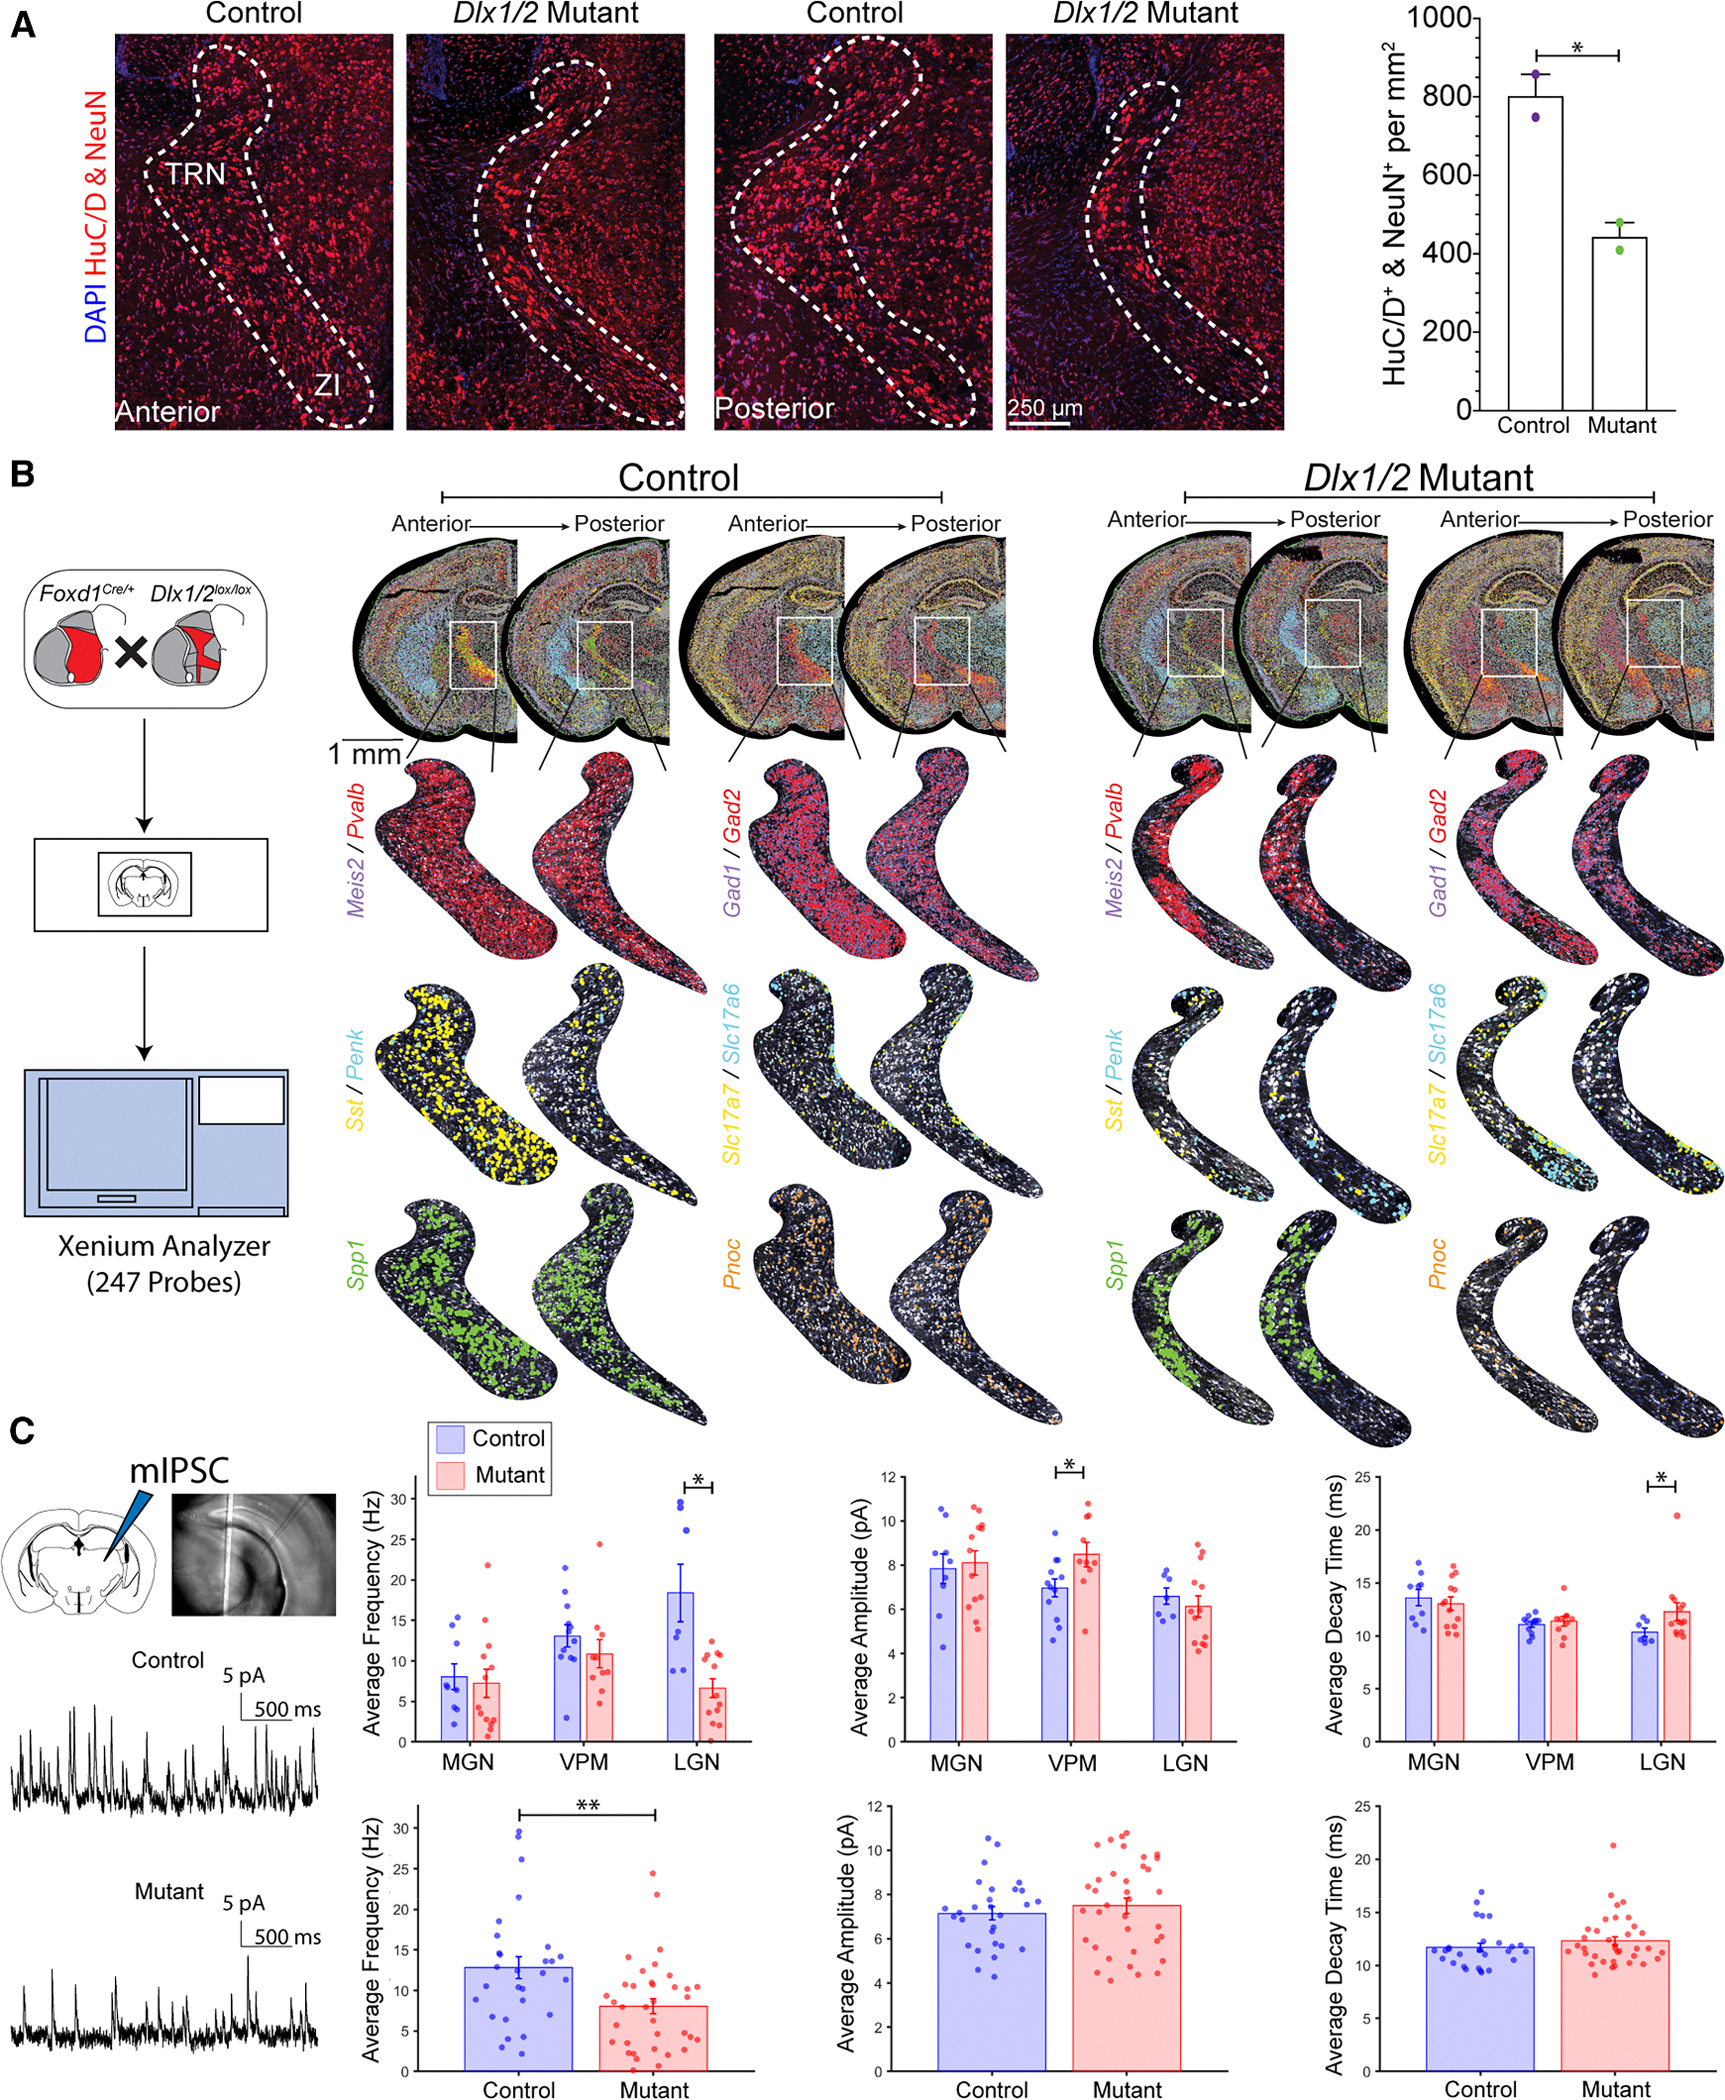
Verification
Claims the paper makes
The claims and statistics of this paper haven’t been checked yet.
Free: it reads the open-access text and checks the first 5 claims that cite a source we can check. Create a free account to check every claim.
Claims other papers make about this one
Each is checked against this paper’s own text: does it say what the citing paper says it does?
In the citing paper
“Analysis of single-cell RNA sequencing datasets[13,54,56] confirms that microglia are the predominant cell type in the CNS expressing C3ar1 in mice (Fig.S2A–C).”
From Complement 3a Receptor mediates high fat diet induced hypothalamic accumulation of lipid associated microglia to regulate neuroinflammation and obesity (2026) · cites this paper as [56]
In the citing paper
“Analysis of publicly available single-cell RNA sequencing datasets[13,54,56] revealed that even under healthy, physiological circumstances, there are unique sub-populations of hypothalamic microglia exhibiting a LAM signature.”
From Complement 3a Receptor mediates high fat diet induced hypothalamic accumulation of lipid associated microglia to regulate neuroinflammation and obesity (2026) · cites this paper as [56]
Self-check
Percentages, sums and reported differences re-computed from the paper’s own numbers.
The self-check needs the paper’s full text.
Citations
Cites
Dictionary learning for integrative, multimodal and scalable single-cell analysis
Hao, Y., Stuart, T., Kowalski, M. H., Choudhary, S., Hoffman, P., Hartman, A., Srivastava, A., Molla, G., Madad, S., Fernandez-Granda, C., et al. (2024) · Nature Biotechnology · doi:10.1038/s41587-023-01767-y · Cited by 5,631
No evidence that carotenoid pigments boost either immune or antioxidant defenses in a songbird
Koch, R. E., Kavazis, A. N., Hasselquist, D., Hood, W. R., Zhang, Y., Toomey, M. B., & Hill, G. E. (2018) · Nature Communications · doi:10.1038/s41467-018-02974-x · Cited by 1,924
The NHGRI-EBI GWAS Catalog: knowledgebase and deposition resource
Sollis, E., Mosaku, A., Abid, A., Buniello, A., Cerezo, M., Gil, L., Groza, T., Güneş, O., Hall, P., Hayhurst, J., et al. (2023) · Nucleic Acids Research · doi:10.1093/nar/gkac1010 · Cited by 1,641 · cited 1×
“43 This connected TF activity in NPC and precursor populations to genetic variants associated with complex traits and diseases, revealing how early transcriptional regulation may shape disease susceptibility (Figure S4).”
Molecular, spatial, and functional single-cell profiling of the hypothalamic preoptic region
Moffitt, J. R., Bambah-Mukku, D., Eichhorn, S. W., Vaughn, E., Shekhar, K., Perez, J. D., Rubinstein, N. D., Hao, J., Regev, A., Dulac, C., et al. (2018) · Science · doi:10.1126/science.aau5324 · Cited by 1,365
SFARI Gene 2.0: a community-driven knowledgebase for the autism spectrum disorders (ASDs)
Abrahams, B. S., Arking, D. E., Campbell, D. B., Mefford, H. C., Morrow, E. M., Weiss, L. A., Menashe, I., Wadkins, T., Banerjee-Basu, S., & Packer, A. (2013) · Molecular Autism · doi:10.1186/2040-2392-4-36 · Cited by 873
SCENIC+: single-cell multiomic inference of enhancers and gene regulatory networks
Bravo González-Blas, C., De Winter, S., Hulselmans, G., Hecker, N., Matetovici, I., Christiaens, V., Poovathingal, S., Wouters, J., Aibar, S., & Aerts, S. (2023) · Nature Methods · doi:10.1038/s41592-023-01938-4 · Cited by 778 · cited 3×
“To identify GRNs controlling hypothalamic regionalization and neurogenesis, we applied SCENIC+ analysis, 27 which integrates gene expression and chromatin accessibility to infer patterns of TF activity.”
The origin and evolution of cell types
Arendt, D., Musser, J. M., Baker, C. V. H., Bergman, A., Cepko, C., Erwin, D. H., Pavlicev, M., Schlosser, G., Widder, S., Laubichler, M. D., et al. (2016) · Nature Reviews Genetics · doi:10.1038/nrg.2016.127 · Cited by 764
Molecular interrogation of hypothalamic organization reveals distinct dopamine neuronal subtypes
Romanov, R. A., Zeisel, A., Bakker, J., Girach, F., Hellysaz, A., Tomer, R., Alpár, A., Mulder, J., Clotman, F., Keimpema, E., et al. (2017) · Nature Neuroscience · doi:10.1038/nn.4462 · Cited by 502
Temporal patterning of apical progenitors and their daughter neurons in the developing neocortex
Telley, L., Agirman, G., Prados, J., Amberg, N., Fièvre, S., Oberst, P., Bartolini, G., Vitali, I., Cadilhac, C., Hippenmeyer, S., et al. (2019) · Science · doi:10.1126/science.aav2522 · Cited by 423
A genomic atlas of mouse hypothalamic development
Shimogori, T., Lee, D. A., Miranda-Angulo, A., Yang, Y., Wang, H., Jiang, L., Yoshida, A. C., Kataoka, A., Mashiko, H., Avetisyan, M., et al. (2010) · Nature Neuroscience · doi:10.1038/nn.2545 · Cited by 382
Self-citation
Research works printed but not linked: 78
- Crabtree, 2018, Functional Diversity of Thalamic Reticular Subnetworks, Front. Syst. Neurosci., 12, 41, 10.3389/fnsys.2018.00041 · DOI
- Çavdar, 2006, Connections of the zona incerta to the reticular nucleus of the thalamus in the rat, J. Anat., 209, 251, 10.1111/j.1469-7580.2006.00600.x · DOI
- Chou, 2018, Inhibitory gain modulation of defense behaviors by zona incerta, Nat. Commun., 9, 1151, 10.1038/s41467-018-03581-6 · DOI · Paper page
- Watson, 2015, The Zona Incerta Regulates Communication between the Superior Colliculus and the Posteromedial Thalamus: Implications for Thalamic Interactions with the Dorsolateral Striatum, J. Neurosci., 35, 9463, 10.1523/JNEUROSCI.1606-15.2015 · DOI
- Zhang, 2023, Molecularly defined and spatially resolved cell atlas of the whole mouse brain, Nature, 624, 343, 10.1038/s41586-023-06808-9 · DOI · Paper page
- Tessmar-Raible, 2007, Conserved sensory-neurosecretory cell types in annelid and fish forebrain: insights into hypothalamus evolution, Cell, 129, 1389, 10.1016/j.cell.2007.04.041 · DOI · Paper page
- Fong, 2023, The structural and functional complexity of the integrative hypothalamus, Sci. Technol. Humanit., 382, 388
- Vue, 2007, Characterization of progenitor domains in the developing mouse thalamus, J. Comp. Neurol., 505, 73, 10.1002/cne.21467 · DOI
- Blanco-Centurion, 2021, Activity of a subset of vesicular GABA-transporter neurons in the ventral zona incerta anticipate sleep onset, Sleep, 44, 10.1093/sleep/zsaa268 · DOI
- Ye, 2023, Zona incerta dopamine neurons encode motivational vigor in food seeking, Sci. Adv., 9, 10.1126/sciadv.adi5326 · DOI
- Liu, 2017, Corrigendum: Lhx6-positive GABA-releasing neurons of the zona incerta promote sleep, Nature, 550, 548, 10.1038/nature24274 · doi:10.1038/nature24274
- Zhang, 2017, Rapid binge-like eating and body weight gain driven by zona incerta GABA neuron activation, Sci. Technol. Humanit., 356, 853
- Ahmadlou, 2021, A cell type-specific cortico-subcortical brain circuit for investigatory and novelty-seeking behavior, Sci. Technol. Humanit., 372
- Mickelsen, 2019, Single-cell transcriptomic analysis of the lateral hypothalamic area reveals molecularly distinct populations of inhibitory and excitatory neurons, Nat. Neurosci., 22, 642, 10.1038/s41593-019-0349-8 · DOI · Paper page
- Zhou, 2022, Deciphering the spatial-temporal transcriptional landscape of human hypothalamus development, Cell Stem Cell, 29, 328, 10.1016/j.stem.2021.11.009 · DOI
- Huang, 2021, Generation of hypothalamic arcuate organoids from human induced pluripotent stem cells, Cell Stem Cell, 28, 1657, 10.1016/j.stem.2021.04.006 · DOI · Paper page
- Kim, 2022, Single-cell analysis of early chick hypothalamic development reveals that hypothalamic cells are induced from prethalamic-like progenitors, Cell Rep., 38, 10.1016/j.celrep.2021.110251 · DOI
- Kim, 2020, The cellular and molecular landscape of hypothalamic patterning and differentiation from embryonic to late postnatal development, Nat. Commun., 11, 4360, 10.1038/s41467-020-18231-z · DOI · Paper page
- Zhou, 2020, Cellular and molecular properties of neural progenitors in the developing mammalian hypothalamus, Nat. Commun., 11, 4063, 10.1038/s41467-020-17890-2 · DOI
- Romanov, 2020, Molecular design of hypothalamus development, Nature, 582, 246, 10.1038/s41586-020-2266-0 · DOI · Paper page
- Lyu, 2021, Gene regulatory networks controlling temporal patterning, neurogenesis, and cell-fate specification in mammalian retina, Cell Rep., 37, 10.1016/j.celrep.2021.109994 · DOI
- Aslanpour, 2020, Acts as a Classical Proneural Gene in the Ventromedial Hypothalamus and Is Required for the Early Phase of Neurogenesis, J. Neurosci., 40, 3549, 10.1523/JNEUROSCI.2610-19.2020 · DOI
- Cao, 2019, The single-cell transcriptional landscape of mammalian organogenesis, Nature, 566, 496, 10.1038/s41586-019-0969-x · DOI · Paper page
- Niimi, 2005, Neuropeptide W as a stress mediator in the hypothalamus, Endocrine, 27, 51, 10.1385/ENDO:27:1:051 · DOI
- Motoike, 2015, Transient expression of neuropeptide W in postnatal mouse hypothalamus--a putative regulator of energy homeostasis, Neuroscience, 301, 323, 10.1016/j.neuroscience.2015.06.014 · DOI
- Ladenheim, 2009, Gastrin-releasing peptide messenger ribonucleic acid expression in the hypothalamic paraventricular nucleus is altered by melanocortin receptor stimulation and food deprivation, Endocrinology, 150, 672, 10.1210/en.2008-0559 · DOI
- Beinfeld, 1981, The distribution of cholecystokinin immunoreactivity in the central nervous system of the rat as determined by radioimmunoassay, Brain Res., 212, 51, 10.1016/0006-8993(81)90031-7 · DOI · Paper page
- Lee, 2020, Neuropeptide VF neurons promote sleep via the serotonergic raphe, eLife, 9, 10.7554/eLife.54491 · DOI
- Oberst, 2019, Principles of progenitor temporal patterning in the developing invertebrate and vertebrate nervous system, Curr. Opin. Neurobiol., 56, 185, 10.1016/j.conb.2019.03.004 · DOI
- Chen, 2022, Integration of Spatial and Temporal Patterning in the Invertebrate and Vertebrate Nervous System, Front. Neurosci., 16
- Clark, 2019, Single-Cell RNA-Seq Analysis of Retinal Development Identifies NFI Factors as Regulating Mitotic Exit and Late-Born Cell Specification, Neuron (Camb., Mass.), 102, 1111, 10.1016/j.neuron.2019.04.010 · DOI · Paper page
- Zhang, 2024, The cis-regulatory logic integrating spatial and temporal patterning in the vertebrate neural tube, bioRxiv
- Sagner, 2021, A shared transcriptional code orchestrates temporal patterning of the central nervous system, PLoS Biol., 19, 10.1371/journal.pbio.3001450 · DOI
- Kremer, 1992, The hypothalamic lateral tuberal nucleus: normal anatomy and changes in neurological diseases, Prog. Brain Res., 93, 249, 10.1016/S0079-6123(08)64576-8 · DOI
- Corbet Burcher, 2019, Neuropsychiatric profile of paediatric hypothalamic hamartoma: systematic review and case series, Dev. Med. Child Neurol., 61, 1377, 10.1111/dmcn.14241 · DOI
- Ruggeri, 2024, Hypothalamic Subunit Volumes in Schizophrenia and Bipolar Spectrum Disorders, Schizophr. Bull., 50, 533, 10.1093/schbul/sbad176 · DOI
- Zhang, 2021, Activation State of the Supramammillary Nucleus Regulates Body Composition and Peripheral Fuel Metabolism, Neuroscience, 466, 125, 10.1016/j.neuroscience.2021.05.005 · DOI
- López-Ferreras, 2019, GLP-1 modulates the supramammillary nucleus-lateral hypothalamic neurocircuit to control ingestive and motivated behavior in a sex divergent manner, Mol. Metab., 20, 178, 10.1016/j.molmet.2018.11.005 · DOI
- Douglas, 2018, De novo missense variants in MEIS2 recapitulate the microdeletion phenotype of cardiac and palate abnormalities, developmental delay, intellectual disability and dysmorphic features, Am. J. Med. Genet., 176, 1845, 10.1002/ajmg.a.40368 · DOI
- Davis, 2008, Pax6 3’ deletion results in aniridia, autism and mental retardation, Hum. Genet., 123, 371, 10.1007/s00439-008-0484-x · DOI
- Liu, 2009, The DLX1and DLX2 genes and susceptibility to autism spectrum disorders, Eur. J. Hum. Genet., 17, 228, 10.1038/ejhg.2008.148 · DOI
- Kesner, 2023, Hypothalamic Supramammillary Control of Cognition and Motivation, J. Neurosci., 43, 7538, 10.1523/JNEUROSCI.1320-23.2023 · DOI · Paper page
- Li, 2022, Hypothalamic modulation of adult hippocampal neurogenesis in mice confers activity-dependent regulation of memory and anxiety-like behavior, Nat. Neurosci., 25, 630, 10.1038/s41593-022-01065-x · DOI
- Lein, 2007, Genome-wide atlas of gene expression in the adult mouse brain, Nature, 445, 168, 10.1038/nature05453 · DOI · Paper page
- Lee, 2016, The LIM-homeobox transcription factor Isl1 plays crucial roles in the development of multiple arcuate nucleus neurons, Development, 143, 3763, 10.1242/dev.133967 · DOI
- Lee, 2018, Dlx1/2 and Otp coordinate the production of hypothalamic GHRH- and AgRP-neurons, Nat. Commun., 9, 2026, 10.1038/s41467-018-04377-4 · DOI
- Colasante, 2008, Arx is a direct target of Dlx2 and thereby contributes to the tangential migration of GABAergic interneurons, J. Neurosci., 28, 10674, 10.1523/JNEUROSCI.1283-08.2008 · DOI · Paper page
- Nakamura, 2019, The maternal immune activation model uncovers a role for the Arx gene in GABAergic dysfunction in schizophrenia, Brain Behav. Immun., 81, 161, 10.1016/j.bbi.2019.06.009 · DOI
- Cheong, 2015, Expression of ESR1 in Glutamatergic and GABAergic Neurons Is Essential for Normal Puberty Onset, Estrogen Feedback, and Fertility in Female Mice, J. Neurosci., 35, 14533, 10.1523/JNEUROSCI.1776-15.2015 · DOI · Paper page
- Newman, 2018, Foxd1 is required for terminal differentiation of anterior hypothalamic neuronal subtypes, Dev. Biol., 439, 102, 10.1016/j.ydbio.2018.04.012 · DOI
- Roy, 2013, LHX2 is necessary for the maintenance of optic identity and for the progression of optic morphogenesis, J. Neurosci., 33, 6877, 10.1523/JNEUROSCI.4216-12.2013 · DOI
- Nguyen, 2024, Regulation of neuronal fate specification and connectivity of the thalamic reticular nucleus by the Ascl1-Isl1 transcriptional cascade, Cell. Mol. Life Sci., 81, 478, 10.1007/s00018-024-05523-6 · DOI
- Briscoe, 1999, Homeobox gene Nkx2.2 and specification of neuronal identity by graded Sonic hedgehog signalling, Nature, 398, 622, 10.1038/19315 · DOI · Paper page
- Pla, 2018, Dlx1 and Dlx2 Promote Interneuron GABA Synthesis, Synaptogenesis, and Dendritogenesis, Cereb. Cortex, 28, 3797, 10.1093/cercor/bhx241 · DOI
- Lindtner, 2019, Genomic Resolution of DLX-Orchestrated Transcriptional Circuits Driving Development of Forebrain GABAergic Neurons, Cell Rep., 28, 2048, 10.1016/j.celrep.2019.07.022 · DOI
- Prokesch, 2011, Arxes: retrotransposed genes required for adipogenesis, Nucleic Acids Res., 39, 3224, 10.1093/nar/gkq1289 · DOI
- Mathis, 2018, DeepLabCut: markerless pose estimation of user-defined body parts with deep learning, Nat. Neurosci., 21, 1281, 10.1038/s41593-018-0209-y · DOI · Paper page
- Hippenmeyer, 2023, Principles of neural stem cell lineage progression: Insights from developing cerebral cortex, Curr. Opin. Neurobiol., 79, 10.1016/j.conb.2023.102695 · DOI
- Zhang, 2023, Molecular mechanisms controlling vertebrate retinal patterning, neurogenesis, and cell fate specification, Trends Genet., 39, 736, 10.1016/j.tig.2023.06.002 · DOI
- Zhang, 2021, Cascade diversification directs generation of neuronal diversity in the hypothalamus, Cell Stem Cell, 28, 1483, 10.1016/j.stem.2021.03.020 · DOI
- Arendt, 2019, Evolution of neuronal types and families, Curr. Opin. Neurobiol., 56, 144, 10.1016/j.conb.2019.01.022 · DOI
- Hong, 2023, Thalamocortical functional connectivity in youth with attention-deficit/hyperactivity disorder, J. Psychiatry Neurosci., 48, E50, 10.1503/jpn.220109 · DOI
- Wood, 2021, Sensory over-responsivity is related to GABAergic inhibition in thalamocortical circuits, Transl. Psychiatry, 11, 39, 10.1038/s41398-020-01154-0 · DOI
- Wells, 2016, Thalamic reticular impairment underlies attention deficit in Ptchd1(Y/-) mice, Nature, 532, 58, 10.1038/nature17427 · DOI · Paper page
- Jones, 2020, Reduced Activation in the Pallidal-Thalamic-Motor Pathway Is Associated With Deficits in Reward-Modulated Inhibitory Control in Adults With a History of Attention-Deficit/Hyperactivity Disorder, Biol. Psychiatry Cogn. Neurosci. Neuroimaging, 5, 1123
- Chaste, 2007, Mutation screening of the ARX gene in patients with autism, Am. J. Med. Genet. B Neuropsychiatr. Genet., 144B, 228, 10.1002/ajmg.b.30440 · DOI
- Lim, 2024, ARX regulates cortical interneuron differentiation and migration, bioRxiv
- Staudt, 2007, The prethalamus is established during gastrulation and influences diencephalic regionalization, PLoS Biol., 5, 10.1371/journal.pbio.0050069 · DOI
- Sunnen, 2014, Arx is required for specification of the zona incerta and reticular nucleus of the thalamus, J. Neuropathol. Exp. Neurol., 73, 253, 10.1097/NEN.0000000000000048 · DOI
- Jang, 2025, Reticular Thalamic Hyperexcitability Drives Autism Spectrum Disorder Behaviors in the Cntnap2 Model of Autism, bioRxiv
- Pan, 2008, ISL1 and BRN3B co-regulate the differentiation of murine retinal ganglion cells, Development, 135, 1981, 10.1242/dev.010751 · DOI · Paper page
- Humphreys, 2010, Fate tracing reveals the pericyte and not epithelial origin of myofibroblasts in kidney fibrosis, Am. J. Pathol., 176, 85, 10.2353/ajpath.2010.090517 · DOI · Paper page
- Kwan, 2002, Conditional inactivation of Lim1 function, Genesis, 32, 118, 10.1002/gene.10074 · DOI
- Balderes, 2013, Nkx2.2:Cre knock-in mouse line: a novel tool for pancreas- and CNS-specific gene deletion, Genesis, 51, 844, 10.1002/dvg.22715 · DOI
- Hoang, 2023, Ptbp1 deletion does not induce astrocyte-to-neuron conversion, Nature, 618, E1, 10.1038/s41586-023-06066-9 · DOI · Paper page
- Korsunsky, 2019, Fast, sensitive and accurate integration of single-cell data with Harmony, Nat. Methods, 16, 1289, 10.1038/s41592-019-0619-0 · DOI · Paper page
- Wolf, 2018, SCANPY: large-scale single-cell gene expression data analysis, Genome Biol., 19, 15, 10.1186/s13059-017-1382-0 · DOI · Paper page
- Dervinis, 2024, A novel method for reliably measuring miniature and spontaneous postsynaptic potentials/currents in whole-cell patch clamp recordings in the central nervous system, bioRxiv
Cited by
Pallais, J. P., Razzoli, M., Rodriguez, P., McGonigle, S., Daugherty, A., Hillman, H., Verteramo, L., Schrank, P. R., Parthiban, P., Chang, X., et al. (2026) · doi:10.64898/2026.04.18.719397 · Cited by 1
Metadata
- Authors
- Kim, D. W., Duncan, L. H., Xu, Z., Chang, M., Sejer, S., Terrillion, C. E., Kanold, P. O., Place, E., & Blackshaw, S.
- Venue
- Cell Reports
- Publisher
- Elsevier BV
- Published
- 2025-06
- Volume
- 44
- Issue
- 6
- Pages
- 115858
- ISSN
- 2211-1247
- PMC
- PMC12302022
- Cited by
- 25
- References
- 21
- Language
- en
- Licence
- www.elsevier.com/tdm/userlicense/1.0/ (tdm)
- www.elsevier.com/legal/tdmrep-license (tdm)
- creativecommons.org/licenses/by-nc-nd/4.0/ (vor)
- Funders
- National Institute of Mental Health (R01MH126676)
- National Institute of Neurological Disorders and Stroke (F99-NS135816)
- National Institute on Deafness and Other Communication Disorders (R361-2020-2654, RO1DC009607)
- Novo Nordisk Fonden (NNF24OC0089408, R63-A1583-B890)
- Biotechnology and Biological Sciences Research Council (BBSRC2020 Alert B/V019368/1)
- Maryland Advanced Research Computing Center
- National Institutes of Health
- Parkinson Association
- National Institute of Diabetes and Digestive and Kidney Diseases (F31DK132944)
- Johns Hopkins University
- Aarhus Universitet
- Lundbeck Foundation
About these checks
Registry, retraction, Cites and statistics results are computed, not judged, with one exception: a printed reference that no index lists is read once by a model before it counts as a citation error. Claims are extracted by a model and kept only when their quote appears verbatim in the text; each cited source is then checked, with a model’s help, for whether it says what the claim relies on. Those verdicts can be wrong — read the claim’s quote and the cited source before relying on one.
Statistics and arithmetic are recomputed, not judged.
Confidence bands are shown only for fields calibrated on our annotated test set. None is calibrated yet, so no band is shown.
What counts as a claim ›How we measure confidence ›How we check this ›
Are you an author, or do you see a problem with this page? Request a review
How to cite
Cite CoChat for the checks on this page, and the paper for its own findings.
- This page
- CoChat. (2026). Citation check: Decoding gene networks controlling hypothalamic and prethalamic neuron development. https://app.cochat.ai/papers/10.1016/j.celrep.2025.115858
- The paper
- Kim, D. W., Duncan, L. H., Xu, Z., Chang, M., Sejer, S., Terrillion, C. E., Kanold, P. O., Place, E., & Blackshaw, S. (2025). Decoding gene networks controlling hypothalamic and prethalamic neuron development. Cell Reports. https://doi.org/10.1016/j.celrep.2025.115858
Data sources
Bibliographic data: Semantic Scholar, OpenAlex, Crossref.
Contains information from the Semantic Scholar Academic Graph Datasets, made available under the ODC Attribution License (ODC-BY 1.0).
Semantic Scholar’s data is described in: Kinney, R., et al. (2023). The Semantic Scholar Open Data Platform. arXiv:2301.10140.
