

The DOI matches its Crossref record; 56 of the 56 references it cites were found in a registry or an index.
A neural mechanism of speed-accuracy tradeoff in macaque area LIP
Open accessAbstract
Decision making often involves a tradeoff between speed and accuracy. Previous studies indicate that neural activity in the lateral intraparietal area (LIP) represents the gradual accumulation of evidence toward a threshold level, or evidence bound, which terminates the decision process. The level of this bound is hypothesized to mediate the speed-accuracy tradeoff. To test this, we recorded from LIP while monkeys performed a motion discrimination task in two speed-accuracy regimes. Surprisingly, the terminating threshold levels of neural activity were similar in both regimes. However, neurons recorded in the faster regime exhibited stronger evidence-independent activation from the beginning of decision formation, effectively reducing the evidence-dependent neural modulation needed for choice commitment. Our results suggest that control of speed vs accuracy may be exerted through changes in decision-related neural activity itself rather than through changes in the threshold applied to such neural activity to terminate a decision.
Overview
The claims and statistics of this paper haven’t been checked yet.
Run the check — free, no account needed. It reads the open-access text and checks the sources it cites.
Integrity signals
Registry
Cites
Statistics
Figures
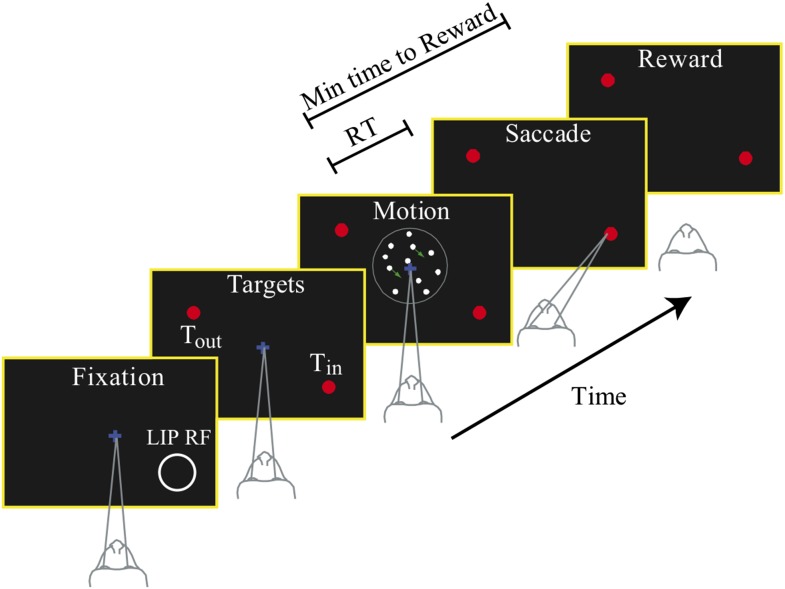
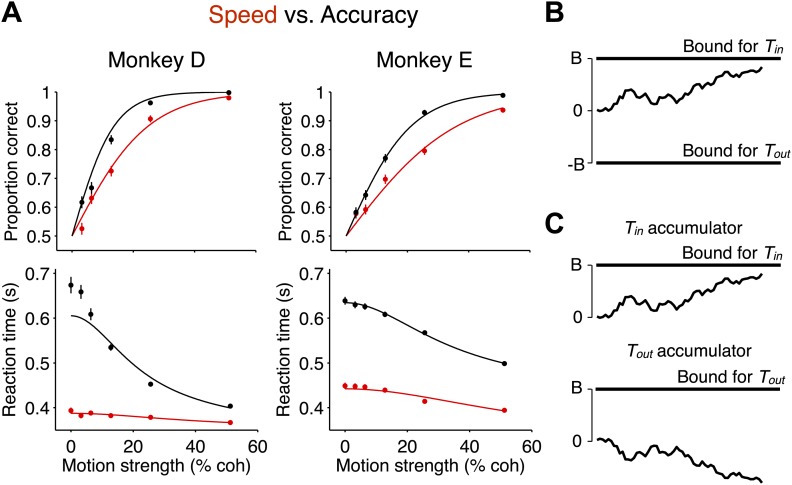
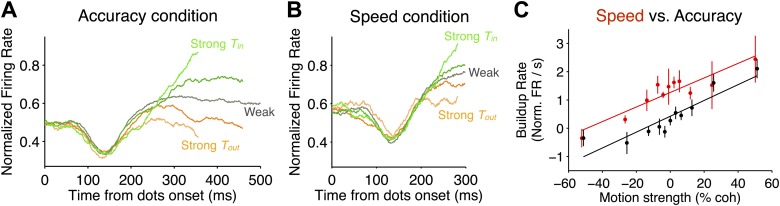
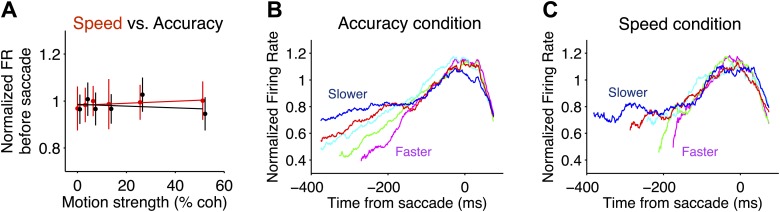
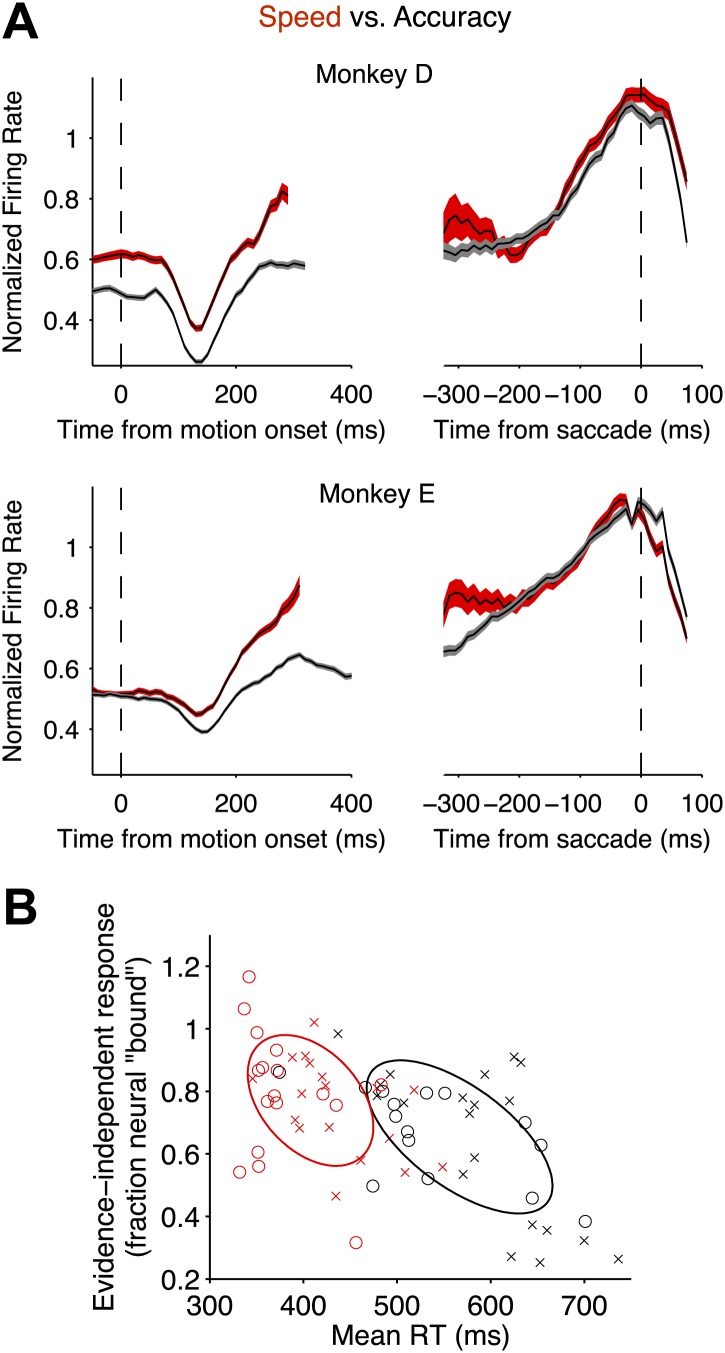
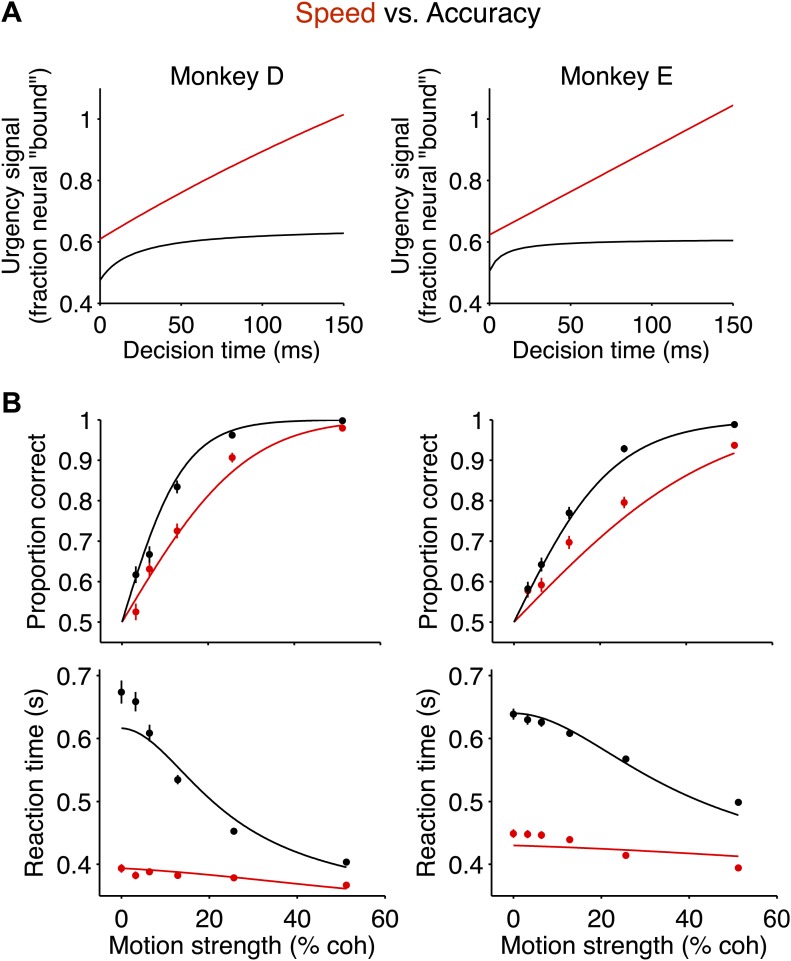
Verification
Claims the paper makes
The claims and statistics of this paper haven’t been checked yet.
Run the check — free, no account needed. It reads the open-access text and checks the sources it cites.
Claims other papers make about this one
Each is checked against this paper’s own text: does it say what the citing paper says it does?
The source backs part of the claim, not all of it — or backs it for a different population, condition or comparison.
In the citing paper
“the factors that determine when to stop gathering information and commit to a final decision, as well as which options to sample from, remain an active area of investigation1,4,9–11.”
From Interpretable abstractions of artificial neural networks predict behavior and neural activity during human information gathering (2026) · cites this paper as [9]
Experimental — accuracy not yet measured
Self-check
Percentages, sums and reported differences re-computed from the paper’s own numbers.
The self-check needs the paper’s full text.
Citations
Cites
Brainard, D. H. (1997) · Spatial Vision · doi:10.1163/156856897x00357 · Cited by 20,012
(1966) · Medical Entomology and Zoology · Cited by 10,293
Signal detection theory and psychophysics
Ingleby, D. (1967) · Journal of Sound and Vibration · doi:10.1016/0022-460x(67)90197-6 · Cited by 8,616
Ratcliff, R. (1978) · Psychological Review · doi:10.1037/0033-295x.85.2.59 · Cited by 4,513
The Neural Basis of Decision Making
Gold, J. I., & Shadlen, M. N. (2007) · Annual Review of Neuroscience · doi:10.1146/annurev.neuro.29.051605.113038 · Cited by 3,764
Self-citationThe time course of perceptual choice: The leaky, competing accumulator model.
Usher, M., & McClelland, J. L. (2001) · Psychological Review · doi:10.1037/0033-295x.108.3.550 · Cited by 2,152
(1986) · Cited by 2,022
Neural Basis of a Perceptual Decision in the Parietal Cortex (Area LIP) of the Rhesus Monkey
Shadlen, M. N., & Newsome, W. T. (2001) · Journal of Neurophysiology · doi:10.1152/jn.2001.86.4.1916 · Cited by 1,755
Self-citationNeural correlates of decision variables in parietal cortex
Platt, M. L., & Glimcher, P. W. (1999) · Nature · doi:10.1038/22268 · Cited by 1,721
Roitman, J. D., & Shadlen, M. N. (2002) · The Journal of Neuroscience · doi:10.1523/jneurosci.22-21-09475.2002 · Cited by 1,589 · cited 5×
“…of both evidence accumulation and a decision bound that leads to commitment for saccadic decisions (Shadlen and Newsome, 2001; Roitman and Shadlen, 2002; Hanks et al., 2006; Yang and Shadlen, 2007; Churchland et al., 2008; Kiani and Shadlen, 2009; Rorie et al., 2010; Churchland et al.,…”
BackgroundMethodResultInfluentialSelf-citation
Research works printed but not linked: 2
- Green, 1973, Speed-accuracy trade off in auditory detection
- Lewis, 2000, Mapping of architectonic subdivisions in the macaque monkey, with emphasis on parieto-occipital cortex, The Journal of Comparative Neurology, 428, 79, 10.1002/1096-9861(20001204)428:13.0.CO;2-Q · DOI
Cited by
Sorted by citations
Neuronal Reward and Decision Signals: From Theories to Data
Schultz, W. (2015) · Physiological Reviews · doi:10.1152/physrev.00023.2014 · Cited by 1,126
Sequential Sampling Models in Cognitive Neuroscience: Advantages, Applications, and Extensions
Forstmann, B. U., Ratcliff, R., & Wagenmakers, E. (2015) · Annual Review of Psychology · doi:10.1146/annurev-psych-122414-033645 · Cited by 665
Flexible timing by temporal scaling of cortical responses
Wang, J., Narain, D., Hosseini, E. A., & Jazayeri, M. (2017) · Nature Neuroscience · doi:10.1038/s41593-017-0028-6 · Cited by 425
Perceptual Decision Making in Rodents, Monkeys, and Humans
Hanks, T. D., & Summerfield, C. (2017) · Neuron · doi:10.1016/j.neuron.2016.12.003 · Cited by 409
Self-citationFrontosubthalamic Circuits for Control of Action and Cognition
Aron, A. R., Herz, D. M., Brown, P., Forstmann, B. U., & Zaghloul, K. A. (2016) · Journal of Neuroscience · doi:10.1523/jneurosci.2348-16.2016 · Cited by 299
Revisiting the Evidence for Collapsing Boundaries and Urgency Signals in Perceptual Decision-Making
Hawkins, G. E., Forstmann, B. U., Wagenmakers, E., Ratcliff, R., & Brown, S. D. (2015) · Journal of Neuroscience · doi:10.1523/jneurosci.2410-14.2015 · Cited by 298
A common mechanism underlies changes of mind about decisions and confidence
van den Berg, R., Anandalingam, K., Zylberberg, A., Kiani, R., Shadlen, M. N., & Wolpert, D. M. (2016) · eLife · doi:10.7554/elife.12192 · Cited by 270
Self-citationChoice history biases subsequent evidence accumulation
Urai, A. E., de Gee, J. W., Tsetsos, K., & Donner, T. H. (2019) · eLife · doi:10.7554/elife.46331 · Cited by 237
Bridging Neural and Computational Viewpoints on Perceptual Decision-Making
O’Connell, R. G., Shadlen, M. N., Wong‐Lin, K., & Kelly, S. P. (2018) · Trends in Neurosciences · doi:10.1016/j.tins.2018.06.005 · Cited by 217
Self-citationGlobal gain modulation generates time-dependent urgency during perceptual choice in humans
Murphy, P. R., Boonstra, E., & Nieuwenhuis, S. (2016) · Nature Communications · doi:10.1038/ncomms13526 · Cited by 206
Neural Mechanisms of Post-error Adjustments of Decision Policy in Parietal Cortex
Purcell, B. A., & Kiani, R. (2016) · Neuron · doi:10.1016/j.neuron.2015.12.027 · Cited by 152
Self-citationThura, D., & Cisek, P. (2016) · Journal of Neuroscience · doi:10.1523/jneurosci.2230-15.2016 · Cited by 148
Decisions are expedited through multiple neural adjustments spanning the sensorimotor hierarchy
Steinemann, N. A., O’Connell, R. G., & Kelly, S. P. (2018) · Nature Communications · doi:10.1038/s41467-018-06117-0 · Cited by 166
A Neural Implementation of Wald’s Sequential Probability Ratio Test
Kira, S., Yang, T., & Shadlen, M. N. (2015) · Neuron · doi:10.1016/j.neuron.2015.01.007 · Cited by 146
Self-citationSlow Drift of Neural Activity as a Signature of Impulsivity in Macaque Visual and Prefrontal Cortex
Cowley, B. R., Snyder, A. C., Acar, K., Williamson, R. C., Yu, B. M., & Smith, M. A. (2020) · Neuron · doi:10.1016/j.neuron.2020.07.021 · Cited by 137
Neurocomputational mechanisms of prior-informed perceptual decision-making in humans
Kelly, S. P., Corbett, E. A., & O’Connell, R. G. (2020) · Nature Human Behaviour · doi:10.1038/s41562-020-00967-9 · Cited by 152
Kelly, S. P., & O’Connell, R. G. (2014) · Journal of Physiology-Paris · doi:10.1016/j.jphysparis.2014.08.003 · Cited by 142
Confidence Is the Bridge between Multi-stage Decisions
van den Berg, R., Zylberberg, A., Kiani, R., Shadlen, M. N., & Wolpert, D. M. (2016) · Current Biology · doi:10.1016/j.cub.2016.10.021 · Cited by 125
Self-citationDecoding and perturbing decision states in real time
Peixoto, D., Verhein, J. R., Kiani, R., Kao, J. C., Nuyujukian, P., Chandrasekaran, C., Brown, J., Fong, S., Ryu, S. I., Shenoy, K. V., et al. (2021) · Nature · doi:10.1038/s41586-020-03181-9 · Cited by 123
Self-citationNeurophysiology of Human Perceptual Decision-Making
O’Connell, R. G., & Kelly, S. P. (2021) · Annual Review of Neuroscience · doi:10.1146/annurev-neuro-092019-100200 · Cited by 130
Representational geometry of perceptual decisions in the monkey parietal cortex
Okazawa, G., Hatch, C. E., Mancoo, A., Machens, C. K., & Kiani, R. (2021) · Cell · doi:10.1016/j.cell.2021.05.022 · Cited by 115
Self-citationThura, D., Cos, I., Trung, J., & Cisek, P. (2014) · Journal of Neuroscience · doi:10.1523/jneurosci.0162-14.2014 · Cited by 113
A Dynamical Systems Perspective on Flexible Motor Timing
Remington, E. D., Egger, S. W., Narain, D., Wang, J., & Jazayeri, M. (2018) · Trends in Cognitive Sciences · doi:10.1016/j.tics.2018.07.010 · Cited by 101
Purcell, B. A., & Kiani, R. (2016) · Proceedings of the National Academy of Sciences · doi:10.1073/pnas.1524685113 · Cited by 106
Self-citationDistinct mechanisms mediate speed-accuracy adjustments in cortico-subthalamic networks
Herz, D. M., Tan, H., Brittain, J., Fischer, P., Cheeran, B., Green, A. L., FitzGerald, J. J., Aziz, T. Z., Ashkan, K., Little, S. J., et al. (2017) · eLife · doi:10.7554/elife.21481 · Cited by 102
Herz, D. M., Little, S. J., Pedrosa, D. J., Tinkhauser, G., Cheeran, B., Foltynie, T., Bogacz, R., & Brown, P. (2018) · Current Biology · doi:10.1016/j.cub.2018.02.057 · Cited by 96
Confidence predicts speed-accuracy tradeoff for subsequent decisions
Desender, K., Boldt, A., Verguts, T., & Donner, T. H. (2019) · eLife · doi:10.7554/elife.43499 · Cited by 107
Comparing fixed and collapsing boundary versions of the diffusion model
Voskuilen, C., Ratcliff, R., & Smith, P. L. (2016) · Journal of Mathematical Psychology · doi:10.1016/j.jmp.2016.04.008 · Cited by 104
Piercing of Consciousness as a Threshold-Crossing Operation
Kang, Y. H., Petzschner, F. H., Wolpert, D. M., & Shadlen, M. N. (2017) · Current Biology · doi:10.1016/j.cub.2017.06.047 · Cited by 90
Self-citationSelective Optogenetic Control of Purkinje Cells in Monkey Cerebellum
El-Shamayleh, Y., Kojima, Y., Soetedjo, R., & Horwitz, G. D. (2017) · Neuron · doi:10.1016/j.neuron.2017.06.002 · Cited by 86
A neural mechanism for terminating decisions
Stine, G. M., Trautmann, E. M., Jeurissen, D., & Shadlen, M. N. (2023) · Neuron · doi:10.1016/j.neuron.2023.05.028 · Cited by 83
Self-citationPsychophysical reverse correlation reflects both sensory and decision-making processes
Okazawa, G., Sha, L., Purcell, B. A., & Kiani, R. (2018) · Nature Communications · doi:10.1038/s41467-018-05797-y · Cited by 84
Self-citationUnderstanding neural signals of post-decisional performance monitoring: An integrative review
Desender, K., Ridderinkhof, K. R., & Murphy, P. R. (2021) · eLife · doi:10.7554/elife.67556 · Cited by 77
Tuning the speed-accuracy trade-off to maximize reward rate in multisensory decision-making
Drugowitsch, J., DeAngelis, G. C., Angelaki, D. E., & Pouget, A. (2015) · eLife · doi:10.7554/elife.06678 · Cited by 79
Competing basal ganglia pathways determine the difference between stopping and deciding not to go
Dunovan, K., Lynch, B., Molesworth, T., & Verstynen, T. (2015) · eLife · doi:10.7554/elife.08723 · Cited by 76
The Role of the Lateral Intraparietal Area in (the Study of) Decision Making
Huk, A. C., Katz, L. N., & Yates, J. L. (2017) · Annual Review of Neuroscience · doi:10.1146/annurev-neuro-072116-031508 · Cited by 76
Neural Mechanisms That Make Perceptual Decisions Flexible
Okazawa, G., & Kiani, R. (2022) · Annual Review of Physiology · doi:10.1146/annurev-physiol-031722-024731 · Cited by 83
Self-citationMack, M. L., & Preston, A. R. (2015) · NeuroImage · doi:10.1016/j.neuroimage.2015.12.015 · Cited by 86
Accumulators, Neurons, and Response Time
Schall, J. D. (2019) · Trends in Neurosciences · doi:10.1016/j.tins.2019.10.001 · Cited by 75
Beyond decision! Motor contribution to speed–accuracy trade-off in decision-making
Spieser, L., Servant, M., Hasbroucq, T., & Burle, B. (2016) · Psychonomic Bulletin & Review · doi:10.3758/s13423-016-1172-9 · Cited by 66
Roles of the Cerebellum in Motor Preparation and Prediction of Timing
Tanaka, M., Kunimatsu, J., Suzuki, T. W., Kameda, M., Ohmae, S., Uematsu, A., & Takeya, R. (2020) · Neuroscience · doi:10.1016/j.neuroscience.2020.04.039 · Cited by 75
Computational validity: using computation to translate behaviours across species
Redish, A. D., Kepecs, Á., Anderson, L. M., Calvin, O. L., Grissom, N. M., Haynos, A. F., Heilbronner, S. R., Herman, A. B., Jacob, S., Ma, S., et al. (2021) · Philosophical Transactions of the Royal Society B Biological Sciences · doi:10.1098/rstb.2020.0525 · Cited by 63
Lee, T. L., Lee, H., & Kang, N. (2023) · npj Science of Learning · doi:10.1038/s41539-022-00152-9 · Cited by 61
Dully, J., McGovern, D. P., & O’Connell, R. G. (2018) · Behavioural Brain Research · doi:10.1016/j.bbr.2018.02.001 · Cited by 62
McGovern, D. P., Hayes, A., Kelly, S. P., & O’Connell, R. G. (2018) · Nature Human Behaviour · doi:10.1038/s41562-018-0465-6 · Cited by 54
Pathways to the persistence of drug use despite its adverse consequences
McNally, G. P., Jean-Richard-dit-Bressel, P., Millan, E. Z., & Lawrence, A. J. (2023) · Molecular Psychiatry · doi:10.1038/s41380-023-02040-z · Cited by 58
Engineering recurrent neural networks from task-relevant manifolds and dynamics
Pollock, E., & Jazayeri, M. (2020) · PLoS Computational Biology · doi:10.1371/journal.pcbi.1008128 · Cited by 44
Relating accumulator model parameters and neural dynamics
Purcell, B. A., & Palmeri, T. J. (2016) · Journal of Mathematical Psychology · doi:10.1016/j.jmp.2016.07.001 · Cited by 42
Action history influences subsequent movement via two distinct processes
Marinovic, W., Poh, E., de Rugy, A., & Carroll, T. J. (2017) · eLife · doi:10.7554/elife.26713 · Cited by 44
Reppert, T. R., Servant, M., Heitz, R. P., & Schall, J. D. (2018) · Journal of Neurophysiology · doi:10.1152/jn.00887.2017 · Cited by 49
Shushruth, S., Mazurek, M. E., & Shadlen, M. N. (2018) · Journal of Neuroscience · doi:10.1523/jneurosci.0668-18.2018 · Cited by 45
Self-citationDevine, C. A., Gaffney, C., Loughnane, G. M., Kelly, S. P., & O’Connell, R. G. (2019) · eLife · doi:10.7554/elife.48526 · Cited by 46
Evidence against perfect integration of sensory information during perceptual decision making
Carland, M. A., Marcos, E., Thura, D., & Cisek, P. (2015) · Journal of Neurophysiology · doi:10.1152/jn.00264.2015 · Cited by 45
Designing and Interpreting Psychophysical Investigations of Cognition
Waskom, M., Okazawa, G., & Kiani, R. (2019) · Neuron · doi:10.1016/j.neuron.2019.09.016 · Cited by 49
Self-citationBrosnan, M. B., Sabaroedin, K., Silk, T. J., Genc, S., Newman, D. P., Loughnane, G. M., Fornito, A., O’Connell, R. G., & Bellgrove, M. A. (2020) · Nature Human Behaviour · doi:10.1038/s41562-020-0863-4 · Cited by 42
Evidence and Urgency Related EEG Signals during Dynamic Decision-Making in Humans
Yau, Y. H. C., Hinault, T., Taylor, M., Cisek, P., Fellows, L. K., & Dagher, A. (2021) · Journal of Neuroscience · doi:10.1523/jneurosci.2551-20.2021 · Cited by 37
Inhibition of return: An information processing theory of its natures and significance
Redden, R. S., MacInnes, W. J., & Klein, R. M. (2020) · Cortex · doi:10.1016/j.cortex.2020.11.009 · Cited by 37
Striatal activation reflects urgency in perceptual decision making
van Maanen, L., Fontanesi, L., Hawkins, G. E., & Forstmann, B. U. (2016) · NeuroImage · doi:10.1016/j.neuroimage.2016.06.045 · Cited by 36
Confidence is predicted by pre- and post-choice decision signal dynamics
Grogan, J. P., Rys, W., Kelly, S. P., & O’Connell, R. G. (2023) · Imaging Neuroscience · doi:10.1162/imag_a_00005 · Cited by 40
Human stereoEEG recordings reveal network dynamics of decision-making in a rule-switching task
Wal, M. T., Platonov, A., Cardellicchio, P., Pelliccia, V., Russo, G. L., Sartori, I., Avanzini, P., Orban, G. A., & Tiesinga, P. H. E. (2020) · Nature Communications · doi:10.1038/s41467-020-16854-w · Cited by 36
Verdonck, S., Loossens, T., & Philiastides, M. G. (2020) · Psychological Review · doi:10.1037/rev0000258 · Cited by 38
Of monkeys and men: Impatience in perceptual decision-making
Boehm, U., Hawkins, G. E., Brown, S. D., van Rijn, H., & Wagenmakers, E. (2015) · Psychonomic Bulletin & Review · doi:10.3758/s13423-015-0958-5 · Cited by 35
van Maanen, L., Katsimpokis, D., & van Campen, A. D. (2018) · Behavior Research Methods · doi:10.3758/s13428-018-1110-z · Cited by 34
Dual Coding Theory Explains Biphasic Collective Computation in Neural Decision-Making
Daniels, B. C., Flack, J. C., & Krakauer, D. C. (2017) · Frontiers in Neuroscience · doi:10.3389/fnins.2017.00313 · Cited by 36
Implications of Lateral Cerebellum in Proactive Control of Saccades
Kunimatsu, J., Suzuki, T. W., & Tanaka, M. (2016) · Journal of Neuroscience · doi:10.1523/jneurosci.0733-16.2016 · Cited by 32
Gherman, S., Markowitz, N., Tostaeva, G., Espinal, E., Mehta, A. D., O’Connell, R. G., Kelly, S. P., & Bickel, S. (2024) · Nature Human Behaviour · doi:10.1038/s41562-024-01824-9 · Cited by 34
Strategic and Dynamic Temporal Weighting for Perceptual Decisions in Humans and Macaques
Levi, A. J., Yates, J. L., Huk, A. C., & Katz, L. N. (2018) · eNeuro · doi:10.1523/eneuro.0169-18.2018 · Cited by 34
Speed-accuracy tradeoff by a control signal with balanced excitation and inhibition
Lo, C., Wang, C.-T., & Wang, X. (2015) · Journal of Neurophysiology · doi:10.1152/jn.00845.2013 · Cited by 39
How honey bees make fast and accurate decisions
MaBouDi, H., Marshall, J. A. R., Dearden, N., & Barron, A. B. (2023) · eLife · doi:10.7554/elife.86176 · Cited by 35
Magnetoencephalography decoding reveals structural differences within integrative decision processes
Eldar, E., Bae, G. J., Kurth-Nelson, Z. L., Dayan, P., & Dolan, R. J. (2018) · Nature Human Behaviour · doi:10.1038/s41562-018-0423-3 · Cited by 30
Optimal models of decision-making in dynamic environments
Kilpatrick, Z. P., Holmes, W. R., Eissa, T. L., & Josić́, K. (2019) · Current Opinion in Neurobiology · doi:10.1016/j.conb.2019.06.006 · Cited by 32
Ghaderi-Kangavari, A., Rad, J. A., & Nunez, M. D. (2023) · Computational Brain & Behavior · doi:10.1007/s42113-023-00167-4 · Cited by 39
Choice History Biases Subsequent Evidence AccumulationPreprint
Urai, A. E., de Gee, J. W., Tsetsos, K., & Donner, T. H. (2018) · bioRxiv (Cold Spring Harbor Laboratory) · doi:10.1101/251595 · Cited by 32
Dynamics of individual perceptual decisions
Merfeld, D. M., Clark, T. K., Lu, Y. M., & Karmali, F. (2015) · Journal of Neurophysiology · doi:10.1152/jn.00225.2015 · Cited by 27
Hasty sensorimotor decisions rely on an overlap of broad and selective changes in motor activity
Derosière, G., Thura, D., Cisek, P., & Duqué, J. (2022) · PLoS Biology · doi:10.1371/journal.pbio.3001598 · Cited by 22
Using Decision Models to Enhance Investigations of Individual Differences in Cognitive Neuroscience
White, C. N., Curl, R. A., & Sloane, J. (2016) · Frontiers in Psychology · doi:10.3389/fpsyg.2016.00081 · Cited by 26
The neural network RTNet exhibits the signatures of human perceptual decision-making
Rafiei, F., Shekhar, M., & Rahnev, D. (2024) · Nature Human Behaviour · doi:10.1038/s41562-024-01914-8 · Cited by 37
Boucher, P. O., Wang, T., Carceroni, L., Kane, G. A., Shenoy, K. V., & Chandrasekaran, C. (2023) · Nature Communications · doi:10.1038/s41467-023-41752-2 · Cited by 30
Dendauw, E., Evans, N. J., Logan, G. D., Haffen, É., Bennabi, D., Gajdos, T., & Servant, M. (2024) · Psychological Review · doi:10.1037/rev0000464 · Cited by 31
Categorical evidence, confidence, and urgency during probabilistic categorization
Braunlich, K., & Seger, C. A. (2015) · NeuroImage · doi:10.1016/j.neuroimage.2015.11.011 · Cited by 24
Spatial attention during saccade decisions
Jonikaitis, D., Klapetek, A., & Deubel, H. (2017) · Journal of Neurophysiology · doi:10.1152/jn.00665.2016 · Cited by 29
The importance of decision onset
Teichert, T., Grinband, J., & Ferrera, V. P. (2015) · Journal of Neurophysiology · doi:10.1152/jn.00274.2015 · Cited by 25
Servant, M., Tillman, G., Schall, J. D., Logan, G. D., & Palmeri, T. J. (2019) · Journal of Neurophysiology · doi:10.1152/jn.00507.2018 · Cited by 25
Confidence through consensus: a neural mechanism for uncertainty monitoring
Paz, L., Insabato, A., Zylberberg, A., Deco, G., & Sigman, M. (2016) · Scientific Reports · doi:10.1038/srep21830 · Cited by 26
Colas, J. T. (2017) · PLoS ONE · doi:10.1371/journal.pone.0186822 · Cited by 21
Removal of inhibition uncovers latent movement potential during preparation
Jagadisan, U. K., & Gandhi, N. J. (2017) · eLife · doi:10.7554/elife.29648 · Cited by 21
Multiphasic value biases in fast-paced decisions
Corbett, E. A., Martinez-Rodriguez, L. A., Judd, C., O’Connell, R. G., & Kelly, S. P. (2023) · eLife · doi:10.7554/elife.67711 · Cited by 24
Zhang, Z., Cheng, H., & Yang, T. (2020) · PLoS Computational Biology · doi:10.1371/journal.pcbi.1008342 · Cited by 23
Proactive and reactive accumulation-to-bound processes compete during perceptual decisions
Hernández-Navarro, L., Hermoso-Mendizabal, A., Duque, D., de la Rocha, J., & Hyafil, A. (2021) · Nature Communications · doi:10.1038/s41467-021-27302-8 · Cited by 21
Trial-to-trial adjustments of speed-accuracy trade-offs in premotor and primary motor cortex.
Thura, D., Guberman, G. I., & Cisek, P. (2017) · Journal of Neurophysiology · doi:10.1152/jn.00726.2016 · Cited by 17
Sensory and decision-making processes underlying perceptual adaptation
Witthoft, N., Sha, L., Winawer, J. A., & Kiani, R. (2018) · Journal of Vision · doi:10.1167/18.8.10 · Cited by 22
Self-citationConfluence of Timing and Reward Biases in Perceptual Decision-Making Dynamics
Shinn, M., Ehrlich, D. B., Lee, D., Murray, J. D., & Seo, H. (2020) · Journal of Neuroscience · doi:10.1523/jneurosci.0544-20.2020 · Cited by 19
Boehm, U., Cox, S., Gantner, G., & Stevenson, R. P. (2021) · Journal of Mathematical Psychology · doi:10.1016/j.jmp.2021.102613 · Cited by 19
Geuzebroek, A. C., Craddock, H., O’Connell, R. G., & Kelly, S. P. (2023) · eLife · doi:10.7554/elife.83025 · Cited by 22
Flexibility of Timescales of Evidence Evaluation for Decision Making
Ganupuru, P., Goldring, A. B., Harun, R., & Hanks, T. D. (2019) · Current Biology · doi:10.1016/j.cub.2019.05.037 · Cited by 22
Self-citationStandage, D., Wang, D., & Blohm, G. (2014) · Frontiers in Neuroscience · doi:10.3389/fnins.2014.00318 · Cited by 17
Kohl, C., Spieser, L., Förster, B., Bestmann, S., & Yarrow, K. (2020) · Cognitive Psychology · doi:10.1016/j.cogpsych.2020.101321 · Cited by 21
Linear Integration of Sensory Evidence over Space and Time Underlies Face Categorization
Okazawa, G., Sha, L., & Kiani, R. (2021) · Journal of Neuroscience · doi:10.1523/jneurosci.3055-20.2021 · Cited by 16
Self-citationTomassini, A., Pollak, T. A., Edwards, M. J., & Bestmann, S. (2019) · Neuropsychologia · doi:10.1016/j.neuropsychologia.2019.02.003 · Cited by 16
Trading accuracy for speed over the course of a decision
Derosière, G., Thura, D., Cisek, P., & Duqué, J. (2021) · Journal of Neurophysiology · doi:10.1152/jn.00038.2021 · Cited by 16
Metadata
- Authors
- Hanks, T., Kiani, R., & Shadlen, M. N.
- Affiliations
- Princeton University (US)
- New York University (US)
- Howard Hughes Medical Institute (US)
- Corresponding author
- Hanks, Timothy
- Shadlen, Michael N
- Venue
- eLife
- Publisher
- eLife Sciences Publications, Ltd
- Published
- 2014-05-27
- Volume
- 3
- ISSN
- 2050-084X (ISSN-L)
- PMC
- PMC4054775
- OpenAlex
- W2170716773
- Cited by
- 222
- References
- 56
- Citations by year
- 2026: 13 · 2025: 19 · 2024: 13 · 2023: 22 · 2022: 14 · 2021: 20 · 2020: 21 · 2019: 19 · 2018: 26 · 2017: 14 · 2016: 23 · 2015: 15 · 2014: 3
- FWCI
- 10.23
- Type
- journal article
- Language
- en
- Open access
- gold
- doi.org
- Licence
- Locations
- eLife (publishedVersion, cc-by)
- Europe PMC (PubMed Central) (publishedVersion, cc-by)
- PubMed Central (publishedVersion, cc-by)
- PubMed (publishedVersion)
- DOAJ (DOAJ: Directory of Open Access Journals) (submittedVersion, cc-by-sa)
- eScholarship (California Digital Library) (submittedVersion, cc-by)
- Funders
- Howard Hughes Medical Institute
- National Eye Institute (EY11378)
- Human Frontier Science Program (RGP0067/2011)
- Topics
- Life Sciences › Neuroscience › Cognitive Neuroscience › Visual perception and processing mechanisms
- Life Sciences › Neuroscience › Cognitive Neuroscience › Neural and Behavioral Psychology Studies
- Life Sciences › Neuroscience › Cognitive Neuroscience › Neural dynamics and brain function
- Keywords
- speed-accuracy trade-off, lateral intraparietal area, decision-making, evidence accumulation, decision threshold, motion discrimination, macaque
- MeSH terms
- Animals, Bayes Theorem, Behavior, Animal, Choice Behavior, Decision Making, Macaca, Models, Neurological, Motion Perception, Neurons, Neurophysiology, Photic Stimulation, Reaction Time, Time Factors, Reproducibility of Results
About these checks
Registry, retraction, Cites and statistics results are computed, not judged, with one exception: a printed reference that no index lists is read once by a model before it counts as a citation error. Claims are extracted by a model and kept only when their quote appears verbatim in the text; each cited source is then checked, with a model’s help, for whether it says what the claim relies on. Those verdicts can be wrong — read the claim’s quote and the cited source before relying on one.
Statistics and arithmetic are recomputed, not judged.
Confidence bands are shown only for fields calibrated on our annotated test set. None is calibrated yet, so no band is shown.
What counts as a claim ›How we measure confidence ›How we check this ›
Are you an author, or do you see a problem with this page? Request a review
