

The DOI matches its Crossref record; 45 of the 45 references it cites were found in a registry or an index.
Corelease of acetylcholine and GABA from cholinergic forebrain neurons
Open accessAbstract
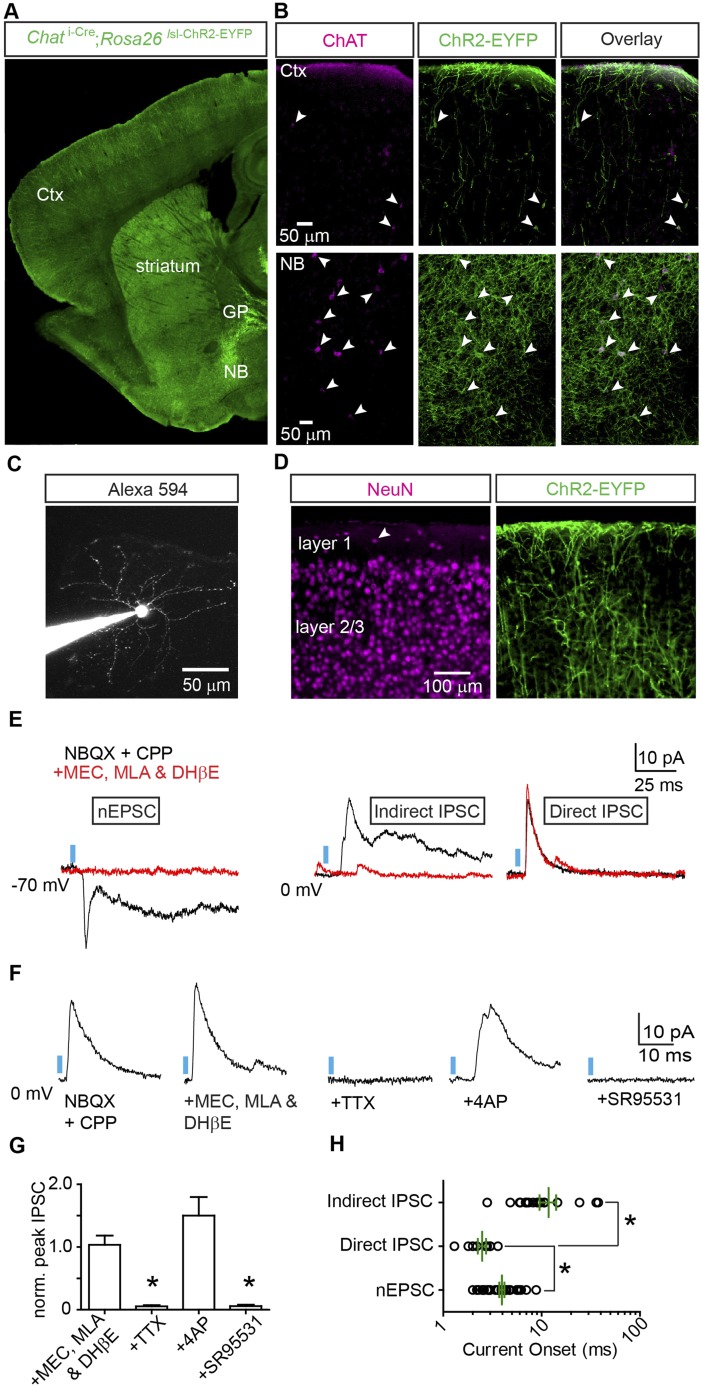
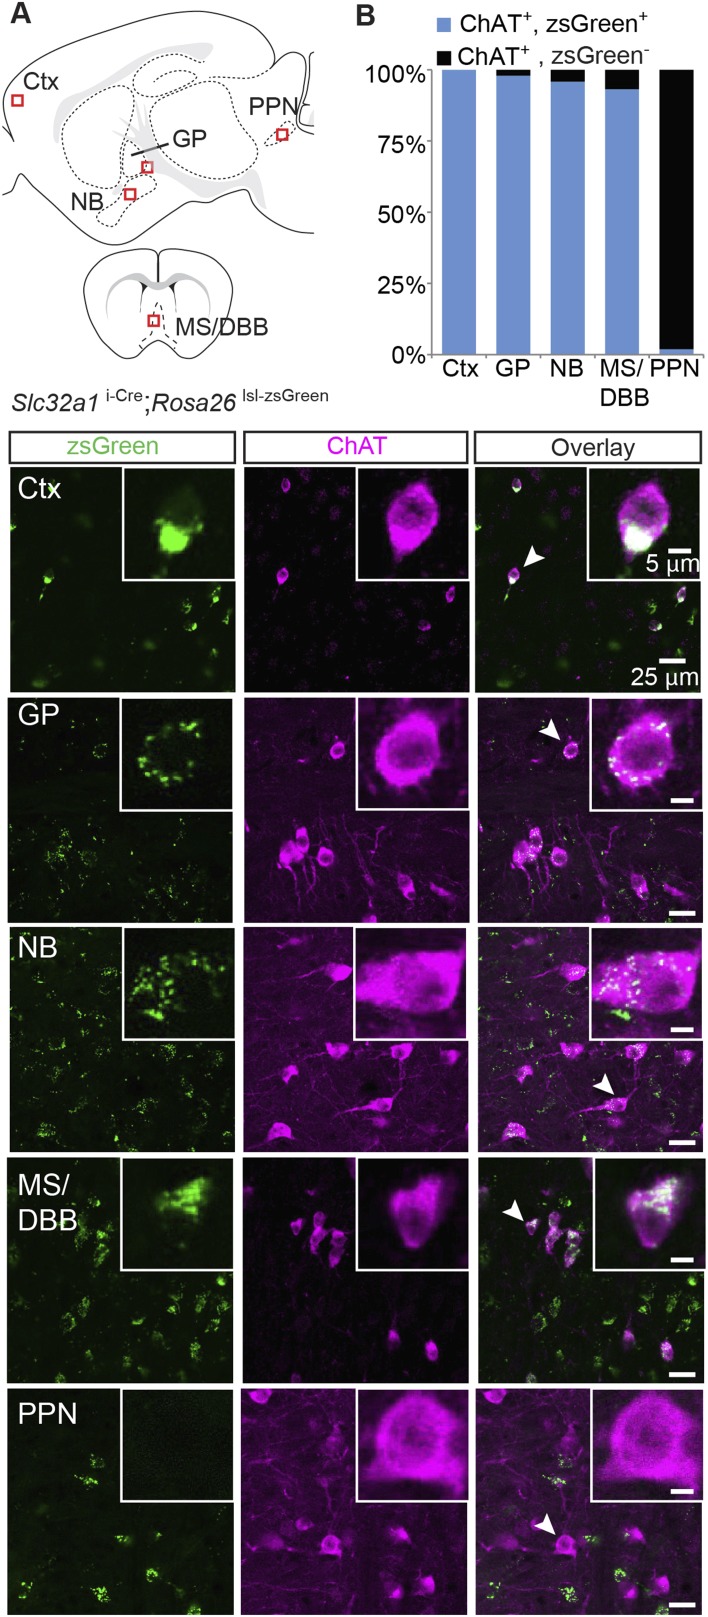
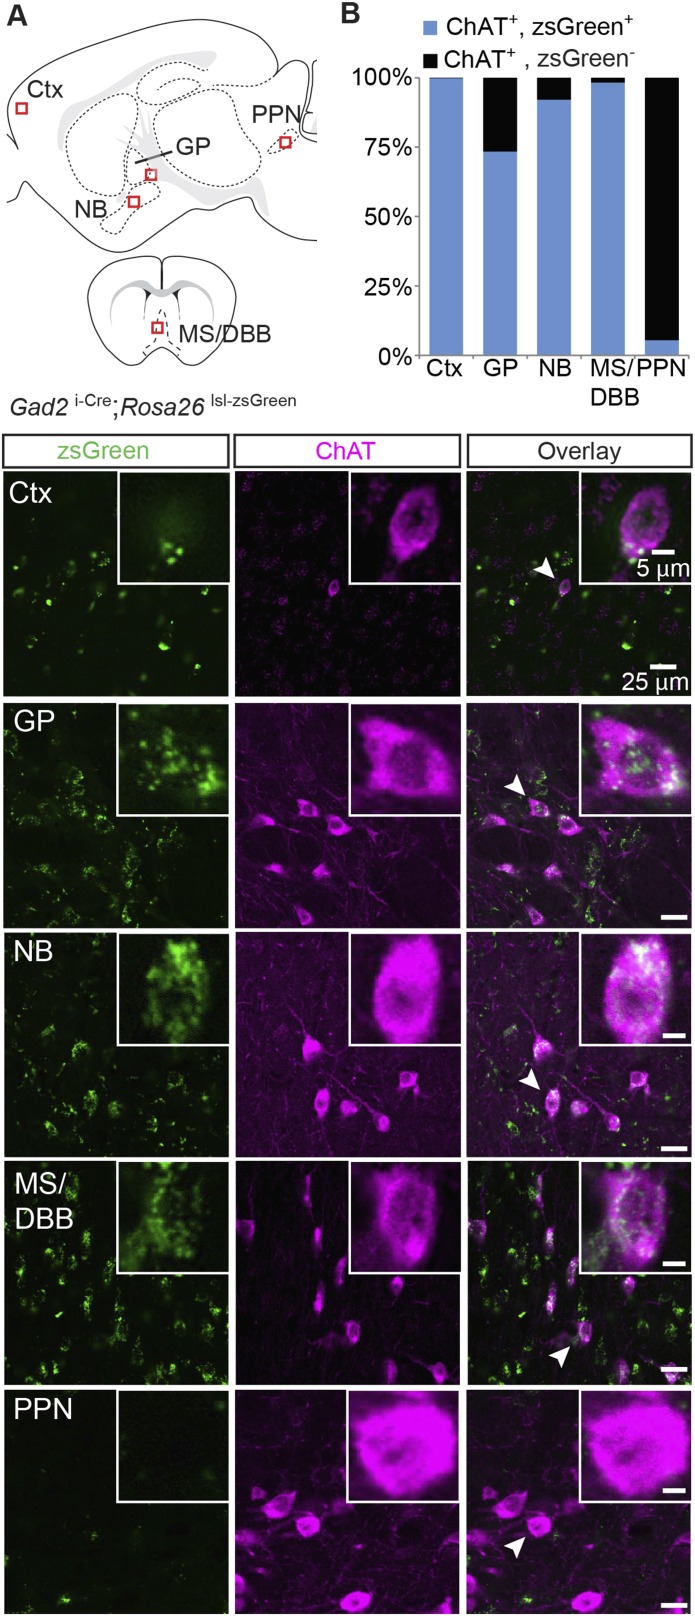
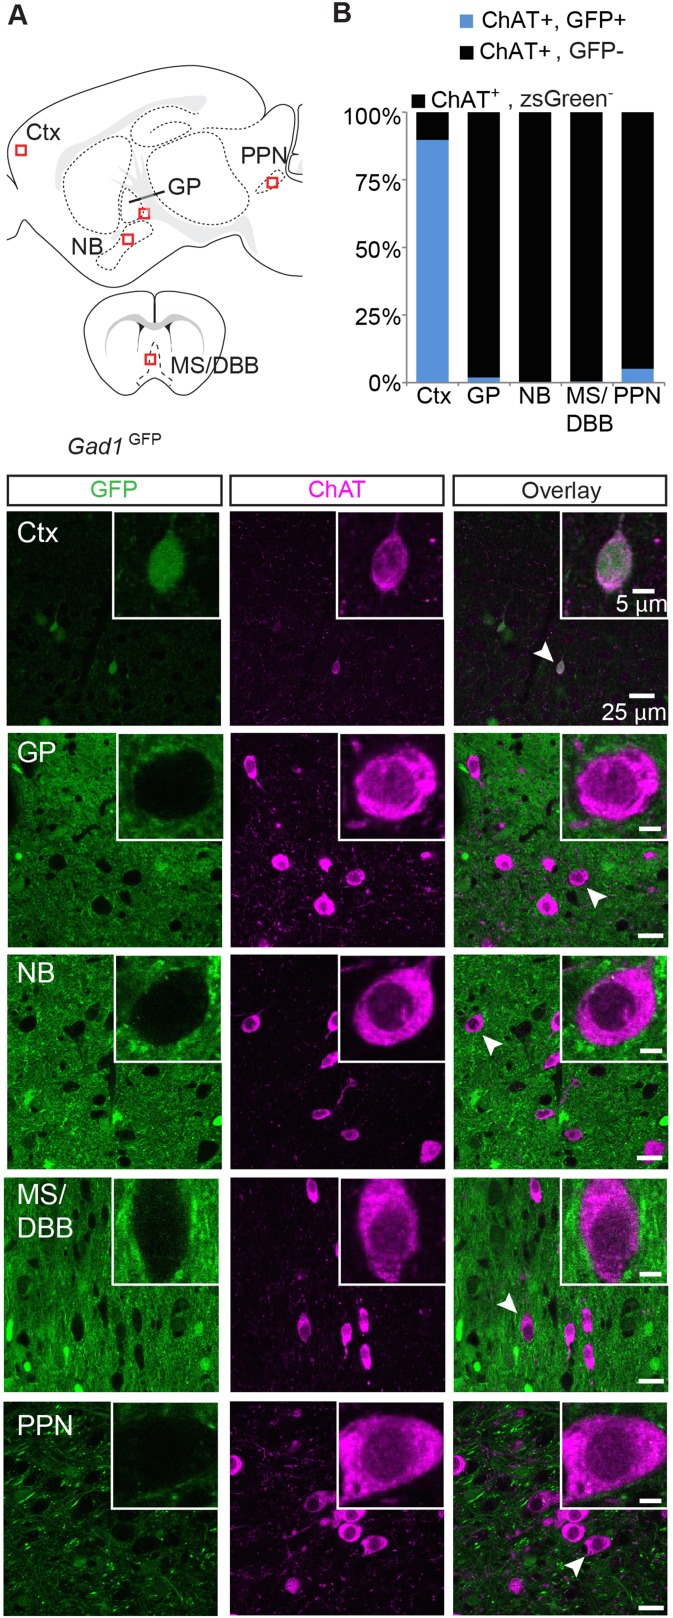
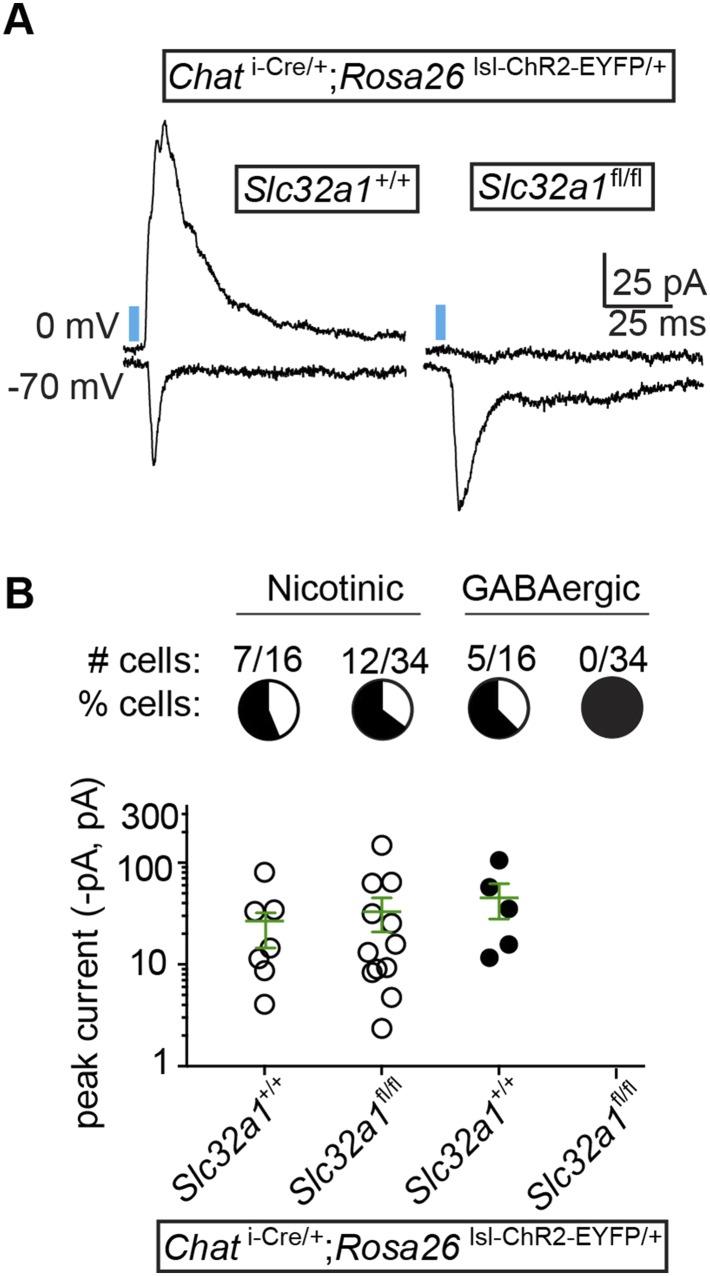
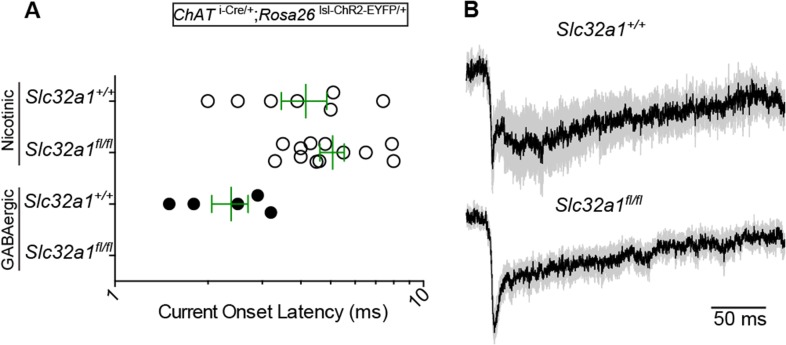
Neurotransmitter corelease is emerging as a common theme of central neuromodulatory systems. Though corelease of glutamate or GABA with acetylcholine has been reported within the cholinergic system, the full extent is unknown. To explore synaptic signaling of cholinergic forebrain neurons, we activated choline acetyltransferase expressing neurons using channelrhodopsin while recording post-synaptic currents (PSCs) in layer 1 interneurons. Surprisingly, we observed PSCs mediated by GABAA receptors in addition to nicotinic acetylcholine receptors. Based on PSC latency and pharmacological sensitivity, our results suggest monosynaptic release of both GABA and ACh. Anatomical analysis showed that forebrain cholinergic neurons express the GABA synthetic enzyme Gad2 and the vesicular GABA transporter (Slc32a1). We confirmed the direct release of GABA by knocking out Slc32a1 from cholinergic neurons. Our results identify GABA as an overlooked fast neurotransmitter utilized throughout the forebrain cholinergic system. GABA/ACh corelease may have major implications for modulation of cortical function by cholinergic neurons.
Overview
The claims and statistics of this paper haven’t been checked yet.
Run the check — free, no account needed. It reads the open-access text and checks the sources it cites.
Integrity signals
Registry
Cites
Statistics
Figures
Verification
Claims the paper makes
The claims and statistics of this paper haven’t been checked yet.
Run the check — free, no account needed. It reads the open-access text and checks the sources it cites.
Claims other papers make about this one
Each is checked against this paper’s own text: does it say what the citing paper says it does?
In the citing paper
“The proportion of postsynaptic layer 1 interneurons receiving an EPSC or an IPSC differed significantly, and most received only one type of input.”
From Synaptic and circuit functions of multitransmitter neurons in the mammalian brain (2023) · cites this paper as [89]
In the citing paper
“Optogenetic activation of cortically projecting Ach/GABA-releasing neurons evoked monosynaptic GABAmediated inhibitory currents and Ach-mediated nicotinic excitatory currents in layer 1 interneurons.”
From Synaptic and circuit functions of multitransmitter neurons in the mammalian brain (2023) · cites this paper as [89]
In the citing paper
“The GABA-mediated IPSC could be ablated by selective genetic deletion of Slc32a1 (vGAT) in Chat-Cre+ neurons, while the nicotinic excitatory postsynaptic current (EPSC) persisted, indicating that the loading of Ach did not depend on GABA vesicular transport.89”
From Synaptic and circuit functions of multitransmitter neurons in the mammalian brain (2023) · cites this paper as [89]
Self-check
Percentages, sums and reported differences re-computed from the paper’s own numbers.
The self-check needs the paper’s full text.
Citations
Cites
A resource of Cre driver lines for genetic targeting of GABAergic neurons in cerebral cortex
Taniguchi, H., He, M., Wu, P., Kim, S., Paik, R., Sugino, K., Kvitsani, D., Fu, Y., Lu, J., Lin, Y., et al. (2011) · Neuron · doi:10.1016/j.neuron.2011.07.026 · Cited by 1,828
Acetylcholine as a Neuromodulator: Cholinergic Signaling Shapes Nervous System Function and Behavior
Picciotto, M. R., Higley, M. J., & Mineur, Y. S. (2012) · Neuron · doi:10.1016/j.neuron.2012.08.036 · Cited by 1,404
Tamamaki, N., Yanagawa, Y., Tomioka, R., Miyazaki, J., Obata, K., & Kaneko, T. (2003) · The Journal of Comparative Neurology · doi:10.1002/cne.10905 · Cited by 1,277
Cortical Map Reorganization Enabled by Nucleus Basalis Activity
Kilgard, M. P., & Merzenich, M. M. (1998) · Science · doi:10.1126/science.279.5357.1714 · Cited by 1,197
A Cortical Circuit for Gain Control by Behavioral State
Fu, Y., Tucciarone, J. M., Espinosa, J. S., Sheng, N., Darcy, D. P., Nicoll, R. A., Huang, Z. J., & Stryker, M. P. (2014) · Cell · doi:10.1016/j.cell.2014.01.050 · Cited by 937 · cited 2×
“ACh release from basal forebrain neurons excites layer 1 and VIP+ interneurons, which in turn inhibit local interneurons that target principle neurons of the cortex (Letzkus et al., 2011; Pinto et al., 2013; Fu et al., 2014).”
BackgroundA disinhibitory microcircuit for associative fear learning in the auditory cortex
Letzkus, J. J., Wolff, S. B. E., Meyer, E. M. M., Tovote, P., Courtin, J., Herry, C., & Lüthi, A. (2011) · Nature · doi:10.1038/nature10674 · Cited by 840 · cited 2×
“ACh release from basal forebrain neurons excites layer 1 and VIP+ interneurons, which in turn inhibit local interneurons that target principle neurons of the cortex (Letzkus et al., 2011; Pinto et al., 2013; Fu et al., 2014).”
BackgroundCorelease of Two Fast Neurotransmitters at a Central Synapse
Jonas, P., Bischofberger, J., & Sandkühler, J. (1998) · Science · doi:10.1126/science.281.5375.419 · Cited by 784
Synaptic release of GABA by AgRP neurons is required for normal regulation of energy balance
Tong, Q., Ye, C.-P., Jones, J. E., Elmquist, J. K., & Lowell, B. B. (2008) · Nature Neuroscience · doi:10.1038/nn.2167 · Cited by 699
Rossi, J., Balthasar, N., Olson, D., Scott, M., Berglund, E., Lee, C. E., Choi, M. J., Lauzon, D., Lowell, B. B., & Elmquist, J. K. (2011) · Cell Metabolism · doi:10.1016/j.cmet.2011.01.010 · Cited by 672
Two isoforms of glutamate decarboxylase: why?
Soghomonian, J., & Martin, D. L. (1998) · Trends in Pharmacological Sciences · doi:10.1016/s0165-6147(98)01270-x · Cited by 643
Research works printed but not linked: 1
- Mechawar, 2000, Cholinergic innervation in adult rat cerebral cortex: a quantitative immunocytochemical description, The Journal of Comparative Neurology, 428, 305, 10.1002/1096-9861(20001211)428:23.0.CO;2-Y · DOI
Cited by
Sorted by citations
Cholinergic modulation of the hippocampal region and memory function
Haam, J., & Yakel, J. L. (2017) · Journal of Neurochemistry · doi:10.1111/jnc.14052 · Cited by 468
The ventral pallidum: Subregion-specific functional anatomy and roles in motivated behaviors
Root, D. H., Meléndez, R. I., Záborszky, L., & Napier, T. C. (2015) · Progress in Neurobiology · doi:10.1016/j.pneurobio.2015.03.005 · Cited by 359
Mechanisms and functions of GABA co-release
Tritsch, N. X., Granger, A. J., & Sabatini, B. L. (2016) · Nature reviews. Neuroscience · doi:10.1038/nrn.2015.21 · Cited by 276
Self-citationJiang, L., Kundu, S., Lederman, J., López‐Hernández, G. Y., Ballinger, E. C., Wang, S., Talmage, D. A., & Role, L. W. (2016) · Neuron · doi:10.1016/j.neuron.2016.04.028 · Cited by 186
Cortical cholinergic signaling controls the detection of cues
Gritton, H. J., Howe, W. M., Mallory, C. S., Hetrick, V. L., Berke, J. D., & Sarter, M. F. (2016) · Proceedings of the National Academy of Sciences · doi:10.1073/pnas.1516134113 · Cited by 191
Metadata
- Authors
- Saunders, A., Granger, A. J., & Sabatini, B. L.
- Affiliations
- Howard Hughes Medical Institute (US)
- Corresponding author
- Sabatini, Bernardo L
- Venue
- eLife
- Publisher
- eLife Sciences Publications, Ltd
- Published
- 2015-02-27
- Volume
- 4
- ISSN
- 2050-084X (ISSN-L)
- PMC
- PMC4371381
- OpenAlex
- W2142530108
- Cited by
- 200
- References
- 45
- Citations by year
- 2026: 5 · 2025: 17 · 2024: 12 · 2023: 18 · 2022: 21 · 2021: 19 · 2020: 20 · 2019: 24 · 2018: 24 · 2017: 18 · 2016: 19 · 2015: 3
- FWCI
- 9.95
- Type
- journal article
- Language
- en
- Open access
- gold
- doi.org
- Licence
- Locations
- eLife (publishedVersion, cc-by)
- PubMed Central (publishedVersion, cc-by)
- PubMed (publishedVersion)
- Digital Access to Scholarship at Harvard (DASH) (Harvard University) (submittedVersion, cc-by)
- DOAJ (DOAJ: Directory of Open Access Journals) (submittedVersion, cc-by-sa)
- Funders
- National Institute of Neurological Disorders and Stroke (NINDS) (#NS072030)
- Topics
- Life Sciences › Neuroscience › Cellular and Molecular Neuroscience › Neuroscience and Neuropharmacology Research
- Life Sciences › Biochemistry, Genetics and Molecular Biology › Molecular Biology › Nicotinic Acetylcholine Receptors Study
- Life Sciences › Neuroscience › Cognitive Neuroscience › Neural dynamics and brain function
- Keywords
- acetylcholine, GABA, cholinergic neurons, forebrain, GABAA receptor, nicotinic acetylcholine receptors, choline acetyltransferase, channelrhodopsin, layer 1 interneurons, GAD-2, vesicular GABA transporter, synaptic signaling
- MeSH terms
- Acetylcholine, Animals, Choline O-Acetyltransferase, gamma-Aminobutyric Acid, Glutamate Decarboxylase, Membrane Potentials, Mice, Transgenic, Synaptic Transmission, Receptors, GABA-A, Receptors, Nicotinic, Tetrodotoxin, 4-Aminopyridine, Prosencephalon, Patch-Clamp Techniques, Microscopy, Confocal, Excitatory Postsynaptic Potentials, Potassium Channel Blockers, Sodium Channel Blockers, Microscopy, Fluorescence, Multiphoton, Vesicular Inhibitory Amino Acid Transport Proteins, Cholinergic Neurons
About these checks
Registry, retraction, Cites and statistics results are computed, not judged, with one exception: a printed reference that no index lists is read once by a model before it counts as a citation error. Claims are extracted by a model and kept only when their quote appears verbatim in the text; each cited source is then checked, with a model’s help, for whether it says what the claim relies on. Those verdicts can be wrong — read the claim’s quote and the cited source before relying on one.
Statistics and arithmetic are recomputed, not judged.
Confidence bands are shown only for fields calibrated on our annotated test set. None is calibrated yet, so no band is shown.
What counts as a claim ›How we measure confidence ›How we check this ›
Are you an author, or do you see a problem with this page? Request a review
