Cited by 2ATP Synthase and ATPases ResearchIon channel regulation and functionIon Transport and Channel Regulation

The DOI matches its Crossref record; 1 of the 1 references it cites were found in a registry or an index.

Conduction pathway for potassium through the Escherichia coli pump KdpFABC

Open access

Published version of a preprint

Abstract

Under osmotic stress, bacteria express a heterotetrameric protein complex, KdpFABC, which functions as an ATP-dependent K + pump to maintain intracellular potassium levels. The subunit KdpA belongs to the superfamily of K + transporters and adopts pseudo fourfold symmetry with a membrane-embedded selectivity filter as seen in K + channels. KdpB belongs to the superfamily of P-type ATPases with a conserved binding site for ions within the membrane domain and three cytoplasmic domains that orchestrate ATP hydrolysis via an aspartyl phosphate intermediate. Previous work hypothesized that K + moves parallel to the membrane plane through a 40 Å long tunnel that connects the selectivity filter of KdpA with a canonical binding site in KdpB. In the current work, we have reconstituted KdpFABC into lipid nanodiscs and used cryo-EM to image the wild-type pump under turnover conditions. We present a 2.1 Å structure of the E1~P·ADP conformation, which reveals new features of the conduction pathway. This map shows strong densities within the selectivity filter and at the canonical binding site, consistent with K + bound at each of these sites in this conformation. Many water molecules occupy a vestibule and the proximal end of the tunnel, which becomes markedly hydrophobic and dewetted at the subunit interface. We go on to use ATPase and ion transport assays to assess effects of numerous mutations along this proposed conduction pathway. The results confirm that K + ions pass through the tunnel and support the existence of a low-affinity site in KdpB for releasing these ions to the cytoplasm. Taken together, these data shed new light on the unique partnership between a transmembrane channel and an ATP-driven pump in maintaining the large electrochemical K + gradient essential for bacterial survival.

Overview

The claims and statistics of this paper haven’t been checked yet.

Run the check — free, no account needed. It reads the open-access text and checks the sources it cites.

A few free checks a day · papers already verified open instantly · results are public

Integrity signals

Registry

Crossref · 10.7554/elife.107397.4

Cites

1 of 1 references verified0 citation errors · 0 not checkable

Statistics

Figures

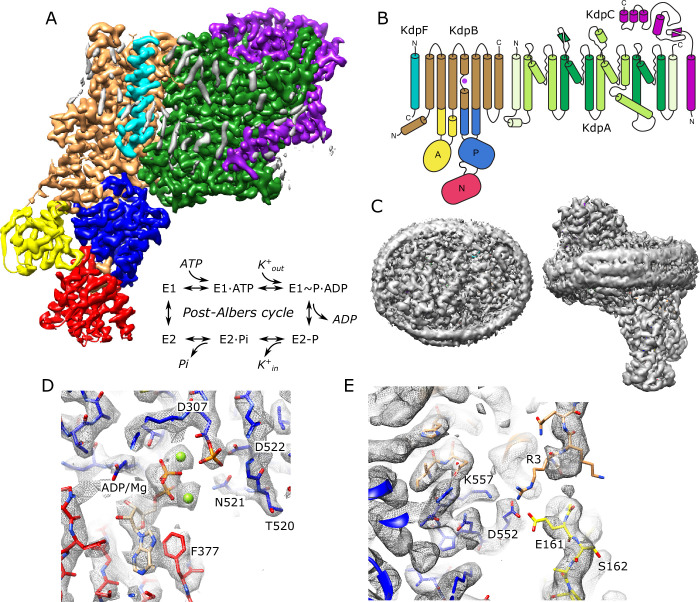
Figure 1. Cryo-EM structure of KdpFABC in nanodiscs. (A) Overview of the density map with subunits rendered in conventional colors corresponding to those in panel (B). The Post-Albers reaction scheme is shown in the inset. (B) Diagram illustrating the transmembrane topology of KdpFABC. (C) Rendering of the unsharpened map at a lower density threshold illustrates the presence of the membrane scaffolding protein surrounding the nanodisc. (D) Detail of the nucleotide binding site of KdpB showing ADP associated with two Mg2+ ions and the phosphorylated catalytic residue: Asp307. (E) Detail of the newly resolved N-terminus of KdpB revealing a potential interaction between Glu161, Arg3, Asp552, and Lys557. Panels (A), (C), and (E) show the unsharpened map at thresholds of 7, 3, and 4 σ, respectively; panel (D) shows the sharpened map at 3.9 σ.
Figure 1. Cryo-EM structure of KdpFABC in nanodiscs. (A) Overview of the density map with subunits rendered in conventional colors corresponding to those in panel (B). The Post-Albers reaction scheme is shown in the inset. (B) Diagram illustrating the transmembrane topology of KdpFABC. (C) Rendering of the unsharpened map at a lower density threshold illustrates the presence of the membrane scaffolding protein surrounding the nanodisc. (D) Detail of the nucleotide binding site of KdpB showing ADP associated with two Mg2+ ions and the phosphorylated catalytic residue: Asp307. (E) Detail of the newly resolved N-terminus of KdpB revealing a potential interaction between Glu161, Arg3, Asp552, and Lys557. Panels (A), (C), and (E) show the unsharpened map at thresholds of 7, 3, and 4 σ, respectively; panel (D) shows the sharpened map at 3.9 σ.CC BY · PubMed Central
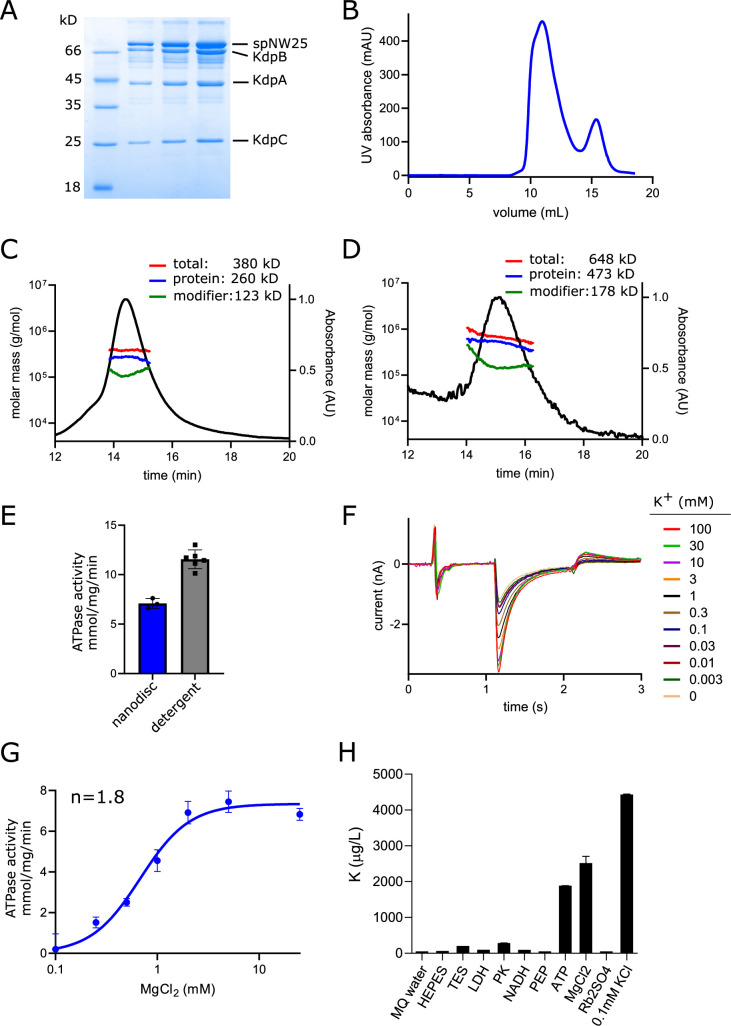
Figure 1—figure supplement 1. Biochemical preparation of KdpFABC. (A) Polyacrylamide gel of nanodisc sample used for cryo-EM showing the presence of KdpA, KdpB, KdpC, and the membrane scaffolding protein, spNW25. KdpF is not visible due to its small size (3 kD); typically, it stains poorly and runs very near the dye front of the gel. (B) Elution profile from size-exclusion column of the sample used for making cryo-EM grids; the main peak is composed of nanodiscs containing KdpFABC and the smaller peak contains empty nanodiscs. Slight asymmetry of the main peak is consistent with a subpopulation of nanodiscs containing two KdpFABC complexes (Figure 1—figure supplement 2). (C, D) Multi-angle light scattering analysis of the HPLC-SEC elution profile from nanodiscs reconstituted with POPC/DOPA lipids and E. coli polar lipids, respectively. This analysis indicates DOPC/DOPA lipids produce smaller nanodiscs containing ~1 KdpFABC molecule (C), whereas E. coli polar lipids produce larger, more heterogeneous nanodiscs (D). (E) ATPase activity is preserved after nanodisc reconstitution, though at a reduced rate attributable to the lipid environment. Data represents 3–6 technical replicates with SEM. (F) Transport current measured by solid supported membrane electrophysiology showing K+ dependence of WT KdpFABC. One trace for each K+ concentration is shown. (G) Mg2+ dependence of ATPase activity indicates a Hill coefficient (n) of ~1.8, which is consistent with the two Mg2+ ions associated with ADP in the structure. Data represents three technical replicates with SEM. (H) Inductively coupled plasma mass spectrometry analysis of stock solutions used for ATPase assay indicates substantial K+ contamination from ATP and MgCl2 solutions. Data from mass spectrometry represent the mean and std. dev. of triplicate measurements.
Figure 1—figure supplement 1. Biochemical preparation of KdpFABC. (A) Polyacrylamide gel of nanodisc sample used for cryo-EM showing the presence of KdpA, KdpB, KdpC, and the membrane scaffolding protein, spNW25. KdpF is not visible due to its small size (3 kD); typically, it stains poorly and runs very near the dye front of the gel. (B) Elution profile from size-exclusion column of the sample used for making cryo-EM grids; the main peak is composed of nanodiscs containing KdpFABC and the smaller peak contains empty nanodiscs. Slight asymmetry of the main peak is consistent with a subpopulation of nanodiscs containing two KdpFABC complexes (Figure 1—figure supplement 2). (C, D) Multi-angle light scattering analysis of the HPLC-SEC elution profile from nanodiscs reconstituted with POPC/DOPA lipids and E. coli polar lipids, respectively. This analysis indicates DOPC/DOPA lipids produce smaller nanodiscs containing ~1 KdpFABC molecule (C), whereas E. coli polar lipids produce larger, more heterogeneous nanodiscs (D). (E) ATPase activity is preserved after nanodisc reconstitution, though at a reduced rate attributable to the lipid environment. Data represents 3–6 technical replicates with SEM. (F) Transport current measured by solid supported membrane electrophysiology showing K+ dependence of WT KdpFABC. One trace for each K+ concentration is shown. (G) Mg2+ dependence of ATPase activity indicates a Hill coefficient (n) of ~1.8, which is consistent with the two Mg2+ ions associated with ADP in the structure. Data represents three technical replicates with SEM. (H) Inductively coupled plasma mass spectrometry analysis of stock solutions used for ATPase assay indicates substantial K+ contamination from ATP and MgCl2 solutions. Data from mass spectrometry represent the mean and std. dev. of triplicate measurements.CC BY · PubMed Central
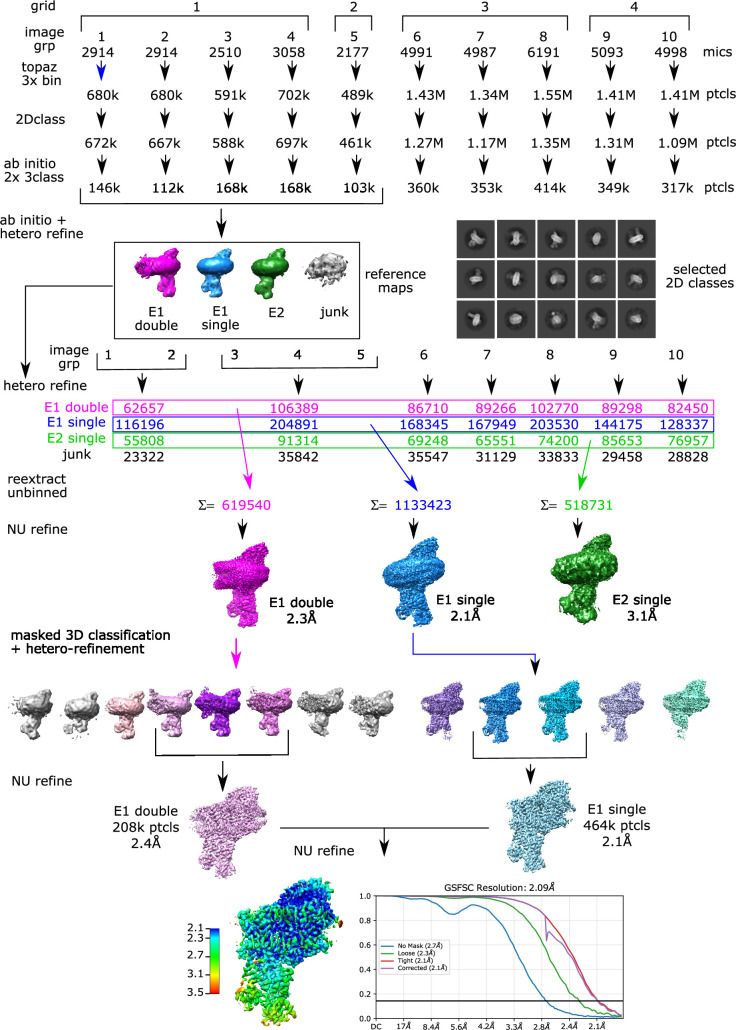
Figure 1—figure supplement 2. Cryo-EM processing pipeline. Four grids from a single sample were imaged to produce a total of ~50,000 micrographs. These were divided into ten groups of 2000–6000 micrographs for initial processing. After motion correction and determination of defocus parameters, particles were picked using TOPAZ and extracted with a box size of 335 Å and threefold binning. Multiple rounds of 2D classification (a few examples of 2D classes are shown) and ab initio reconstruction were used to remove false positive picks and empty nanodiscs. A subset of these particles was further classified to generate four main classes representing nanodiscs with a single copy of KdpFABC in either E1 or E2 conformations, nanodiscs with two copies of KdpFABC (double) which were mainly E1 conformation, and junk. These low-resolution structures were used as references for hetero-refinement of particles partitioned in seven groups. Particles conforming to each conformation were combined and used for masked 3D classification, where the mask encompassed the cytoplasmic domains of KdpB. Particles representing the E1~P·ADP conformation, which represented the largest class, were combined for a final non-uniform refinement job.
Figure 1—figure supplement 2. Cryo-EM processing pipeline. Four grids from a single sample were imaged to produce a total of ~50,000 micrographs. These were divided into ten groups of 2000–6000 micrographs for initial processing. After motion correction and determination of defocus parameters, particles were picked using TOPAZ and extracted with a box size of 335 Å and threefold binning. Multiple rounds of 2D classification (a few examples of 2D classes are shown) and ab initio reconstruction were used to remove false positive picks and empty nanodiscs. A subset of these particles was further classified to generate four main classes representing nanodiscs with a single copy of KdpFABC in either E1 or E2 conformations, nanodiscs with two copies of KdpFABC (double) which were mainly E1 conformation, and junk. These low-resolution structures were used as references for hetero-refinement of particles partitioned in seven groups. Particles conforming to each conformation were combined and used for masked 3D classification, where the mask encompassed the cytoplasmic domains of KdpB. Particles representing the E1~P·ADP conformation, which represented the largest class, were combined for a final non-uniform refinement job.CC BY · PubMed Central
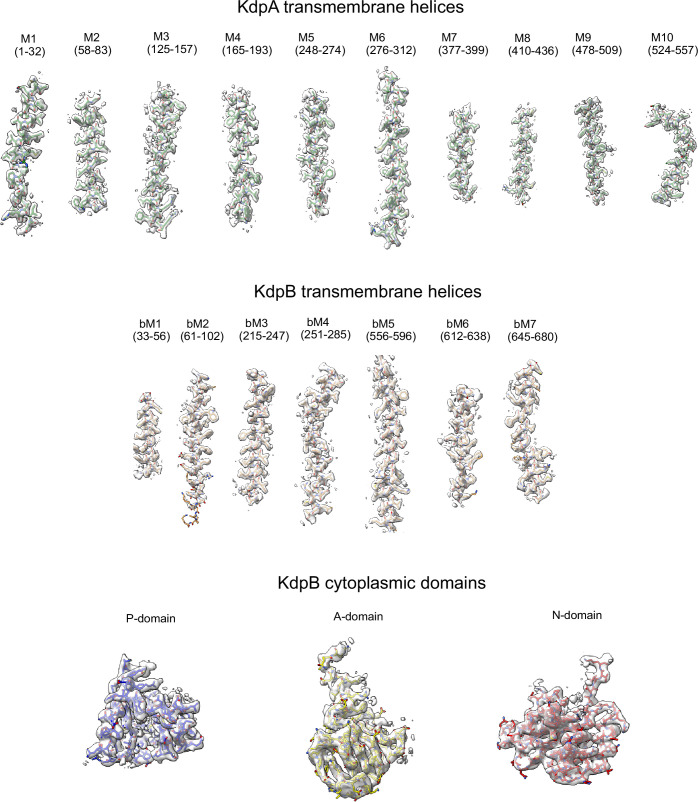
Figure 1—figure supplement 3. Cryo-EM densities. Correlation between map densities and model for individual transmembrane helices from KdpA as well as transmembrane helices and cytoplasmic domains of KdpB. The sharpened map was used for helices and the P-domain with a threshold of 5.7 σ, whereas the unsharpened map was used for the more flexible A- and N-domains at 2.5 σ.
Figure 1—figure supplement 3. Cryo-EM densities. Correlation between map densities and model for individual transmembrane helices from KdpA as well as transmembrane helices and cytoplasmic domains of KdpB. The sharpened map was used for helices and the P-domain with a threshold of 5.7 σ, whereas the unsharpened map was used for the more flexible A- and N-domains at 2.5 σ.CC BY · PubMed Central
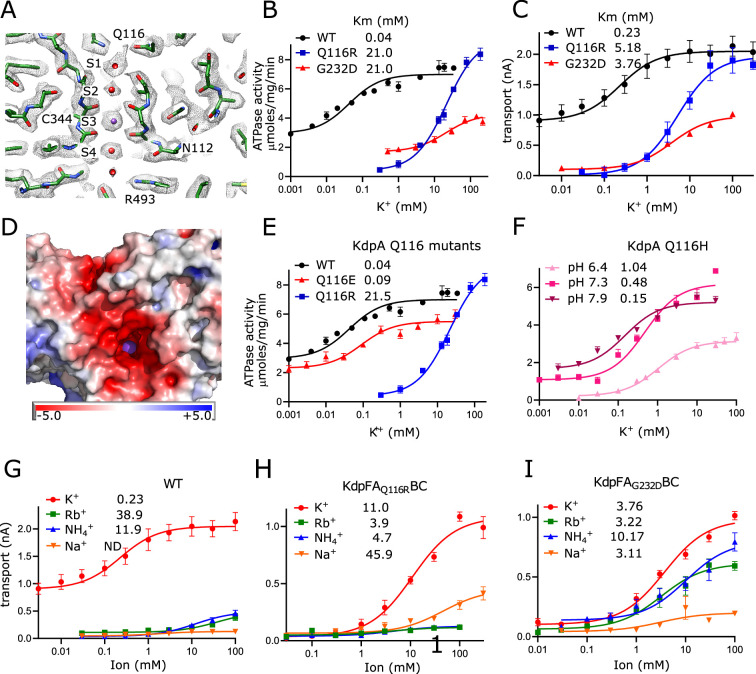
Figure 2. Selectivity filter of KdpA. (A) The map reveals densities at all sites (S1–S4) of the selectivity filter. Because the density at the S3 site is the highest in the entire map (Figure 2—figure supplement 1A), it has been assigned as a K+ ion (purple sphere). Gray mesh corresponds to the sharpened map at 6.5 σ. (B, C) ATPase and transport assays (respectively) illustrate that Q116R and G232D mutations lower the apparent affinity of the pump (Km values in mM shown in the legend). Background activity is consistently observed for the WT, which is likely due to K+ contamination in stock solutions (Figure 1—figure supplement 1H). The location of Gln116 is shown in panel (A), G232 is out of the plane in this image, but can be seen in Figure 2—figure supplement 1B. (D) Mapping of electrostatic charge indicates that the entrance to the selectivity filter of the WT pump is strongly negative, which would help attract positively charged ions. A K+ ion is visible in the selectivity filter as a purple sphere. (E, F) Substitution of Glu116 has differing effects that reflect changes in net charge at the entrance to the selectivity filter. (G–I) Transport assays with various monovalent cations show that the strong selectivity of the WT pump is compromised by the G232D mutation but not by the Q116R mutation. Table 2 shows measurements from transport assays that are broadly consistent with these ATPase data. Data are derived from 3–8 technical replicates as reflected in the source data and the error bars represent SEM. Raw data for the transport assays are shown in Figure 2—figure supplements 2–4.
Figure 2. Selectivity filter of KdpA. (A) The map reveals densities at all sites (S1–S4) of the selectivity filter. Because the density at the S3 site is the highest in the entire map (Figure 2—figure supplement 1A), it has been assigned as a K+ ion (purple sphere). Gray mesh corresponds to the sharpened map at 6.5 σ. (B, C) ATPase and transport assays (respectively) illustrate that Q116R and G232D mutations lower the apparent affinity of the pump (Km values in mM shown in the legend). Background activity is consistently observed for the WT, which is likely due to K+ contamination in stock solutions (Figure 1—figure supplement 1H). The location of Gln116 is shown in panel (A), G232 is out of the plane in this image, but can be seen in Figure 2—figure supplement 1B. (D) Mapping of electrostatic charge indicates that the entrance to the selectivity filter of the WT pump is strongly negative, which would help attract positively charged ions. A K+ ion is visible in the selectivity filter as a purple sphere. (E, F) Substitution of Glu116 has differing effects that reflect changes in net charge at the entrance to the selectivity filter. (G–I) Transport assays with various monovalent cations show that the strong selectivity of the WT pump is compromised by the G232D mutation but not by the Q116R mutation. Table 2 shows measurements from transport assays that are broadly consistent with these ATPase data. Data are derived from 3–8 technical replicates as reflected in the source data and the error bars represent SEM. Raw data for the transport assays are shown in Figure 2—figure supplements 2–4.CC BY · PubMed Central
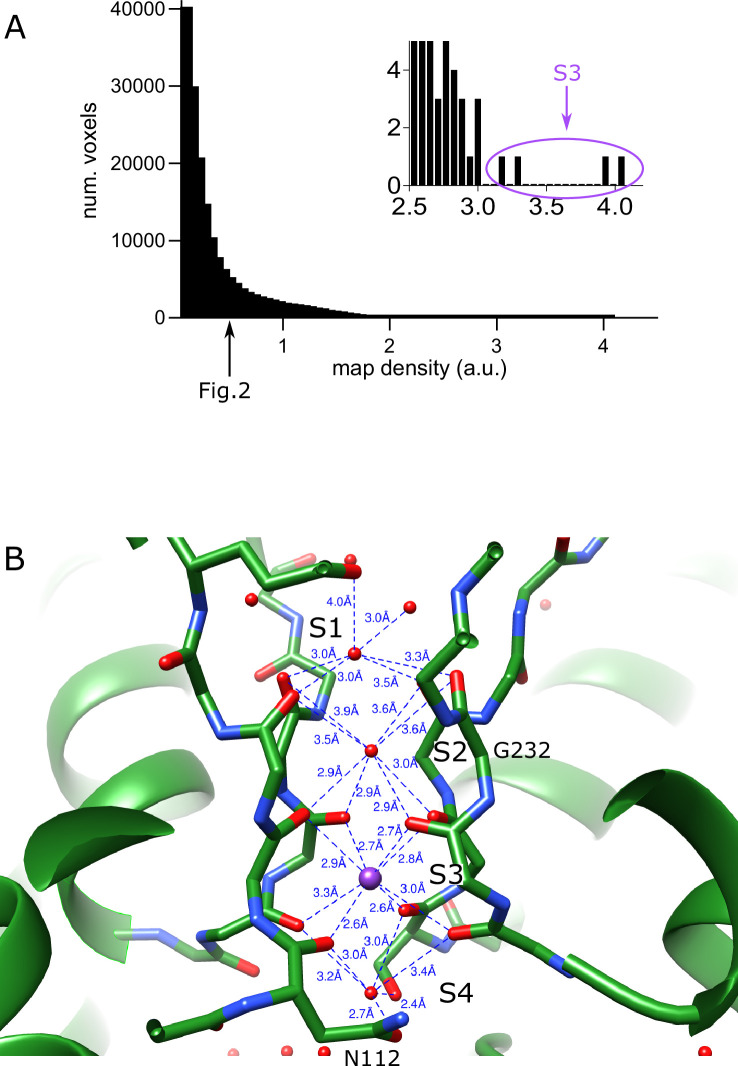
Figure 2—figure supplement 1. Selectivity filter of KdpA. (A) Distribution of raw densities for the entire sharpened map. The arrow indicates the threshold used for rendering the map in Figure 2 (0.5 which corresponds to 6.5 σ). The inset shows the extreme tail in the density distribution; the highest four densities (circled at >50 σ) correspond to the K+ ion modeled at the S3 site. (B) Coordination of densities in the selectivity filter in the refined model. The regular network of bonds at the S3 site suggests that this is the high-affinity binding site for K+, whereas less regular coordination at other sites is consistent with water.
Figure 2—figure supplement 1. Selectivity filter of KdpA. (A) Distribution of raw densities for the entire sharpened map. The arrow indicates the threshold used for rendering the map in Figure 2 (0.5 which corresponds to 6.5 σ). The inset shows the extreme tail in the density distribution; the highest four densities (circled at >50 σ) correspond to the K+ ion modeled at the S3 site. (B) Coordination of densities in the selectivity filter in the refined model. The regular network of bonds at the S3 site suggests that this is the high-affinity binding site for K+, whereas less regular coordination at other sites is consistent with water.CC BY · PubMed Central
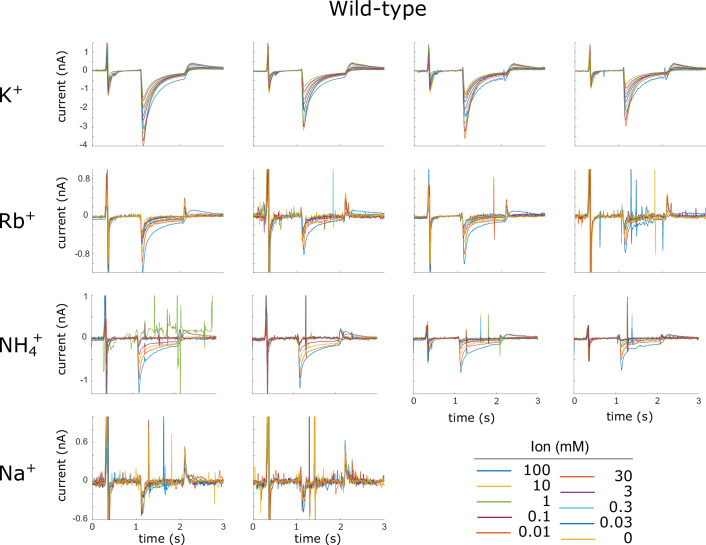
Figure 2—figure supplement 2. Current traces for WT KdpFABC. Raw data from replicate SSME titrations using WT KdpFABC are shown. The ions used for each titration are shown along the left margin. Each panel represents a single titration with ion concentrations indicated in the legend. Four replicate titrations from two different sensors were recorded for each ion. Sharp spikes in some of the traces are generally due to air bubbles in the microfluidic system and were not included in the analysis.
Figure 2—figure supplement 2. Current traces for WT KdpFABC. Raw data from replicate SSME titrations using WT KdpFABC are shown. The ions used for each titration are shown along the left margin. Each panel represents a single titration with ion concentrations indicated in the legend. Four replicate titrations from two different sensors were recorded for each ion. Sharp spikes in some of the traces are generally due to air bubbles in the microfluidic system and were not included in the analysis.CC BY · PubMed Central
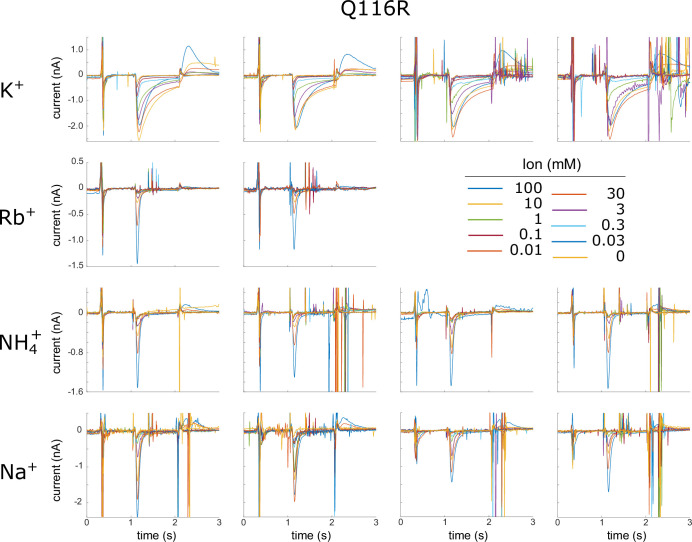
Figure 2—figure supplement 3. Current traces for Q116R. Raw data from replicate SSME titrations using the Q116R mutant in KdpA are shown. The ions used for each titration are shown along the left margin. Each panel represents a single titration with ion concentrations indicated in the legend. Four replicate titrations from two different sensors were recorded for each ion. Transient peaks seen for Rb+ and NH4+ are likely due to pre-steady state binding events and not to sustained transport of these ions. As a result, data for analysis were taken at 1.25 s, which is after this pre-steady state signal has decayed. Sharp spikes in some of the traces are generally due to air bubbles in the microfluidic system and were not included in the analysis.
Figure 2—figure supplement 3. Current traces for Q116R. Raw data from replicate SSME titrations using the Q116R mutant in KdpA are shown. The ions used for each titration are shown along the left margin. Each panel represents a single titration with ion concentrations indicated in the legend. Four replicate titrations from two different sensors were recorded for each ion. Transient peaks seen for Rb+ and NH4+ are likely due to pre-steady state binding events and not to sustained transport of these ions. As a result, data for analysis were taken at 1.25 s, which is after this pre-steady state signal has decayed. Sharp spikes in some of the traces are generally due to air bubbles in the microfluidic system and were not included in the analysis.CC BY · PubMed Central
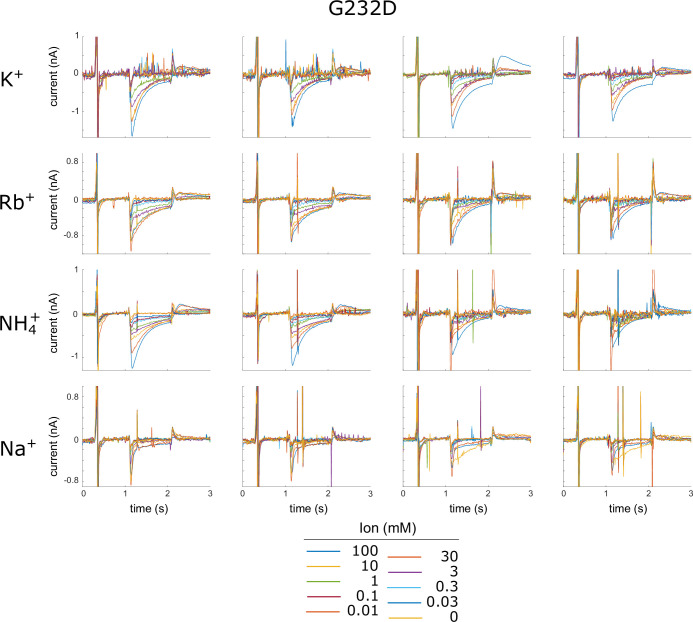
Figure 2—figure supplement 4. Current traces for G232D. Raw data from replicate SSME titrations using the G232D mutant in KdpA are shown. The ions used for each titration are shown along the left margin. Each panel represents a single titration with ion concentrations indicated in the legend. Four replicate titrations from two different sensors were recorded for each ion. Sharp spikes in some of the traces are generally due to air bubbles in the microfluidic system and were not included in the analysis.
Figure 2—figure supplement 4. Current traces for G232D. Raw data from replicate SSME titrations using the G232D mutant in KdpA are shown. The ions used for each titration are shown along the left margin. Each panel represents a single titration with ion concentrations indicated in the legend. Four replicate titrations from two different sensors were recorded for each ion. Sharp spikes in some of the traces are generally due to air bubbles in the microfluidic system and were not included in the analysis.CC BY · PubMed Central
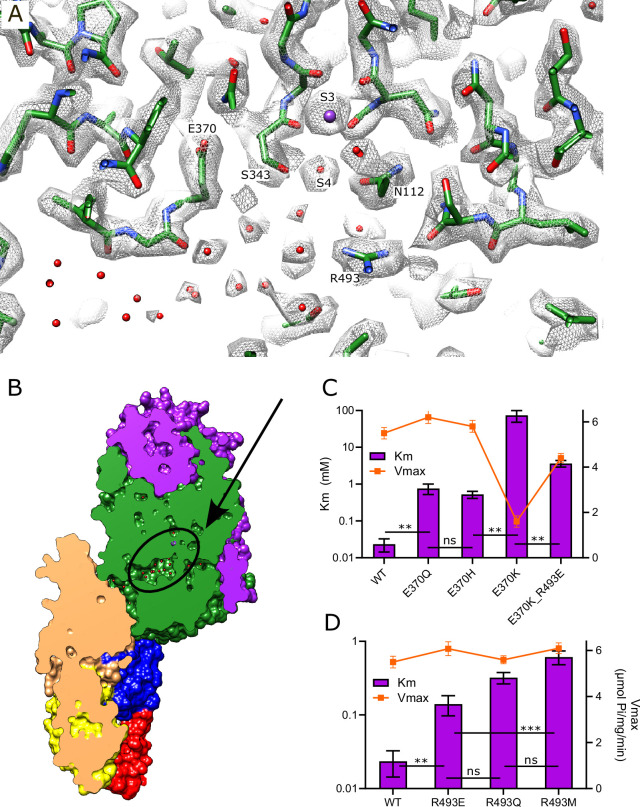
Figure 3. Vestibule of KdpA. (A) The map reveals numerous spherical densities immediately below the selectivity filter and leading into the tunnel that connects KdpA with KdpB. Glu370 and Arg493 are the only charged residues in the transmembrane domain of KdpA and reside on either side of this vestibule. Gray mesh corresponds to the sharpened map at 6.5 σ. (B) Slice through a surface rendering of the model for KdpFABC showing location of the vestibule pictured in panel (A). (C) ATPase assays of E370Q and E370H show that neutralization of charge on Glu370 reduces the apparent affinity without affecting Vmax, but that reversing the charge with E370K almost completely abolishes activity. The double mutant E370K/R493E partially restores activity, but with much lower apparent affinity and Vmax. (D) ATPase assays show that mutation of Arg493 has relatively modest effects on apparent affinity without affecting Vmax. Note that the axis with Km is logarithmic. Table 3 shows measurements from transport assays that are broadly consistent with these ATPase data. Data in panels (C) and (D) were derived from three technical replicates plotted with SEM; statistical significance was evaluated by one-way ANOVA analysis: **p<0.01, ***p<0.001 and ns indicates ‘not significant’.
Figure 3. Vestibule of KdpA. (A) The map reveals numerous spherical densities immediately below the selectivity filter and leading into the tunnel that connects KdpA with KdpB. Glu370 and Arg493 are the only charged residues in the transmembrane domain of KdpA and reside on either side of this vestibule. Gray mesh corresponds to the sharpened map at 6.5 σ. (B) Slice through a surface rendering of the model for KdpFABC showing location of the vestibule pictured in panel (A). (C) ATPase assays of E370Q and E370H show that neutralization of charge on Glu370 reduces the apparent affinity without affecting Vmax, but that reversing the charge with E370K almost completely abolishes activity. The double mutant E370K/R493E partially restores activity, but with much lower apparent affinity and Vmax. (D) ATPase assays show that mutation of Arg493 has relatively modest effects on apparent affinity without affecting Vmax. Note that the axis with Km is logarithmic. Table 3 shows measurements from transport assays that are broadly consistent with these ATPase data. Data in panels (C) and (D) were derived from three technical replicates plotted with SEM; statistical significance was evaluated by one-way ANOVA analysis: **p<0.01, ***p<0.001 and ns indicates ‘not significant’.CC BY · PubMed Central
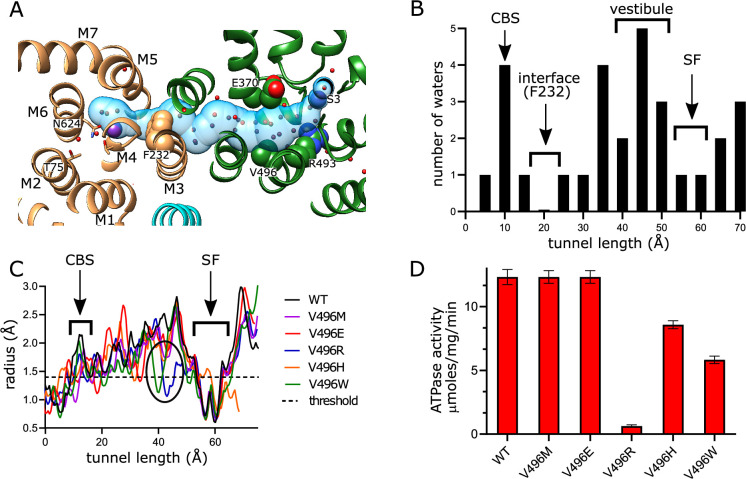
Figure 4. Tunnel connecting KdpA and KdpB. (A) The inter-subunit tunnel is shown as a transparent blue surface running from the selectivity filter on the right (S3) to the canonical binding site on the left (near Asn624). Non-protein densities within the tunnel have been modeled as water molecules (small spheres). Asp370, Arg493 in the vestibule and Phe232 at the subunit interface are shown as space-filling models and K+ as large purple spheres. As in other figures, KdpA helices are green and KdpB helices are brown; KdpF is cyan. (B) The distribution of water molecules within the tunnel shows that the vestibule is well populated, whereas the subunit interface is quite hydrophobic. Values along the x-axis correspond to the contour length along the tunnel. (C) Tunnel profiles for the experimentally determined model (WT) and predicted models for the Val496 mutants. The horizontal dotted line at a radius of 1.4 Å represents the conventional limit for passage of water or K+ ions. Note that both V496R and V496W constrict the tunnel. SF and CBS indicate locations of the selectivity filter and canonical binding site, respectively. (D) ATPase assays of the Val496 mutants in 150 mM K+ showing that introduction of positive charge (V496R) abolishes activity. Data was derived from six technical replicates and plotted with SEM. Raw data for the transport assays are shown in Figure 4—figure supplement 1.
Figure 4. Tunnel connecting KdpA and KdpB. (A) The inter-subunit tunnel is shown as a transparent blue surface running from the selectivity filter on the right (S3) to the canonical binding site on the left (near Asn624). Non-protein densities within the tunnel have been modeled as water molecules (small spheres). Asp370, Arg493 in the vestibule and Phe232 at the subunit interface are shown as space-filling models and K+ as large purple spheres. As in other figures, KdpA helices are green and KdpB helices are brown; KdpF is cyan. (B) The distribution of water molecules within the tunnel shows that the vestibule is well populated, whereas the subunit interface is quite hydrophobic. Values along the x-axis correspond to the contour length along the tunnel. (C) Tunnel profiles for the experimentally determined model (WT) and predicted models for the Val496 mutants. The horizontal dotted line at a radius of 1.4 Å represents the conventional limit for passage of water or K+ ions. Note that both V496R and V496W constrict the tunnel. SF and CBS indicate locations of the selectivity filter and canonical binding site, respectively. (D) ATPase assays of the Val496 mutants in 150 mM K+ showing that introduction of positive charge (V496R) abolishes activity. Data was derived from six technical replicates and plotted with SEM. Raw data for the transport assays are shown in Figure 4—figure supplement 1.CC BY · PubMed Central
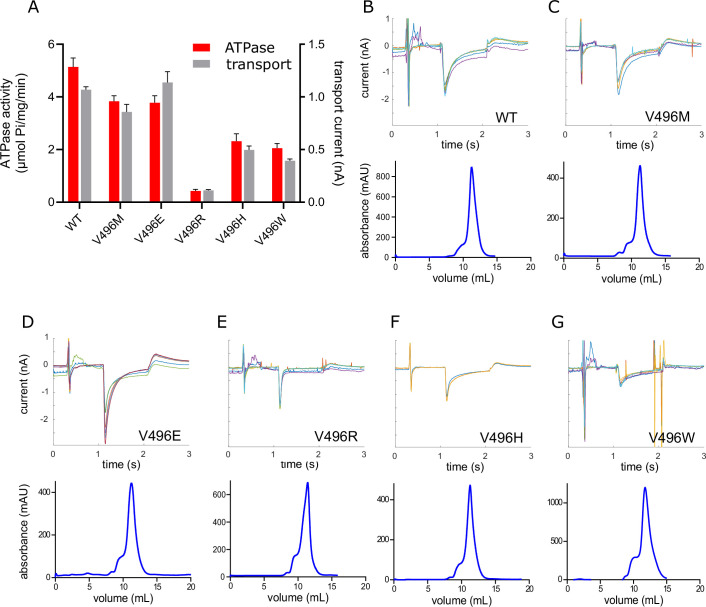
Figure 4—figure supplement 1. Transport activity of Val496 mutants. (A) Comparison of ATPase and transport activities from reconstituted proteoliposomes of WT and Val496 mutants. A small amount of detergent (1 mg/ml DM) was added to proteoliposomes to prevent buildup of electrochemical gradients during the ATPase assays, whereas transport was measured from intact proteoliposomes by SSME. Effects of the mutations are comparable to those seen prior to reconstitution (Figure 4) and indicate that energy coupling is not affected. Data were derived from 3 to 6 technical replicates as reflected in the source data and the error bars represent SEM. (B–G) Raw data from SSME recordings (top) as well as gel filtration profiles (bottom) are shown for WT and Val496 mutants. SSME traces represent six replicates recorded in 100 mM K+ taken from two individual sensors. Note that the V496R mutant displays a highly transient peak consistent with a pre-steady state binding event, with very little sustained transport current. The gel filtration profiles characterize the final step of purification with all mutants producing a relatively symmetric peak at a consistent elution volume, thus indicating that Val496 mutation does not affect stability or homogeneity of the preparation.
Figure 4—figure supplement 1. Transport activity of Val496 mutants. (A) Comparison of ATPase and transport activities from reconstituted proteoliposomes of WT and Val496 mutants. A small amount of detergent (1 mg/ml DM) was added to proteoliposomes to prevent buildup of electrochemical gradients during the ATPase assays, whereas transport was measured from intact proteoliposomes by SSME. Effects of the mutations are comparable to those seen prior to reconstitution (Figure 4) and indicate that energy coupling is not affected. Data were derived from 3 to 6 technical replicates as reflected in the source data and the error bars represent SEM. (B–G) Raw data from SSME recordings (top) as well as gel filtration profiles (bottom) are shown for WT and Val496 mutants. SSME traces represent six replicates recorded in 100 mM K+ taken from two individual sensors. Note that the V496R mutant displays a highly transient peak consistent with a pre-steady state binding event, with very little sustained transport current. The gel filtration profiles characterize the final step of purification with all mutants producing a relatively symmetric peak at a consistent elution volume, thus indicating that Val496 mutation does not affect stability or homogeneity of the preparation.CC BY · PubMed Central
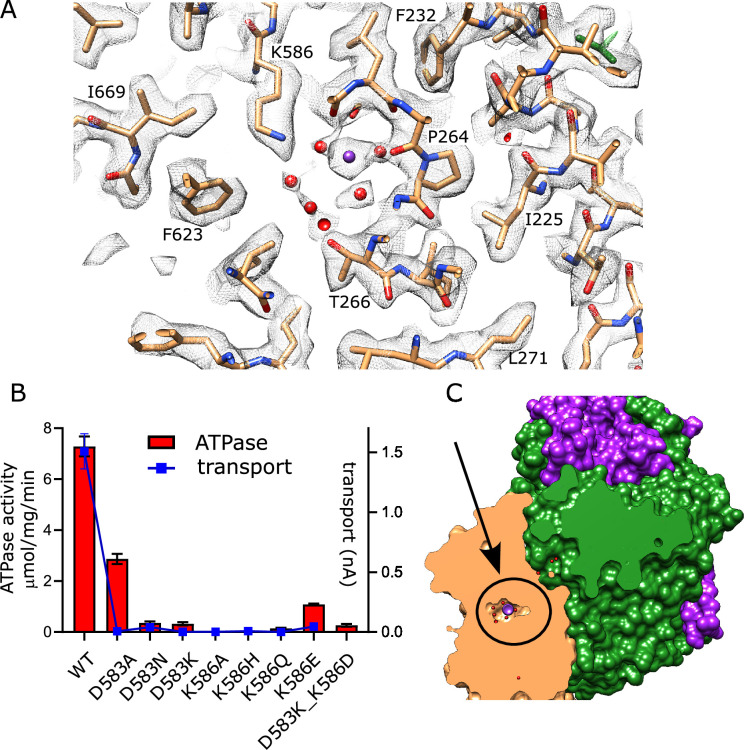
Figure 5. Canonical binding site in KdpB. (A) Several non-protein densities are visible at the canonical binding site, the most prominent of which occupies the conserved Na2/Ca2 site from Na,K-ATPase and SERCA (Figure 5—figure supplement 1). This site has the highest density in KdpB (Figure 5—figure supplement 2B) and thus has been modeled as K+ (purple sphere), whereas the others are modeled as water (red spheres). Gray mesh corresponds to the sharpened map at 5.8 σ. (B) Asp583 and Lys586 are the only charged residues in the transmembrane domain of KdpB. ATPase and transport assays in 150 mM K+ show that mutation of these residues is generally not tolerated, except for the D583A mutation that generates an uncoupled phenotype (ATPase activity without transport). Data was derived from 3 to 8 technical replicates as reflected in the source data and error bars represent SEM. Raw data for the transport assays are shown in Figure 5—figure supplement 3. (C) Slice through a surface rendering of the model for KdpFABC showing location of the CBS pictured in panel (A).
Figure 5. Canonical binding site in KdpB. (A) Several non-protein densities are visible at the canonical binding site, the most prominent of which occupies the conserved Na2/Ca2 site from Na,K-ATPase and SERCA (Figure 5—figure supplement 1). This site has the highest density in KdpB (Figure 5—figure supplement 2B) and thus has been modeled as K+ (purple sphere), whereas the others are modeled as water (red spheres). Gray mesh corresponds to the sharpened map at 5.8 σ. (B) Asp583 and Lys586 are the only charged residues in the transmembrane domain of KdpB. ATPase and transport assays in 150 mM K+ show that mutation of these residues is generally not tolerated, except for the D583A mutation that generates an uncoupled phenotype (ATPase activity without transport). Data was derived from 3 to 8 technical replicates as reflected in the source data and error bars represent SEM. Raw data for the transport assays are shown in Figure 5—figure supplement 3. (C) Slice through a surface rendering of the model for KdpFABC showing location of the CBS pictured in panel (A).CC BY · PubMed Central
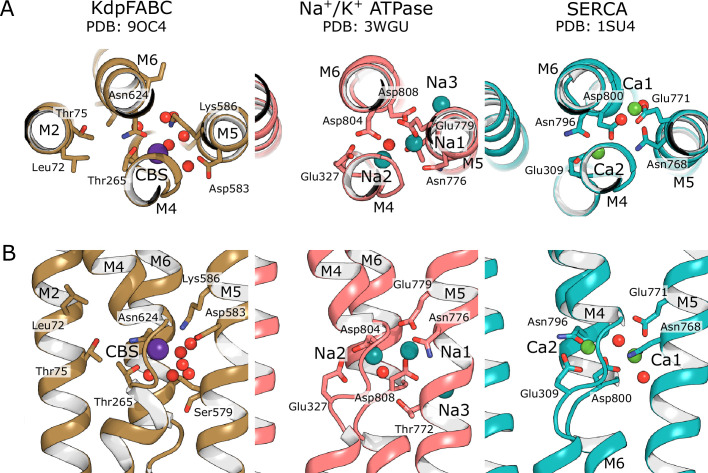
Figure 5—figure supplement 1. Canonical binding sites of P-type ATPases. The primary K+ binding site in KdpB is structurally conserved with ion binding sites for Na+ in Na,K-ATPase and Ca2+ in SERCA. Whereas multiple ions are transported in each cycle by these related P-type ATPases, only a single ion appears to bind to KdpB at a position equivalent to the Na2 and Ca2 sites. Like those sites, the K+ in KdpB is coordinated by carbonyl oxygens exposed by the unwinding of the M4 helix near a conserved proline (Figure 5—figure supplement 2). Additional ions bind in a pocket between M4, M5, and M6 in Na,K-ATPase and SERCA, which is occupied by weaker densities in KdpB that are modeled as water.
Figure 5—figure supplement 1. Canonical binding sites of P-type ATPases. The primary K+ binding site in KdpB is structurally conserved with ion binding sites for Na+ in Na,K-ATPase and Ca2+ in SERCA. Whereas multiple ions are transported in each cycle by these related P-type ATPases, only a single ion appears to bind to KdpB at a position equivalent to the Na2 and Ca2 sites. Like those sites, the K+ in KdpB is coordinated by carbonyl oxygens exposed by the unwinding of the M4 helix near a conserved proline (Figure 5—figure supplement 2). Additional ions bind in a pocket between M4, M5, and M6 in Na,K-ATPase and SERCA, which is occupied by weaker densities in KdpB that are modeled as water.CC BY · PubMed Central
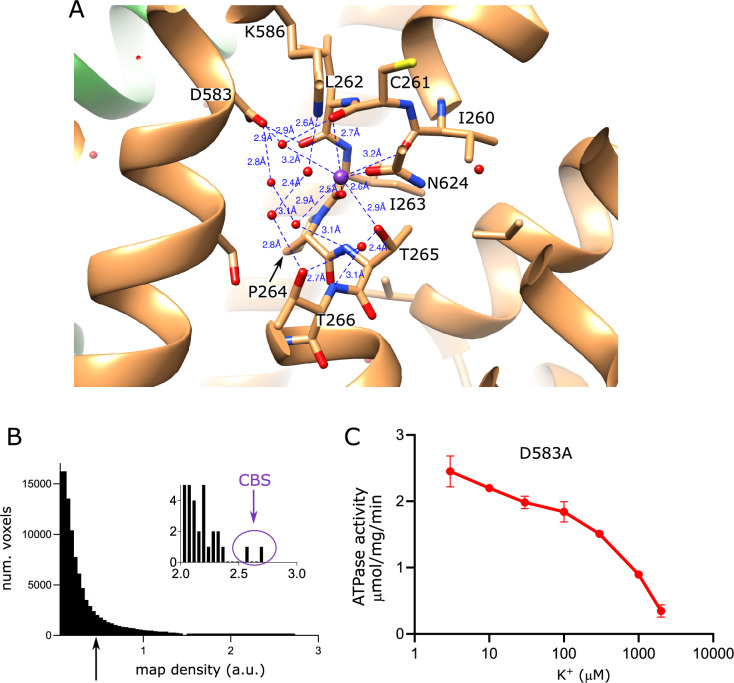
Figure 5—figure supplement 2. Properties of the canonical binding site in KdpB. (A) Coordination network involving K+ and water molecules in the canonical binding site. (B) Distribution of raw densities for KdpB portion of the sharpened map, with the inset highlighting the highest two densities (>30 σ), both of which correspond to the K+ ion modeled at the canonical binding site (CBS). The arrow indicates the density threshold used for rendering the map in Figure 5 (0.45 which corresponds to 5.8 σ). (C) ATPase activity of the KdpB-D583A mutant showing uncoupled activity at low K+ that is inhibited at higher K+ concentrations. Data were derived from three technical replicates, and the error bars represent SEM.
Figure 5—figure supplement 2. Properties of the canonical binding site in KdpB. (A) Coordination network involving K+ and water molecules in the canonical binding site. (B) Distribution of raw densities for KdpB portion of the sharpened map, with the inset highlighting the highest two densities (>30 σ), both of which correspond to the K+ ion modeled at the canonical binding site (CBS). The arrow indicates the density threshold used for rendering the map in Figure 5 (0.45 which corresponds to 5.8 σ). (C) ATPase activity of the KdpB-D583A mutant showing uncoupled activity at low K+ that is inhibited at higher K+ concentrations. Data were derived from three technical replicates, and the error bars represent SEM.CC BY · PubMed Central
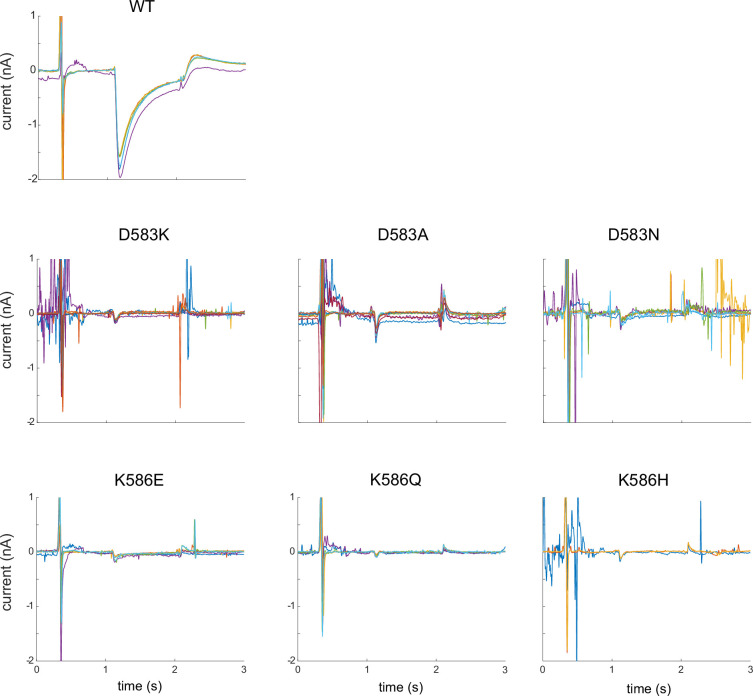
Figure 5—figure supplement 3. Current traces from CBS mutants. Raw data from replicate SSME titrations in 100 mM K+ using mutants in the CBS of KdpB. WT protein is included as a positive control. Each panel shows six replicates taken from two individual sensors and indicates very little transport activity from these mutants.
Figure 5—figure supplement 3. Current traces from CBS mutants. Raw data from replicate SSME titrations in 100 mM K+ using mutants in the CBS of KdpB. WT protein is included as a positive control. Each panel shows six replicates taken from two individual sensors and indicates very little transport activity from these mutants.CC BY · PubMed Central
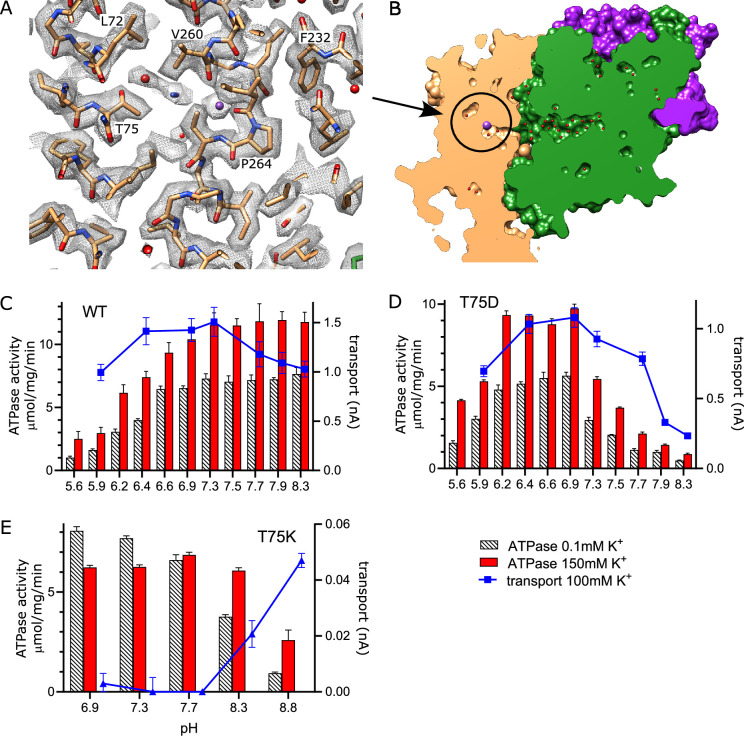
Figure 6. Exit site from KdpB. (A) The map shows a water-filled cavity next to Thr75 that leads to the cytoplasm (sharpened map at 6.5 σ). (B) Slice through a surface rendering of the model for KdpFABC showing location of the exit site pictured in panel (A). (C, D) pH dependence of the T75D mutant is shifted relative to WT, consistent with the idea that high pH generates negative charge in this cavity and inhibits K+ release. (E) The T75K substitution not only interferes with transport, but also produces an uncoupled phenotype in which ATPase activity is not dependent on K+. At high pH, there is a small recovery of transport activity as well as K+-dependence of ATPase activity, suggesting that these effects result from the positive charge from the lysine substitution. Data was derived from six technical replicates and plotted with SEM. Raw data for the transport assays are shown in Figure 6—figure supplement 2.
Figure 6. Exit site from KdpB. (A) The map shows a water-filled cavity next to Thr75 that leads to the cytoplasm (sharpened map at 6.5 σ). (B) Slice through a surface rendering of the model for KdpFABC showing location of the exit site pictured in panel (A). (C, D) pH dependence of the T75D mutant is shifted relative to WT, consistent with the idea that high pH generates negative charge in this cavity and inhibits K+ release. (E) The T75K substitution not only interferes with transport, but also produces an uncoupled phenotype in which ATPase activity is not dependent on K+. At high pH, there is a small recovery of transport activity as well as K+-dependence of ATPase activity, suggesting that these effects result from the positive charge from the lysine substitution. Data was derived from six technical replicates and plotted with SEM. Raw data for the transport assays are shown in Figure 6—figure supplement 2.CC BY · PubMed Central
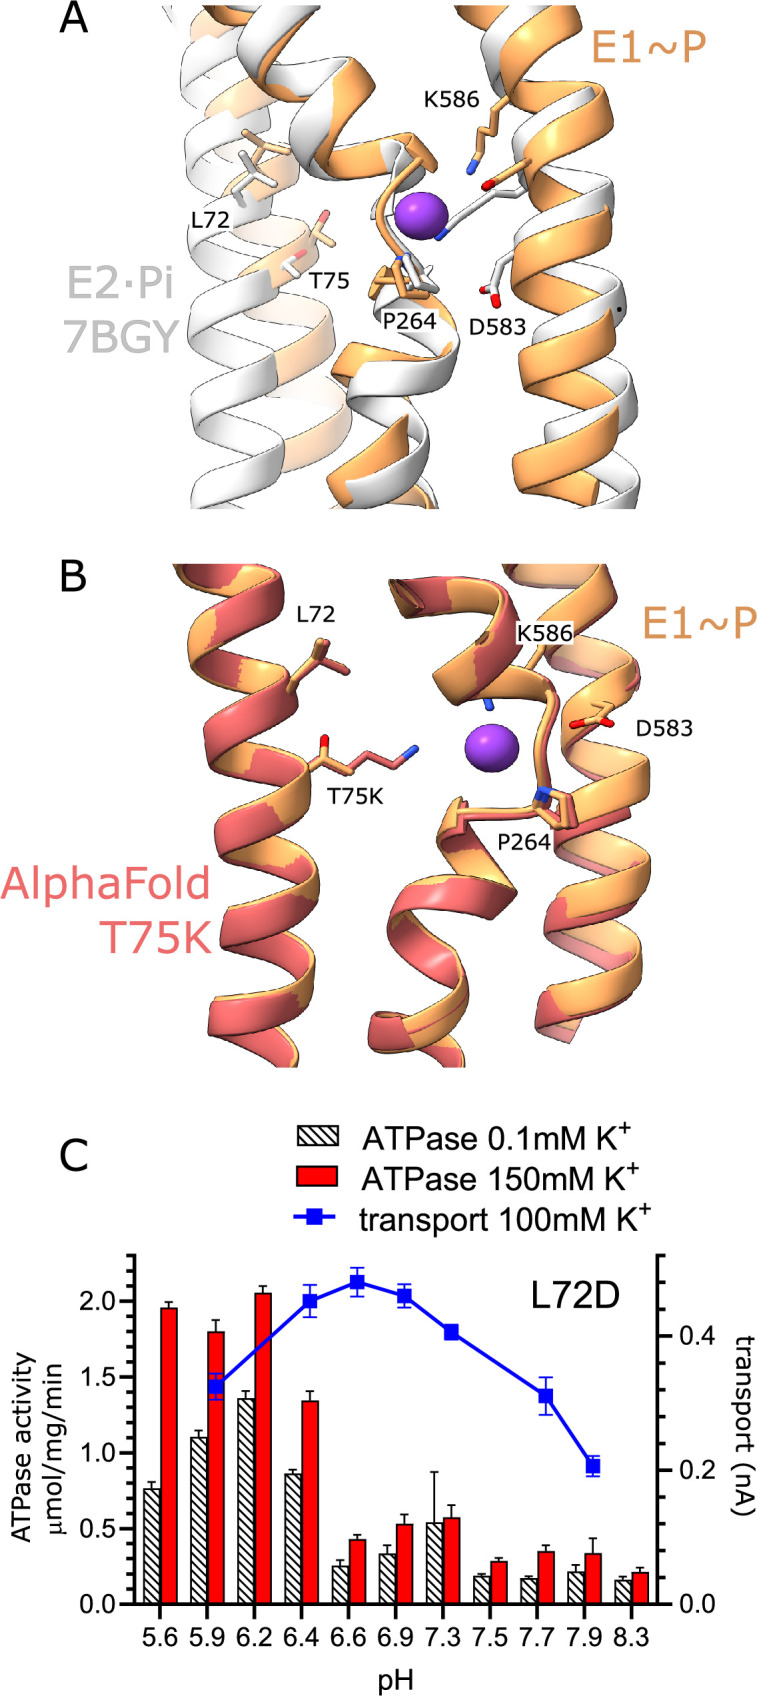
Figure 6—figure supplement 1. Exit site for K+ from KdpB. (A) Comparison of the canonical binding site from E1~P (this study) and E2·Pi determined previously by Sweet et al., 2021 (PDB code 7BGY). In particular, movements of M5 cause Lys586 to swing into the canonical binding site in E2·Pi, thus displacing the K+. (B) Comparison of the exit site from wild-type E1~P model with a predicted model for the T75K mutant. In this predicted structure, the lysine side chain occupies the canonical binding site, thus potentially acting as a built-in ion to stimulate ATPase activity in the absence of K+. (C) pH dependence of both ATPase activity and transport from the KdpB-L72D mutant. Like the T75D mutant, the pH dependence of activity is shifted towards low pH. Although the rates are lower than WT and T75D, the K+ dependence of ATPase activity indicates that energy coupling is intact. Data were derived from six technical replicates and the error bars represent SEM.
Figure 6—figure supplement 1. Exit site for K+ from KdpB. (A) Comparison of the canonical binding site from E1~P (this study) and E2·Pi determined previously by Sweet et al., 2021 (PDB code 7BGY). In particular, movements of M5 cause Lys586 to swing into the canonical binding site in E2·Pi, thus displacing the K+. (B) Comparison of the exit site from wild-type E1~P model with a predicted model for the T75K mutant. In this predicted structure, the lysine side chain occupies the canonical binding site, thus potentially acting as a built-in ion to stimulate ATPase activity in the absence of K+. (C) pH dependence of both ATPase activity and transport from the KdpB-L72D mutant. Like the T75D mutant, the pH dependence of activity is shifted towards low pH. Although the rates are lower than WT and T75D, the K+ dependence of ATPase activity indicates that energy coupling is intact. Data were derived from six technical replicates and the error bars represent SEM.CC BY · PubMed Central
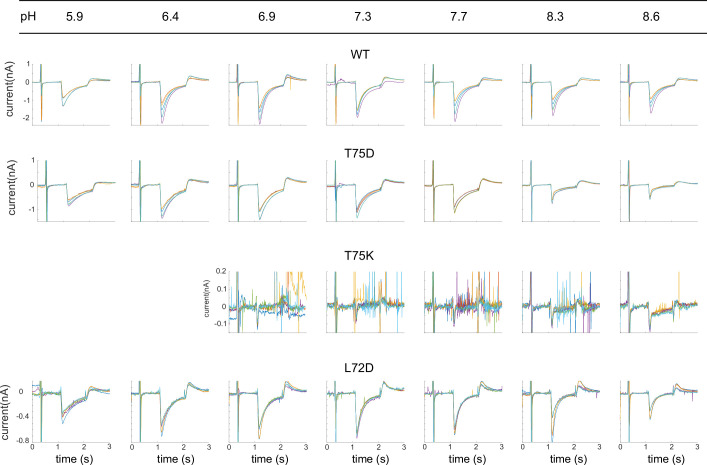
Figure 6—figure supplement 2. Current traces from exit site mutants. Raw data from replicate SSME pH titrations using mutants in the exit site of KdpB. WT protein is included as a control. Each panel shows six replicates taken from two individual sensors at the pH indicated across the top border. Sharp spikes in the traces are generally due to air bubbles in the microfluidic system. These spikes appear amplified for T75K due to the compressed current range of this largely inactive mutant; such spikes were not included in the analysis.
Figure 6—figure supplement 2. Current traces from exit site mutants. Raw data from replicate SSME pH titrations using mutants in the exit site of KdpB. WT protein is included as a control. Each panel shows six replicates taken from two individual sensors at the pH indicated across the top border. Sharp spikes in the traces are generally due to air bubbles in the microfluidic system. These spikes appear amplified for T75K due to the compressed current range of this largely inactive mutant; such spikes were not included in the analysis.CC BY · PubMed Central
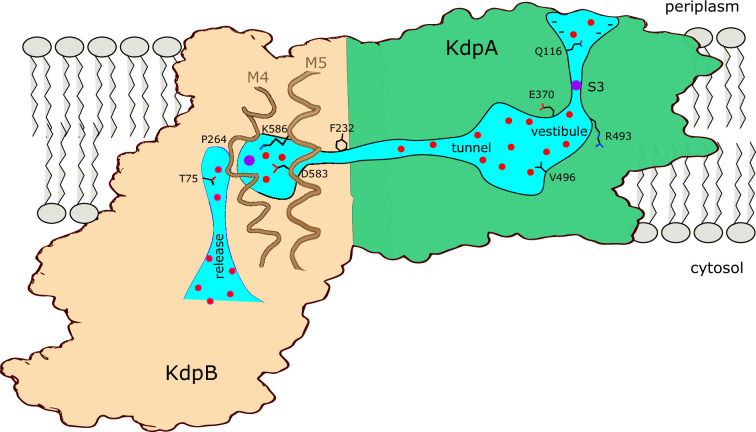
Figure 7. Conduction pathway of KdpFABC. Diagram illustrating features of the conduction pathway seen in the E1~P·ADP map together with residues that have been mutated in this study. Ions (purple spheres) are attracted from the periplasm to the mouth of the selectivity filter of KdpA by negative surface potential. Selectivity and affinity of the pump is governed by tight coordination of the ion at the S3 site. Ions become rehydrated upon release into a vestibule filled with water (red spheres) next to charged residues Glu370 and Arg493. Val496 resides in the widest part of the tunnel where introduction of positive charge abolishes transport. Phe232 resides at the subunit interface where there is a hydrophobic barrier that is essential to ion occlusion. K+ binding to the canonical binding site next to Pro264 on M4 in KdpB triggers phosphorylation of Asp307 followed by allosteric movements of M5 that drive Lys586 to displace the ion into the exit site next to Thr75. A general lack of ligands in this exit site is consistent with low affinity, thus promoting K+ release to the cytoplasm against the electrochemical gradient.
Figure 7. Conduction pathway of KdpFABC. Diagram illustrating features of the conduction pathway seen in the E1~P·ADP map together with residues that have been mutated in this study. Ions (purple spheres) are attracted from the periplasm to the mouth of the selectivity filter of KdpA by negative surface potential. Selectivity and affinity of the pump is governed by tight coordination of the ion at the S3 site. Ions become rehydrated upon release into a vestibule filled with water (red spheres) next to charged residues Glu370 and Arg493. Val496 resides in the widest part of the tunnel where introduction of positive charge abolishes transport. Phe232 resides at the subunit interface where there is a hydrophobic barrier that is essential to ion occlusion. K+ binding to the canonical binding site next to Pro264 on M4 in KdpB triggers phosphorylation of Asp307 followed by allosteric movements of M5 that drive Lys586 to displace the ion into the exit site next to Thr75. A general lack of ligands in this exit site is consistent with low affinity, thus promoting K+ release to the cytoplasm against the electrochemical gradient.CC BY · PubMed Central

Verification

Claims the paper makes

The claims and statistics of this paper haven’t been checked yet.

Run the check — free, no account needed. It reads the open-access text and checks the sources it cites.

A few free checks a day · papers already verified open instantly · results are public

Self-check

Percentages, sums and reported differences re-computed from the paper’s own numbers.

The self-check needs the paper’s full text.

Citations

Cites

Show all 1 references

Research works printed but not linked: 66

  1. Adams, 2010, PHENIX: a comprehensive Python-based system for macromolecular structure solution, Acta Crystallographica. Section D, Biological Crystallography, 66, 213, 10.1107/S0907444909052925 · DOI · Paper page
  2. Albers, 1967, Biochemical aspects of active transport, Annual Review of Biochemistry, 36, 727, 10.1146/annurev.bi.36.070167.003455 · DOI
  3. Bazzone, 2022, SSM-based electrophysiology, a label-free real-time method reveals sugar binding & transport events in SGLT1, Biosensors & Bioelectronics, 197, 10.1016/j.bios.2021.113763 · DOI
  4. Bazzone, 2023, Functional characterization of SGLT1 using SSM-based electrophysiology: Kinetics of sugar binding and translocation, Frontiers in Physiology, 14, 10.3389/fphys.2023.1058583 · DOI
  5. Bepler, 2019, Positive-unlabeled convolutional neural networks for particle picking in cryo-electron micrographs, Nature Methods, 16, 1153, 10.1038/s41592-019-0575-8 · DOI
  6. Bitter, 2022, Structure of the Wilson disease copper transporter ATP7B, Science Advances, 8, 10.1126/sciadv.abl5508 · DOI
  7. Bramkamp, 2005, Single amino acid substitution in the putative transmembrane helix V in KdpB of the KdpFABC complex of Escherichia coli uncouples ATPase activity and ion transport, Biochemistry, 44, 8260, 10.1021/bi050135n · DOI
  8. Buurman, 1995, Genetic evidence for two sequentially occupied K+ binding sites in the Kdp transport ATPase, The Journal of Biological Chemistry, 270, 6678, 10.1074/jbc.270.12.6678 · DOI
  9. Calì, 2017, Regulation of cell calcium and role of plasma membrane calcium ATPases, International Review of Cell and Molecular Biology, 332, 259, 10.1016/bs.ircmb.2017.01.002 · DOI
  10. Diskowski, 2015, Functional diversity of the superfamily of K+ transporters to meet various requirements, Biological Chemistry, 396, 1003, 10.1515/hsz-2015-0123 · DOI
  11. Dorus, 2001, Substrate-binding clusters of the K+-transporting Kdp ATPase of Escherichia coli investigated by amber suppression scanning mutagenesis, The Journal of Biological Chemistry, 276, 9590, 10.1074/jbc.M009365200 · DOI
  12. Doyle, 1998, The structure of the potassium channel: molecular basis of K+ conduction and selectivity, Science, 280, 69, 10.1126/science.280.5360.69 · DOI
  13. Durell, 2000, Does the KdpA subunit from the high affinity K+-translocating P-type KDP-ATPase have a structure similar to that of K+ channels?, Biophysical Journal, 78, 188, 10.1016/S0006-3495(00)76584-2 · DOI
  14. Dyla, 2020, Structure and mechanism of P-type ATPase ion pumps, Annual Review of Biochemistry, 89, 583, 10.1146/annurev-biochem-010611-112801 · DOI
  15. Emsley, 2010, Features and development of Coot, Acta Crystallogr Sect - Biol Crystallogr, 66, 486, 10.1107/S0907444910007493 · DOI · Paper page
  16. Epstein, 1970, Potassium-dependant mutants of Escherichia coli K-12, Journal of Bacteriology, 101, 836, 10.1128/jb.101.3.836-843.1970 · DOI
  17. Epstein, 1978, A K+ transport ATPase in Escherichia coli, The Journal of Biological Chemistry, 253, 6666, 10.1016/S0021-9258(17)37969-3 · DOI
  18. Gassel, 1999, The KdpF subunit is part of the K(+)-translocating Kdp complex of Escherichia coli and is responsible for stabilization of the complex in vitro, The Journal of Biological Chemistry, 274, 37901, 10.1074/jbc.274.53.37901 · DOI
  19. Gayen, 2016, Protonation of a glutamate residue modulates the dynamics of the drug transporter EmrE, Nature Chemical Biology, 12, 141, 10.1038/nchembio.1999 · DOI
  20. Henderson, 2020, Alternative proton-binding site and long-distance coupling in Escherichia coli sodium–proton antiporter NhaA, PNAS, 117, 25517, 10.1073/pnas.2005467117 · DOI
  21. Hesse, 1984, Sequence homology between two membrane transport ATPases, the Kdp-ATPase of Escherichia coli and the Ca2+-ATPase of sarcoplasmic reticulum, PNAS, 81, 4746, 10.1073/pnas.81.15.4746 · DOI
  22. Huang, 2017, Crystal structure of the potassium-importing KdpFABC membrane complex, Nature, 546, 681, 10.1038/nature22970 · DOI
  23. Hussein, 2024, Numerical model for electrogenic transport by the ATP-dependent potassium pump KdpFABC, Biophysical Reports, 4, 10.1016/j.bpr.2024.100169 · DOI
  24. Isom, 2010, Charges in the hydrophobic interior of proteins, PNAS, 107, 16096, 10.1073/pnas.1004213107 · DOI
  25. Jurcik, 2018, CAVER Analyst 2.0: analysis and visualization of channels and tunnels in protein structures and molecular dynamics trajectories, Bioinformatics, 34, 3586, 10.1093/bioinformatics/bty386 · DOI
  26. Kanai, 2013, Crystal structure of a Na+-bound Na+,K+-ATPase preceding the E1P state, Nature, 502, 201, 10.1038/nature12578 · DOI
  27. Kühlbrandt, 2004, Biology, structure and mechanism of P-type ATPases, Nature Reviews. Molecular Cell Biology, 5, 282, 10.1038/nrm1354 · DOI
  28. Laimins, 1978, Identification of the structural proteins of an ATP-driven potassium transport system in Escherichia coli, PNAS, 75, 3216, 10.1073/pnas.75.7.3216 · DOI
  29. Lev, 2023, Involvement of the alpha-subunit N-terminus in the mechanism of the Na+,K+-ATPase, Biochimica et Biophysica Acta - Molecular Cell Research, 1870, 10.1016/j.bbamcr.2023.119539 · DOI
  30. Li, 2005, Very fast empirical prediction and rationalization of protein pK a values, Proteins, 61, 704, 10.1002/prot.20660 · DOI
  31. Liu, 2013, Equilibrium selectivity alone does not create K+-selective ion conduction in K+ channels, Nature Communications, 4, 10.1038/ncomms3746 · DOI
  32. Madapally, 2025, On the Mechanism of K + Transport through the Inter-Subunit Tunnel of KdpFABC, 10.1101/2025.03.04.641403 · DOI
  33. Meng, 2023, UCSF ChimeraX: Tools for structure building and analysis, Protein Science, 32, 10.1002/pro.4792 · DOI
  34. Miller, 2000, An overview of the potassium channel family, Genome Biology, 1, 10.1186/gb-2000-1-4-reviews0004 · DOI
  35. Morais-Cabral, 2001, Energetic optimization of ion conduction rate by the K+ selectivity filter, Nature, 414, 37, 10.1038/35102000 · DOI · Paper page
  36. Morrison, 2015, Asymmetric protonation of EmrE, The Journal of General Physiology, 146, 445, 10.1085/jgp.201511404 · DOI
  37. Naranjo, 2016, Pore size matters for potassium channel conductance, The Journal of General Physiology, 148, 277, 10.1085/jgp.201611625 · DOI
  38. Panahi, 2015, Membrane environment modulates the pKa values of transmembrane helices, The Journal of Physical Chemistry. B, 119, 4601, 10.1021/acs.jpcb.5b00289 · DOI
  39. Pedersen, 2007, Crystal structure of the plasma membrane proton pump, Nature, 450, 1111, 10.1038/nature06417 · DOI
  40. Pedersen, 2019, The KdpFABC complex - K+ transport against all odds, Molecular Membrane Biology, 35, 21, 10.1080/09687688.2019.1638977 · DOI
  41. Pettersen, 2004, UCSF Chimera--a visualization system for exploratory research and analysis, Journal of Computational Chemistry, 25, 1605, 10.1002/jcc.20084 · DOI
  42. Post, 1969, Flexibility of an active center in sodium-plus-potassium adenosine triphosphatase, The Journal of General Physiology, 54, 306, 10.1085/jgp.54.1.306 · DOI
  43. Prabhananda, 1991, Nigericin-mediated H+, K+ and Na+ transports across vesicular membrane: T-jump studies, Biochimica et Biophysica Acta, 1070, 481, 10.1016/0005-2736(91)90090-u · DOI
  44. Punjani, 2017, cryoSPARC: algorithms for rapid unsupervised cryo-EM structure determination, Nature Methods, 14, 290, 10.1038/nmeth.4169 · DOI · Paper page
  45. Puppe, 1992, The phosphorylation site of the Kdp-ATPase of Escherichia coli: site-directed mutagenesis of the aspartic acid residues 300 and 307 of the KdpB subunit, Molecular Microbiology, 6, 3511, 10.1111/j.1365-2958.1992.tb01786.x · DOI
  46. Rabieh, 2020, MH-ICP-MS analysis of the freshwater and saltwater environmental resources of upolu island, samoa, Molecules, 25, 10.3390/molecules25214871 · DOI
  47. Rhoads, 1976, Cation transport in Escherichia coli. VIII: potassium transport mutants, The Journal of General Physiology, 67, 325, 10.1085/jgp.67.3.325 · DOI
  48. Scheres, 2012, RELION: Implementation of a Bayesian approach to cryo-EM structure determination, Journal of Structural Biology, 180, 519, 10.1016/j.jsb.2012.09.006 · DOI · Paper page
  49. Schrader, 2000, Replacement of glycine 232 by aspartic acid in the KdpA subunit broadens the ion specificity of the K(+)-translocating KdpFABC complex, Biophysical Journal, 79, 802, 10.1016/S0006-3495(00)76337-5 · DOI
  50. Silberberg, 2021, Deciphering ion transport and ATPase coupling in the intersubunit tunnel of KdpFABC, Nature Communications, 12, 10.1038/s41467-021-25242-x · DOI
  51. Silberberg, 2022, Inhibited KdpFABC transitions into an E1 off-cycle state, eLife, 11, 10.7554/eLife.80988 · DOI
  52. Silberberg, 2024, KdpD is a tandem serine histidine kinase that controls K+ pump KdpFABC transcriptionally and post-translationally, Nature Communications, 15, 10.1038/s41467-024-47526-8 · DOI
  53. Stock, 2018, Cryo-EM structures of KdpFABC suggest a K+ transport mechanism via two inter-subunit half-channels, Nature Communications, 9, 10.1038/s41467-018-07319-2 · DOI
  54. Stumpe, 1996, K+ circulation across the procaryotic cell membrane: k+-uptake systems in: konings WN, 473, 10.1016/S1383-8121(96)80062-5 · DOI
  55. Sweet, 2020, Serine phosphorylation regulates the P-type potassium pump KdpFABC, eLife, 9, 10.7554/eLife.55480 · DOI
  56. Sweet, 2021, Structural basis for potassium transport in prokaryotes by KdpFABC, PNAS, 118, 10.1073/pnas.2105195118 · DOI
  57. Tadini-Buoninsegni, 2006, Pre-steady state electrogenic events of Ca2+/H+ exchange and transport by the Ca2+-ATPase, The Journal of Biological Chemistry, 281, 37720, 10.1074/jbc.M606040200 · DOI
  58. Timcenko, 2019, Structure and autoregulation of a P4-ATPase lipid flippase, Nature, 571, 366, 10.1038/s41586-019-1344-7 · DOI
  59. Toyoshima, 2000, Crystal structure of the calcium pump of sarcoplasmic reticulum at 2.6 A resolution, Nature, 405, 647, 10.1038/35015017 · DOI
  60. van der Laan, 2002, Characterization of amino acid substitutions in KdpA, the K+-binding and -translocating subunit of the KdpFABC complex of Escherichia coli, Journal of Bacteriology, 184, 5491, 10.1128/JB.184.19.5491-5494.2002 · DOI
  61. Walderhaug, 1992, KdpD and KdpE, proteins that control expression of the kdpABC operon, are members of the two-component sensor-effector class of regulators, Journal of Bacteriology, 174, 2152, 10.1128/jb.174.7.2152-2159.1992 · DOI
  62. Wang, 2014, Structure and mechanism of Zn2+-transporting P-type ATPases, Nature, 514, 518, 10.1038/nature13618 · DOI
  63. Warren, 1974, Reversible lipid titrations of the activity of pure adenosine triphosphatase-lipid complexes, Biochemistry, 13, 5501, 10.1021/bi00724a008 · DOI
  64. Zhang, 2021, One-step construction of circularized nanodiscs using SpyCatcher-SpyTag, Nature Communications, 12, 10.1038/s41467-021-25737-7 · DOI
  65. Zhao, 2021, Structure and activation mechanism of the hexameric plasma membrane H+-ATPase, Nature Communications, 12, 10.1038/s41467-021-26782-y · DOI
  66. Hussein AK, Zhang X, Pedersen BP, Stokes DL. 2025. High-resolution cryo-EM structure of KdpFABC in the E1P-ADP state in lipid nanodisc. Worldwide Protein Data Bank. · DOI

Metadata

Authors
Hussein, A., Zhang, X., Pedersen, B. P., & Stokes, D. L.
Affiliations
  • NYU Langone Health (US)
  • Aarhus University (DK)
Corresponding author
Stokes, David L
Venue
eLife
Published
2025-11-19
Volume
14
ISSN
2050-084X (ISSN-L)
OpenAlex
W4410106811
Cited by
2
References
1
Citations by year
2026: 2
Type
posted content
Language
en
Open access
Locations
  • eLife (publishedVersion, cc-by)
  • bioRxiv (Cold Spring Harbor Laboratory) (acceptedVersion, cc-by)
  • Europe PMC (PubMed Central) (publishedVersion, cc-by)
  • PubMed (publishedVersion)
  • PubMed Central (publishedVersion, cc-by)
  • DOAJ (DOAJ: Directory of Open Access Journals) (submittedVersion, cc-by-sa)
Funders
  • National Institute of General Medical Sciences (R35GM144109, R24GM154185)
  • Novo Nordisk Fonden (NNF24OC0088380)
  • European Research Council (101000936)
  • National Cancer Institute (P30CA016087)
  • National Institute of Neurological Disorders and Stroke (R01NS108151)
Topics
  • Life Sciences › Biochemistry, Genetics and Molecular Biology › Molecular Biology › ATP Synthase and ATPases Research
  • Life Sciences › Biochemistry, Genetics and Molecular Biology › Molecular Biology › Ion channel regulation and function
  • Life Sciences › Biochemistry, Genetics and Molecular Biology › Molecular Biology › Ion Transport and Channel Regulation
Keywords
potassium pump, Escherichia coli, osmotic stress, P-type ATPase, lipid nanodiscs, cryo-EM structure, selectivity filter, ion binding sites

About these checks

Registry, retraction, Cites and statistics results are computed, not judged, with one exception: a printed reference that no index lists is read once by a model before it counts as a citation error. Claims are extracted by a model and kept only when their quote appears verbatim in the text; each cited source is then checked, with a model’s help, for whether it says what the claim relies on. Those verdicts can be wrong — read the claim’s quote and the cited source before relying on one.

Statistics and arithmetic are recomputed, not judged.

Confidence bands are shown only for fields calibrated on our annotated test set. None is calibrated yet, so no band is shown.

What counts as a claim ›How we measure confidence ›How we check this ›

Are you an author, or do you see a problem with this page? Request a review

How to cite

Cite CoChat for the checks on this page, and the paper for its own findings.

This page
CoChat. (2026). Citation check: Conduction pathway for potassium through the Escherichia coli pump KdpFABC. https://app.cochat.ai/papers/10.7554/elife.107397.4
The paper
Hussein, A., Zhang, X., Pedersen, B. P., & Stokes, D. L. (2025). Conduction pathway for potassium through the Escherichia coli pump KdpFABC. eLife. https://doi.org/10.7554/elife.107397.4