

The DOI matches its Crossref record; 66 of the 66 references it cites were found in a registry or an index.
Publication bias and the canonization of false facts
Open accessAbstract
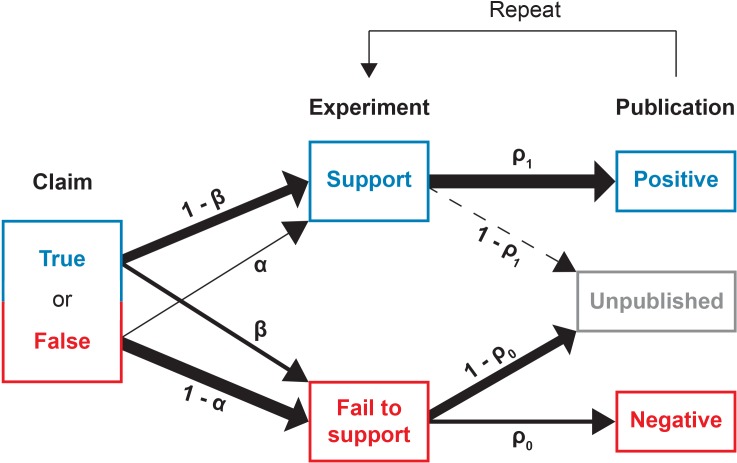
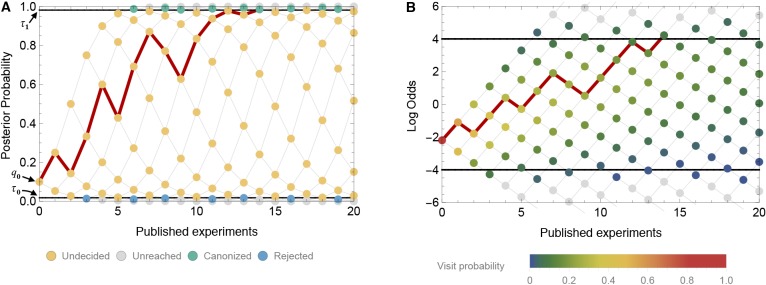
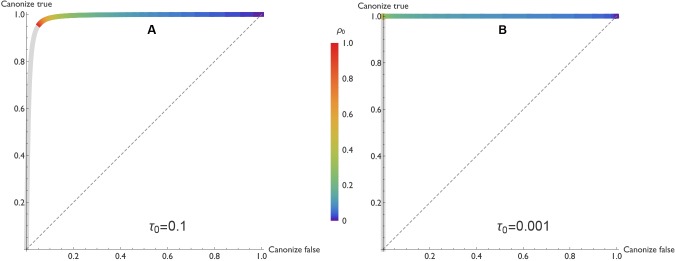
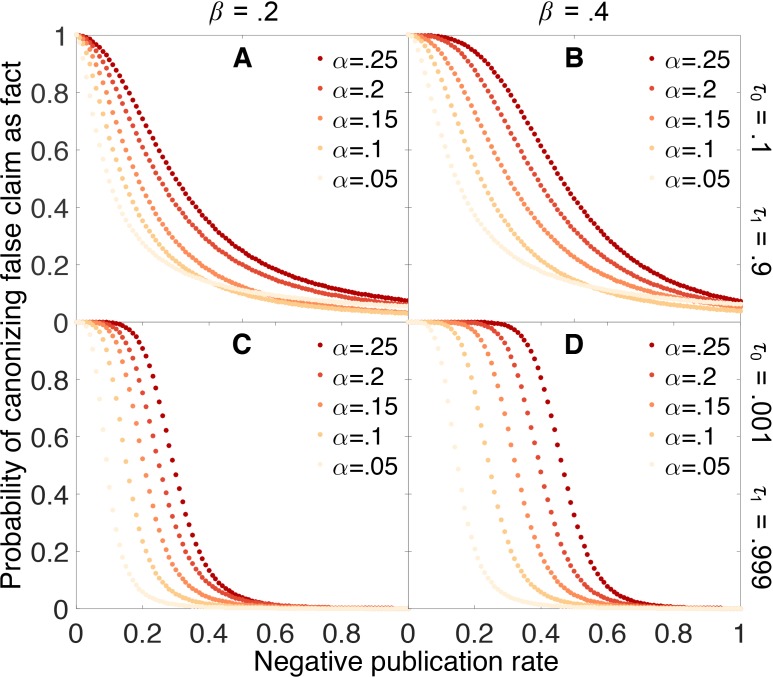
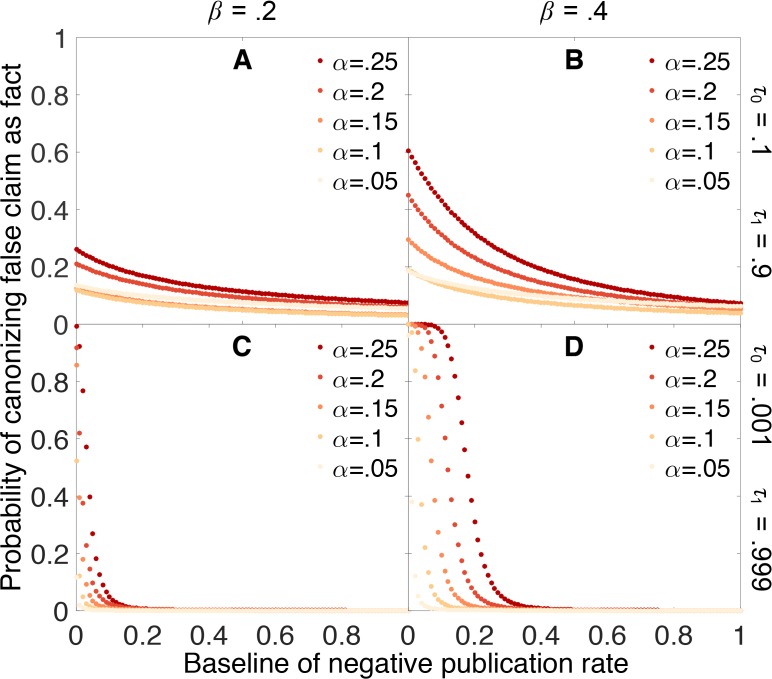
Science is facing a “replication crisis” in which many experimental findings cannot be replicated and are likely to be false. Does this imply that many scientific facts are false as well? To find out, we explore the process by which a claim becomes fact. We model the community’s confidence in a claim as a Markov process with successive published results shifting the degree of belief. Publication bias in favor of positive findings influences the distribution of published results. We find that unless a sufficient fraction of negative results are published, false claims frequently can become canonized as fact. Data-dredging, p-hacking, and similar behaviors exacerbate the problem. Should negative results become easier to publish as a claim approaches acceptance as a fact, however, true and false claims would be more readily distinguished. To the degree that the model reflects the real world, there may be serious concerns about the validity of purported facts in some disciplines.
Overview
The claims and statistics of this paper haven’t been checked yet.
Run the check — free, no account needed. It reads the open-access text and checks the sources it cites.
Integrity signals
Registry
Cites
Statistics
Figures
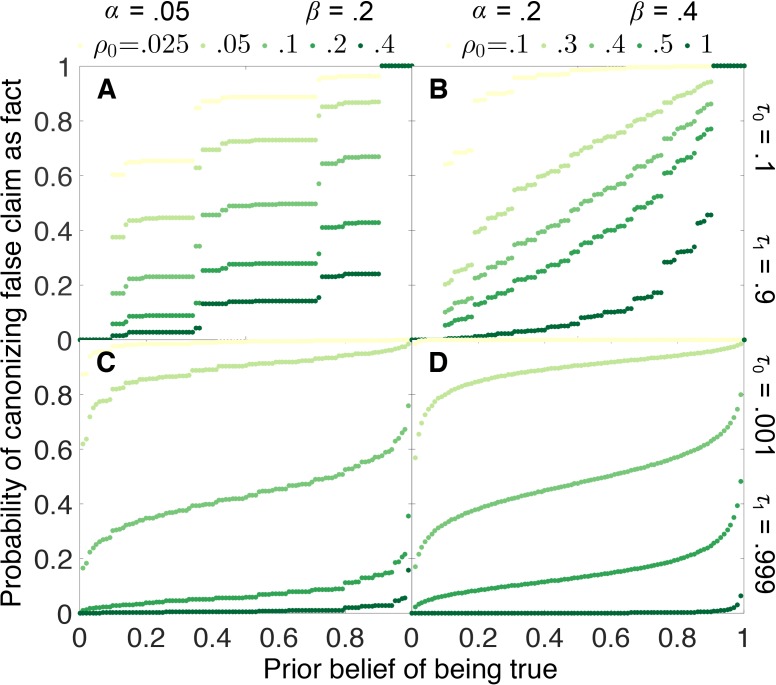
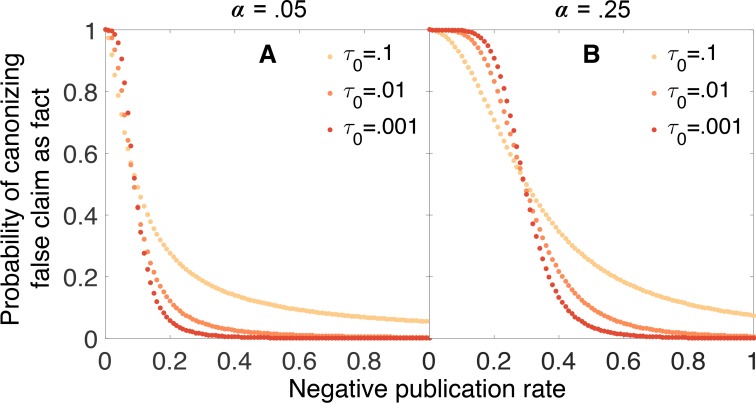
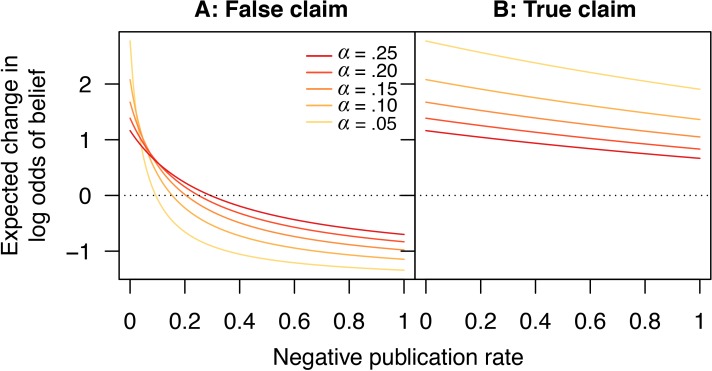
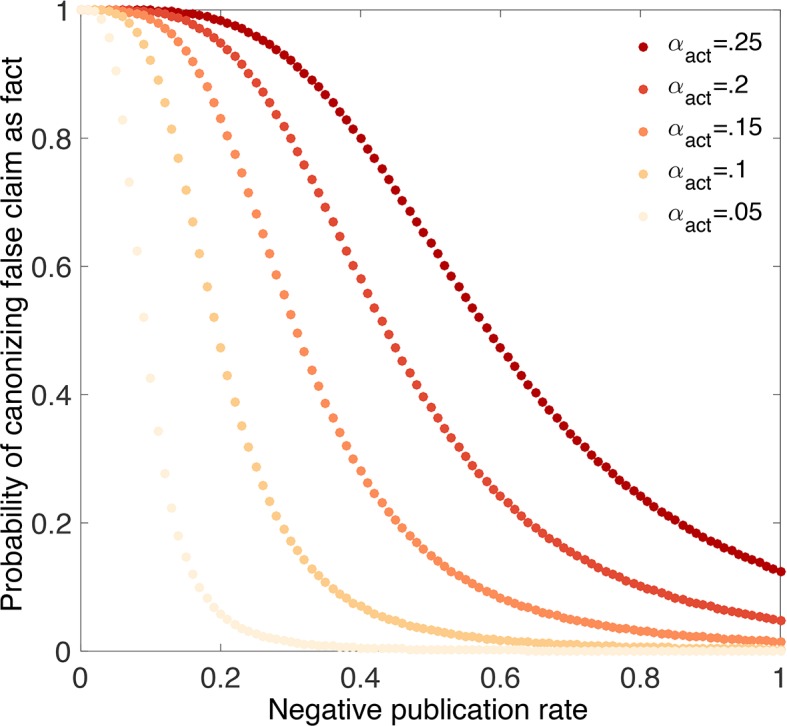
Verification
Claims the paper makes
The claims and statistics of this paper haven’t been checked yet.
Run the check — free, no account needed. It reads the open-access text and checks the sources it cites.
Claims other papers make about this one
Each is checked against this paper’s own text: does it say what the citing paper says it does?
The source backs part of the claim, not all of it — or backs it for a different population, condition or comparison.
In the citing paper
“It can be shown that the”
From Fraudulent studies are undermining the reliability of systematic reviews: on the prevalence of problematic images in preclinical depression studies (2025) · cites this paper as [57]
Experimental — accuracy not yet measuredIn the citing paper
“With negative results buried in file drawers (55), conclusions drawn from the published record can be misleading, and 'false facts' can become canonized in the literature (56).”
From Misinformation in and about science (2021) · cites this paper as [56]
Self-check
Percentages, sums and reported differences re-computed from the paper’s own numbers.
The self-check needs the paper’s full text.
Citations
Cites
(2014) · Climate Change 2013 – The Physical Science Basis · doi:10.1017/cbo9781107415324.004 · Cited by 23,880
Science in Action: How to Follow Scientists and Engineers through Society
Bijker, W. E., & Latour, B. (1988) · Technology and Culture · doi:10.2307/3105094 · Cited by 10,770
Why Most Published Research Findings Are False
Ioannidis, J. P. A. (2005) · PLoS Medicine · doi:10.1371/journal.pmed.0020124 · Cited by 10,505
The file drawer problem and tolerance for null results.
Rosenthal, R. (1979) · Psychological Bulletin · doi:10.1037/0033-2909.86.3.638 · Cited by 9,068
(1987) · Cited by 8,955
Estimating the reproducibility of psychological science
Open Science Collaboration (2015) · Science · doi:10.1126/science.aac4716 · Cited by 8,515
Anderson, N. H. (2001) · Psychology Press eBooks · doi:10.4324/9781410600004-24 · Cited by 6,939
Role for a bidentate ribonuclease in the initiation step of RNA interference
Bernstein, E., Caudy, A. A., Hammond, S. M., & Hannon, G. J. (2001) · Nature · doi:10.1038/35053110 · Cited by 5,018
The Foundations of Statistics.
Good, I. J., & Savage, L. J. (1955) · Journal of the Royal Statistical Society Series A (General) · doi:10.2307/2343133 · Cited by 4,764
Why Most Published Research Findings Are False
Ioannidis, J. P. A. (2005) · CHANCE · doi:10.1080/09332480.2005.10722754 · Cited by 4,702 · cited 3×
“The limited benefits of strengthening evidentiary standards can be understood through the mathematical theory of random walks [30].”
Background
Research works printed but not linked: 1
- Norris, 1998, Markov Chains
Cited by
Sorted by citations
Fortunato, S., Bergstrom, C. T., Börner, K., Evans, J. A., Helbing, D., Milojević, S., Petersen, A. M., Radicchi, F., Sinatra, R., Uzzi, B., et al. (2018) · Science · doi:10.1126/science.aao0185 · Cited by 1,497
Self-citationShi, L., & Lin, L. (2019) · Medicine · doi:10.1097/md.0000000000015987 · Cited by 818
Walter, J., Armet, A. M., Finlay, B. B., & Shanahan, F. (2020) · Cell · doi:10.1016/j.cell.2019.12.025 · Cited by 596
PREPARE: guidelines for planning animal research and testing
Smith, A. J., Clutton, R. E., Lilley, E. J., Hansen, K. E. A., & Brattelid, T. (2017) · Laboratory Animals · doi:10.1177/0023677217724823 · Cited by 620
Dewa, C. S., Loong, D., Bonato, S., & Trojanowski, L. (2017) · BMJ Open · doi:10.1136/bmjopen-2016-015141 · Cited by 546
Misinformation in and about science
West, J. D., & Bergstrom, C. T. (2021) · Proceedings of the National Academy of Sciences · doi:10.1073/pnas.1912444117 · Cited by 391
Self-citationTen common statistical mistakes to watch out for when writing or reviewing a manuscript
Makin, T. R., & Orban de Xivry, J.-J. (2019) · eLife · doi:10.7554/elife.48175 · Cited by 238
An Agenda for Open Science in Communication
Dienlin, T., Johannes, N., Bowman, N. D., Masur, P. K., Engesser, S., Kümpel, A. S., Lukito, J., Bier, L. M., Zhang, R., Johnson, B. K., et al. (2020) · Journal of Communication · doi:10.1093/joc/jqz052 · Cited by 252
The case for formal methodology in scientific reform
Devezer, B., Navarro, D., Vandekerckhove, J., & Buzbas, E. O. (2021) · Royal Society Open Science · doi:10.1098/rsos.200805 · Cited by 204
Reducing bias, increasing transparency and calibrating confidence with preregistration
Hardwicke, T. E., & Wagenmakers, E. (2023) · Nature Human Behaviour · doi:10.1038/s41562-022-01497-2 · Cited by 205
Broström, A., Alimoradi, Z., Lind, J., Ulander, M., Lundin, F., & Pakpour, A. H. (2023) · Journal of Sleep Research · doi:10.1111/jsr.13783 · Cited by 120
Bishop, D. (2019) · Quarterly Journal of Experimental Psychology · doi:10.1177/1747021819886519 · Cited by 115
Devezer, B., Nardin, L. G., Baumgaertner, B. O., & Buzbas, E. O. (2019) · PLoS ONE · doi:10.1371/journal.pone.0216125 · Cited by 113
Open and reproducible neuroimaging: From study inception to publication
Niso, G., Botvinik‐Nezer, R., Appelhoff, S., de la Vega, A. I., Estéban, O., Etzel, J. A., Finc, K., Ganz, M., Gau, R., Halchenko, Y. O., et al. (2022) · NeuroImage · doi:10.1016/j.neuroimage.2022.119623 · Cited by 112
Zvereva, E. L., & Kozlov, M. V. (2021) · Ecology Letters · doi:10.1111/ele.13851 · Cited by 89
Varangot‐Reille, C., Suso‐Martí, L., Romero-Palau, M., Suárez-Pastor, P., & Cuenca‐Martínez, F. (2021) · Journal of Pain · doi:10.1016/j.jpain.2021.12.003 · Cited by 101
Reproducibility in Neuroimaging Analysis: Challenges and Solutions
Botvinik‐Nezer, R., & Wager, T. D. (2022) · Biological Psychiatry Cognitive Neuroscience and Neuroimaging · doi:10.1016/j.bpsc.2022.12.006 · Cited by 95
The impact of sample size on the reproducibility of voxel-based lesion-deficit mappings
Lorca‐Puls, D. L., Gajardo‐Vidal, A., White, J., Seghier, M. L., Leff, A. P., Green, D. W., Crinion, J., Ludersdorfer, P., Hope, T. M. H., Bowman, H., et al. (2018) · Neuropsychologia · doi:10.1016/j.neuropsychologia.2018.03.014 · Cited by 86
Estimation of moral distress among nurses: A systematic review and meta-analysis
Alimoradi, Z., Jafari, E., Lin, C., Rajabi, R., Marznaki, Z. H., Soodmand, M., Potenza, M. N., & Pakpour, A. H. (2023) · Nursing Ethics · doi:10.1177/09697330221135212 · Cited by 97
brainlife.io: a decentralized and open-source cloud platform to support neuroscience research
Hayashi, S., Caron, B. A., Heinsfeld, A. S., Vinci‐Booher, S., McPherson, B., Bullock, D. N., Bertò, G., Niso, G., Hanekamp, S., Levitas, D. J., et al. (2024) · Nature Methods · doi:10.1038/s41592-024-02237-2 · Cited by 84
Abedon, S. T. (2017) · AIMS Microbiology · doi:10.3934/microbiol.2017.2.186 · Cited by 74
Open Science Is Liberating and Can Foster Creativity
Frankenhuis, W. E., & Nettle, D. (2018) · Perspectives on Psychological Science · doi:10.1177/1745691618767878 · Cited by 74
Making ERP research more transparent: Guidelines for preregistration
Paul, M., Govaart, G., & Schettino, A. (2021) · International Journal of Psychophysiology · doi:10.1016/j.ijpsycho.2021.02.016 · Cited by 67
Uniform resolution of compact identifiers for biomedical data
Wimalaratne, S., Juty, N., Kunze, J., Janée, G., McMurry, J. A., Beard, N., Jiménez, R. C., Grethe, J. S., Hermjakob, H., Martone, M. E., et al. (2018) · Scientific Data · doi:10.1038/sdata.2018.29 · Cited by 61
Persistence of false paradigms in low-power sciences
Akerlof, G. A., & Michaillat, P. (2018) · Proceedings of the National Academy of Sciences · doi:10.1073/pnas.1816454115 · Cited by 54
Open science and modified funding lotteries can impede the natural selection of bad science
Smaldino, P. E., Turner, M. A., & Kallens, P. C. (2019) · Royal Society Open Science · doi:10.1098/rsos.190194 · Cited by 55
O'Neill, D. G., Packer, R. M. A., Francis, P., Church, D. B., Brodbelt, D. C., & Pegram, C. (2021) · Canine Medicine and Genetics · doi:10.1186/s40575-021-00112-3 · Cited by 51
Ten simple rules for good research practice
Schwab, S., Janiaud, P., Dayan, M., Amrhein, V., Panczak, R., Palagi, P. M., Hemkens, L. G., Ramon, M., Rothen, N., Senn, S. J., et al. (2022) · PLoS Computational Biology · doi:10.1371/journal.pcbi.1010139 · Cited by 53
Consequences of relying on statistical significance: Some illustrations
CALSTER, B. V., Steyerberg, E. W., Collins, P. G. S., & Smits, T. (2018) · European Journal of Clinical Investigation · doi:10.1111/eci.12912 · Cited by 47
Mazurkiewicz, M., Górska, B., Renaud, P. E., & Włodarska‐Kowalczuk, M. (2020) · Scientific Reports · doi:10.1038/s41598-020-60889-4 · Cited by 44
Questionable research practices may have little effect on replicability
Ulrich, R., & Miller, J. O. (2020) · eLife · doi:10.7554/elife.58237 · Cited by 50
Estimating the Replicability of Sports and Exercise Science Research
Murphy, J., Caldwell, A. R., Mesquida, C., Ladell, A. J. M., Martínez, A. E., Tual, A., Denys, A. T., Cameron, B., Hooren, B. V., Parr, B., et al. (2025) · Sports Medicine · doi:10.1007/s40279-025-02201-w · Cited by 51
(2019) · Nature Human Behaviour · doi:10.1038/s41562-019-0569-7 · Cited by 40
Competition for priority harms the reliability of science, but reforms can help
Tiokhin, L., Yan, M., & Morgan, T. J. H. (2021) · Nature Human Behaviour · doi:10.1038/s41562-020-01040-1 · Cited by 48
The credibility crisis in research: Can economics tools help?
Gall, T., Ioannidis, J. P. A., & Maniadis, Z. (2017) · PLoS Biology · doi:10.1371/journal.pbio.2001846 · Cited by 35
Hanberry, B. B., & Faison, E. K. (2023) · The Science of The Total Environment · doi:10.1016/j.scitotenv.2023.161669 · Cited by 34
The Role of the Three Rs in Improving the Planning and Reproducibility of Animal Experiments
Smith, A. J., & Lilley, E. J. (2019) · Animals · doi:10.3390/ani9110975 · Cited by 35
The natural selection of good science
Stewart, A. J., & Plotkin, J. B. (2021) · Nature Human Behaviour · doi:10.1038/s41562-021-01111-x · Cited by 35
Bioethical, Reproducibility, and Translational Challenges of Animal Models
Landi, M. S., Everitt, J. I., & Berridge, B. R. (2021) · ILAR Journal · doi:10.1093/ilar/ilaa027 · Cited by 37
Paths towards greater consensus building in experimental biology
Roche, D. G., Raby, G. D., Norin, T., Ern, R., Scheuffele, H., Skeeles, M. R., Morgan, R., Andreassen, A. H., Clements, J. C., Louissaint, S., et al. (2022) · Journal of Experimental Biology · doi:10.1242/jeb.243559 · Cited by 35
Prediction of robust scientific facts from literature
Belikov, A. V., Rzhetsky, A., & Evans, J. (2022) · Nature Machine Intelligence · doi:10.1038/s42256-022-00474-8 · Cited by 30
Centralized scientific communities are less likely to generate replicable results
Danchev, V., Rzhetsky, A., & Evans, J. A. (2019) · eLife · doi:10.7554/elife.43094 · Cited by 28
Estimating the reproducibility of social learning research published between 1955 and 2018
Minocher, R., Atmaca, S., Bavero, C., McElreath, R. L., & Beheim, B. (2021) · Royal Society Open Science · doi:10.1098/rsos.210450 · Cited by 44
Smith, E., Lau, W. M., Abdelghany, T. M., Vukajlovic, D., Novakovic, K., & Ng, K. W. (2023) · International Journal of Pharmaceutics · doi:10.1016/j.ijpharm.2023.123706 · Cited by 28
Bialik, O. M., Jarochowska, E., & Grossowicz, M. (2021) · The Depositional Record · doi:10.1002/dep2.161 · Cited by 28
Leviton, A. (2018) · Nutrients · doi:10.3390/nu10091152 · Cited by 27
Which Findings Should Be Published?
Frankel, A. P., & Kasy, M. (2022) · American Economic Journal Microeconomics · doi:10.1257/mic.20190133 · Cited by 30
The illusion of science in comparative cognitionPreprint
Farrar, B. G., & Ostojić, L. (2019) · PsyArXiv (OSF Preprints) · doi:10.31234/osf.io/hduyx · Cited by 28
Wellcome Open ResearchPreprint
Jones, I. M. (2018) · doi:10.17605/osf.io/9crn2 · Cited by 25
The DCDC2 deletion is not a risk factor for dyslexia
Scerri, T. S., Macpherson, E., Martinelli, A. M., Wa, W. C., Monaco, A. P., Stein, J. F., Zheng, M., Ho, C. S., McBride, C. A., Snowling, M. J., et al. (2017) · Translational Psychiatry · doi:10.1038/tp.2017.151 · Cited by 23
Norberg, J., Blenckner, T., Cornell, S., Petchey, O. L., & Hillebrand, H. (2022) · Ecology Letters · doi:10.1111/ele.13984 · Cited by 22
Gardner, P. P., Paterson, J. M., McGimpsey, S., Ghomi, F. A., Umu, S. U., Pawlik, A., Gavryushkin, A., & Black, M. A. (2022) · Genome biology · doi:10.1186/s13059-022-02625-x · Cited by 33
Supervised Classification: Quite a Brief Overview
Loog, M. (2018) · Elsevier eBooks · doi:10.1016/b978-0-12-811788-0.00005-6 · Cited by 28
Dickes, A., Kemmis-Riggs, J., & McAloon, J. (2017) · Clinical Child and Family Psychology Review · doi:10.1007/s10567-017-0248-z · Cited by 23
Evaluation of a meta-analysis of air quality and heart attacks, a case study
Young, S. S., & Kindzierski, W. B. (2019) · Critical Reviews in Toxicology · doi:10.1080/10408444.2019.1576587 · Cited by 27
Publication practice in Taxonomy: Global inequalities and potential bias against negative results
Salvador, R. B., Cavallari, D. C., Rands, D., & Tomotani, B. M. (2022) · PLOS ONE · doi:10.1371/journal.pone.0269246 · Cited by 21
Dewa, C. S., Loong, D., Trujillo, A., & Bonato, S. (2018) · PLoS ONE · doi:10.1371/journal.pone.0199368 · Cited by 27
Steinfath, M., Vogl, S., Violet, N., Schwarz, F., Mielke, H., Selhorst, T., Greiner, M., & Schönfelder, G. (2018) · PLoS ONE · doi:10.1371/journal.pone.0202762 · Cited by 26
Why ex post peer review encourages high-risk research while ex ante review discourages it
Gross, K., & Bergstrom, C. T. (2021) · Proceedings of the National Academy of Sciences · doi:10.1073/pnas.2111615118 · Cited by 25
Self-citationBuhos: A web-based systematic literature review management software
Bustos, C., Malverde, M. ́. M., Salcedo, P., & Mújica, A. D. (2018) · SoftwareX · doi:10.1016/j.softx.2018.10.004 · Cited by 24
Farrar, B. G., Altschul, D., Fischer, J., van der Mescht, J., Placì, S., Troisi, C. A., Vernouillet, A., Clayton, N. S., & Ostojić, L. (2020) · Animal Behavior and Cognition · doi:10.26451/abc.07.03.09.2020 · Cited by 17
Reply to: Methods matter in repeating ocean acidification studies
Clark, T. D., Raby, G. D., Roche, D. G., Binning, S. A., Speers‐Roesch, B., Jutfelt, F., & Sundin, J. (2020) · Nature · doi:10.1038/s41586-020-2804-9 · Cited by 18
Ending publication bias: A values-based approach to surface null and negative results
Curry, S., Mercado-Lara, E., Arechavala‐Gomeza, V., Begley, C. G., Bernard, C., Bernard, R., Bertuzzi, S., Bhalla, N., Bowers, D., Brod, S., et al. (2025) · PLoS Biology · doi:10.1371/journal.pbio.3003368 · Cited by 26
Franco, C. M. C., Carneiro, M. A. S., de Sousa, J. F. R., Gomes, G. K., & Orsatti, F. L. (2019) · The Journal of Strength and Conditioning Research · doi:10.1519/jsc.0000000000003145 · Cited by 21
A graph for every analysis: Mapping visuals onto common analyses using flexplot
Fife, D. A., Longo, G., Correll, M., & Tremoulet, P. D. (2021) · Behavior Research Methods · doi:10.3758/s13428-020-01520-2 · Cited by 17
Theory and methods of the multiverse: an application for panel-based models
Cantone, G. G., & Tomaselli, V. (2023) · Quality & Quantity · doi:10.1007/s11135-023-01698-5 · Cited by 18
Modelling Scientific Communities
O’Connor, C. (2023) · Cambridge University Press eBooks · doi:10.1017/9781009359535 · Cited by 16
Realigning science, society and policy in uncertain times
Mehta, G., Hopf, H., Krief, A., & Matlin, S. A. (2020) · Royal Society Open Science · doi:10.1098/rsos.200554 · Cited by 16
Understanding of researcher behavior is required to improve data reliability
Wass, M. N., Ray, L., & Michaelis, M. (2019) · GigaScience · doi:10.1093/gigascience/giz017 · Cited by 19
Educational fMRI: From the Lab to the Classroom
Seghier, M. L., Fahim, M. A., & Habak, C. (2019) · Frontiers in Psychology · doi:10.3389/fpsyg.2019.02769 · Cited by 22
Dirnagl, U. (2019) · European Journal of Nuclear Medicine and Molecular Imaging · doi:10.1007/s00259-019-04467-5 · Cited by 16
Gardner, P. P., Paterson, J. M., McGimpsey, S., Ghomi, F. A., Umu, S. U., Pawlik, A., Gavryushkin, A., & Black, M. A. (2016) · bioRxiv (Cold Spring Harbor Laboratory) · doi:10.1101/092205 · Cited by 16
U.S. School Finance: Resources and Outcomes
Handel, D., & Hanushek, E. A. (2022) · National Bureau of Economic Research · doi:10.3386/w30769 · Cited by 18
Addressing selective reporting of experiments through predefined exclusion criteria
Neves, K., & Amaral, O. B. (2020) · eLife · doi:10.7554/elife.56626 · Cited by 15
Practical notes on popular statistical tests in renal physiology
Mamenko, M., Lysikova, D. V., Spires, D. R., Tarima, S. S., & Ilatovskaya, D. V. (2022) · American Journal of Physiology-Renal Physiology · doi:10.1152/ajprenal.00427.2021 · Cited by 15
Raiders of the lost HARK: a reproducible inference framework for big data science
Prosperi, M., Bian, J., Buchan, I. E., Koopman, J. S., Sperrin, M., & Wang, M. (2019) · Humanities and Social Sciences Communications · doi:10.1057/s41599-019-0340-8 · Cited by 17
Farrar, B. G., Ostojić, L., & Clayton, N. S. (2021) · PLoS ONE · doi:10.1371/journal.pone.0256607 · Cited by 20
Circumcision, Autonomy and Public Health
Earp, B. D., & Darby, R. J. L. (2017) · Public Health Ethics · doi:10.1093/phe/phx024 · Cited by 17
Masouleh, S. K., Eickhoff, S. B., Balajoo, S. M., Nicolaisen‐Sobesky, E., Thirion, B., & Genon, S. (2022) · Scientific Reports · doi:10.1038/s41598-022-17556-7 · Cited by 19
Psychologists update their beliefs about effect sizes after replication studies
McDiarmid, A. D., Tullett, A. M., Whitt, C. M., Vazire, S., Smaldino, P. E., & Stephens, J. E. (2021) · Nature Human Behaviour · doi:10.1038/s41562-021-01220-7 · Cited by 16
Gardner, P. P., Paterson, J. M., Ghomi, F. A., Umu, S. U., McGimpsey, S., & Pawlik, A. (2016) · Figshare · doi:10.6084/m9.figshare.4299320 · Cited by 14
Open Access, Scholarly Communication, and Open Science in Psychology: An Overview for Researchers
Mullen, L. B. (2024) · SAGE Open · doi:10.1177/21582440231205390 · Cited by 18
How thoughtful experimental design can empower biologists in the omics era
Wagner, M. R., & Kleiner, M. (2025) · Nature Communications · doi:10.1038/s41467-025-62616-x · Cited by 15
Aliferis, C., & Simon, G. (2024) · Health informatics · doi:10.1007/978-3-031-39355-6_12 · Cited by 17
Leipold, S., Oderbolz, C., Greber, M., & Jäncke, L. (2019) · International Journal of Psychophysiology · doi:10.1016/j.ijpsycho.2018.12.016 · Cited by 13
Reproducibility improves exponentially over 63 years of social learning researchPreprint
Minocher, R., Atmaca, S., Bavero, C., McElreath, R. L., & Beheim, B. (2020) · doi:10.31234/osf.io/4nzc7 · Cited by 13
Langenecker, S. A., Crane, N. A., Jenkins, L. M., Phan, K. L., & Klumpp, H. (2018) · Current Behavioral Neuroscience Reports · doi:10.1007/s40473-018-0140-2 · Cited by 11
How to measure interdisciplinary research? A systemic design for the model of measurement
Cantone, G. G. (2024) · Scientometrics · doi:10.1007/s11192-024-05085-1 · Cited by 18
Invasive ant learning is not affected by seven potential neuroactive chemicals
Galante, H., & Czaczkes, T. J. (2023) · Current Zoology · doi:10.1093/cz/zoad001 · Cited by 12
Open and reproducible neuroimaging: from study inception to publicationPreprint
Niso, G., Botvinik‐Nezer, R., Appelhoff, S., de la Vega, A. I., Estéban, O., Etzel, J. A., Finc, K., Ganz, M., Gau, R., Halchenko, Y. O., et al. (2022) · doi:10.31219/osf.io/pu5vb · Cited by 12
Balanced examination of positive publication bias impact
Ramos, M. (2025) · Accountability in Research · doi:10.1080/08989621.2025.2538066 · Cited by 12
Dorsal striatum mediates deliberate decision making, not late‐stage, stimulus–response learning
Hiebert, N. M., Owen, A. M., Seergobin, K. N., & MacDonald, P. A. (2017) · Human Brain Mapping · doi:10.1002/hbm.23817 · Cited by 11
The clitoral activation paradox — Claimed outcomes from different methods of its stimulation
Levin, R. J. (2018) · Clinical Anatomy · doi:10.1002/ca.23192 · Cited by 10
Competition for novelty reduces information sampling in a research game - a registered report
Tiokhin, L., & Derex, M. (2019) · Royal Society Open Science · doi:10.1098/rsos.180934 · Cited by 11
Five Models of Science, Illustrating How Selection Shapes Methods
Smaldino, P. E. (2022) · University of Pittsburgh Press eBooks · doi:10.2307/j.ctv31djr2f.5 · Cited by 9
Uniform resolution of compact identifiers for biomedical dataPreprint
Wimalaratne, S., Juty, N., Kunze, J., Janée, G., McMurry, J. A., Beard, N., Jiménez, R. C., Grethe, J. S., Hermjakob, H., Martone, M. E., et al. (2017) · bioRxiv (Cold Spring Harbor Laboratory) · doi:10.1101/101279 · Cited by 10
US school finance: Resources and outcomes
Handel, D., & Hanushek, E. A. (2023) · Handbook of the economics of education · doi:10.1016/bs.hesedu.2023.03.003 · Cited by 12
Beyond the null: Recognizing and reporting true negative findings
Schweinfurth, M. K., & Frommen, J. G. (2024) · iScience · doi:10.1016/j.isci.2024.111676 · Cited by 11
Simplicity of Physical Laws: Informational-Theoretical Limits
Menin, B. M. (2022) · IEEE Access · doi:10.1109/access.2022.3177274 · Cited by 9
A Meta-analysis on the Effectiveness of Offsetting Strategies to Address Harm to Freshwater Fishes
Theis, S., Koops, M. A., & Poesch, M. S. (2022) · Environmental Management · doi:10.1007/s00267-022-01703-x · Cited by 9
Metadata
- Authors
- Nissen, S. B., Magidson, T., Gross, K., & Bergstrom, C. T.
- Affiliations
- University of Copenhagen (DK)
- Corresponding author
- Gross, Kevin
- Bergstrom, Carl T
- Venue
- eLife
- Publisher
- eLife Sciences Publications, Ltd
- Published
- 2016-12-20
- Volume
- 5
- ISSN
- 2050-084X (ISSN-L)
- PMC
- PMC5173326
- OpenAlex
- W2515380863
- Cited by
- 266
- References
- 64
- Citations by year
- 2026: 12 · 2025: 42 · 2024: 26 · 2023: 30 · 2022: 32 · 2021: 28 · 2020: 27 · 2019: 21 · 2018: 25 · 2017: 14 · 2016: 8
- FWCI
- 42.86
- Type
- journal article
- Language
- en
- Open access
- gold
- doi.org
- Licence
- Locations
- eLife (publishedVersion, cc-by)
- PubMed Central (publishedVersion, cc-by)
- PubMed (publishedVersion)
- Research at the University of Copenhagen (University of Copenhagen) (publishedVersion, cc-by)
- arXiv (Cornell University) (submittedVersion)
- DOAJ (DOAJ: Directory of Open Access Journals) (submittedVersion, cc-by-sa)
- arXiv (Cornell University)
- Funders
- John Templeton Foundation
- Danish National Research Foundation
- Topics
- Social Sciences › Library and Information Sciences › Academic Publishing and Open Access
- Social Sciences › Library and Information Sciences › scientometrics and bibliometrics research
- Social Sciences › Decision Sciences › Statistics, Probability and Uncertainty › Meta-analysis and systematic reviews
- Keywords
- publication bias, replication crisis, false claims, scientific credibility, Markov model, belief updating, negative results, p-hacking, false positives
- MeSH terms
- Humans, Publication Bias, Biomedical Research
About these checks
Registry, retraction, Cites and statistics results are computed, not judged, with one exception: a printed reference that no index lists is read once by a model before it counts as a citation error. Claims are extracted by a model and kept only when their quote appears verbatim in the text; each cited source is then checked, with a model’s help, for whether it says what the claim relies on. Those verdicts can be wrong — read the claim’s quote and the cited source before relying on one.
Statistics and arithmetic are recomputed, not judged.
Confidence bands are shown only for fields calibrated on our annotated test set. None is calibrated yet, so no band is shown.
What counts as a claim ›How we measure confidence ›How we check this ›
Are you an author, or do you see a problem with this page? Request a review
