Cited by 62

The DOI matches its Crossref record; 9 of the 9 references it cites were found in a registry or an index.

SynEM, automated synapse detection for connectomics

Staffler, Benedikt, Berning, Manuel, Boergens, Kevin M, Gour, Anjali, Smagt, Patrick van der, Helmstaedter, Moritz·2017·eLife

Published version of a preprint

Abstract

Nerve tissue contains a high density of chemical synapses, about 1 per µm3 in the mammalian cerebral cortex. Thus, even for small blocks of nerve tissue, dense connectomic mapping requires the identification of millions to billions of synapses. While the focus of connectomic data analysis has been on neurite reconstruction, synapse detection becomes limiting when datasets grow in size and dense mapping is required. Here, we report SynEM, a method for automated detection of synapses from conventionally en-bloc stained 3D electron microscopy image stacks. The approach is based on a segmentation of the image data and focuses on classifying borders between neuronal processes as synaptic or non-synaptic. SynEM yields 97% precision and recall in binary cortical connectomes with no user interaction. It scales to large volumes of cortical neuropil, plausibly even whole-brain datasets. SynEM removes the burden of manual synapse annotation for large densely mapped connectomes.

Overview

The claims and statistics of this paper haven’t been checked yet.

Run the check — free, no account needed. It reads the open-access text and checks the sources it cites.

A few free checks a day · papers already verified open instantly · results are public

Integrity signals

Registry

Crossref · 10.7554/elife.26414

Cites

9 of 9 references verified0 citation errors · 0 not checkable

Statistics

Figures

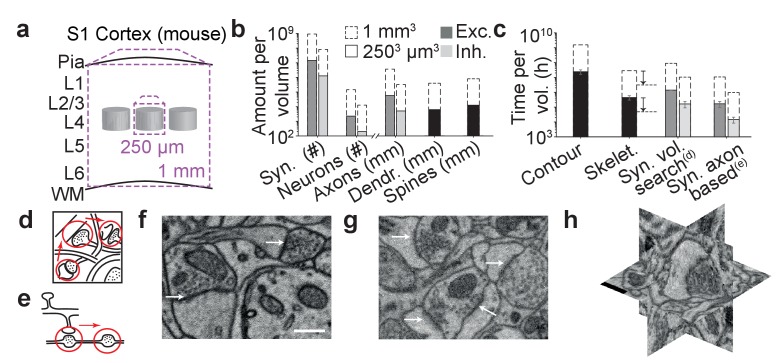
Figure 1. The challenge of synapse detection in connectomics. (a) Sketch of mouse primary somatosensory cortex (S1) with circuit modules (‘barrels’) in cortical layer 4 and minimum required dataset extent for a ‘barrel’ dataset (250 µm edgelength) and a dataset extending over the whole cortical depth from pia to white matter (WM) (1 mm edge length). (b) Number of synapses and neurons, total axonal, dendritic and spine path length for the example datasets in (a) (White and Peters, 1993; Braitenberg and Schüz, 1998; Merchán-Pérez et al., 2014). (c) Reconstruction time estimates for neurites and synapses; For synapse search strategies see sketches in d,e. Dashed arrows: latest skeletonization tools (webKnossos, Boergens et al., 2017) allow for a further speed up of neurite skeletonization by about 5-to-10-fold, leaving synapse detection as the main annotation bottleneck. (d) Volume search for synapses by visually investigating 3d image stacks and keeping track of already inspected locations takes about 0.1 h/µm3. (e) Axon-based synapse detection by following axonal processes and detecting synapses at boutons consumes about 1 min per bouton. (f) Examples of synapses imaged at an in-plane voxel size of 6 nm and (g) 12 nm in conventionally en-bloc stained and fixated tissue (Briggman et al., 2011; Hua et al., 2015) imaged using SBEM (Denk and Horstmann, 2004). Arrows: synapse locations. Note that synapse detection in high-resolution data is much facilitated in the plane of imaging. Large-volume image acquisition is operated at lower resolution, requiring better synapse detection algorithms. (h) Synapse shown in 3D EM raw data, resliced in the 3 orthogonal planes. Scale bars in f and h, 500 nm. Scale bar in f applies to g. DOI: http://dx.doi.org/10.7554/eLife.26414.003
Figure 1. The challenge of synapse detection in connectomics. (a) Sketch of mouse primary somatosensory cortex (S1) with circuit modules (‘barrels’) in cortical layer 4 and minimum required dataset extent for a ‘barrel’ dataset (250 µm edgelength) and a dataset extending over the whole cortical depth from pia to white matter (WM) (1 mm edge length). (b) Number of synapses and neurons, total axonal, dendritic and spine path length for the example datasets in (a) (White and Peters, 1993; Braitenberg and Schüz, 1998; Merchán-Pérez et al., 2014). (c) Reconstruction time estimates for neurites and synapses; For synapse search strategies see sketches in d,e. Dashed arrows: latest skeletonization tools (webKnossos, Boergens et al., 2017) allow for a further speed up of neurite skeletonization by about 5-to-10-fold, leaving synapse detection as the main annotation bottleneck. (d) Volume search for synapses by visually investigating 3d image stacks and keeping track of already inspected locations takes about 0.1 h/µm3. (e) Axon-based synapse detection by following axonal processes and detecting synapses at boutons consumes about 1 min per bouton. (f) Examples of synapses imaged at an in-plane voxel size of 6 nm and (g) 12 nm in conventionally en-bloc stained and fixated tissue (Briggman et al., 2011; Hua et al., 2015) imaged using SBEM (Denk and Horstmann, 2004). Arrows: synapse locations. Note that synapse detection in high-resolution data is much facilitated in the plane of imaging. Large-volume image acquisition is operated at lower resolution, requiring better synapse detection algorithms. (h) Synapse shown in 3D EM raw data, resliced in the 3 orthogonal planes. Scale bars in f and h, 500 nm. Scale bar in f applies to g. DOI: http://dx.doi.org/10.7554/eLife.26414.003CC BY · PubMed Central
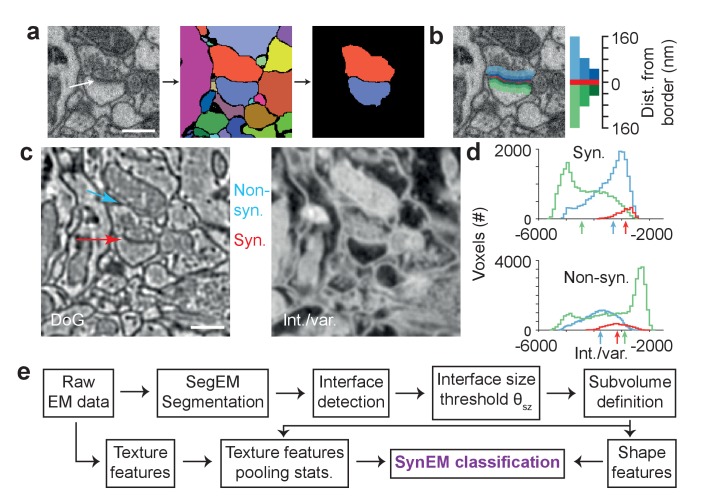
Figure 2. Synapse detection by classification of neurite interfaces. (a) Definition of interfaces used for synapse classification in SynEM. Raw EM data (left) is first volume segmented (using SegEM, Berning et al., 2015). Neighboring volume segments are identified (right). (b) Definition of perisynaptic subvolumes used for synapse classification in SynEM consisting of a border (red) and subvolumes adjacent to the neurite interface extending to distances of 40, 80 and 160 nm. (c) Example outputs of two texture filters: the difference of Gaussians (DoG) and the intensity/variance filter (int./var.). Note the clear signature of postsynaptic spine heads (right). (d) Distributions of int/var. texture filter output for image voxels at a synaptic (top) and non-synaptic interface (bottom). Medians over subvolumes are indicated (arrows, color scale as in b). (e) SynEM flow chart. Scale bars, 500 nm. Scale bar in a applies to a,b. DOI: http://dx.doi.org/10.7554/eLife.26414.005
Figure 2. Synapse detection by classification of neurite interfaces. (a) Definition of interfaces used for synapse classification in SynEM. Raw EM data (left) is first volume segmented (using SegEM, Berning et al., 2015). Neighboring volume segments are identified (right). (b) Definition of perisynaptic subvolumes used for synapse classification in SynEM consisting of a border (red) and subvolumes adjacent to the neurite interface extending to distances of 40, 80 and 160 nm. (c) Example outputs of two texture filters: the difference of Gaussians (DoG) and the intensity/variance filter (int./var.). Note the clear signature of postsynaptic spine heads (right). (d) Distributions of int/var. texture filter output for image voxels at a synaptic (top) and non-synaptic interface (bottom). Medians over subvolumes are indicated (arrows, color scale as in b). (e) SynEM flow chart. Scale bars, 500 nm. Scale bar in a applies to a,b. DOI: http://dx.doi.org/10.7554/eLife.26414.005CC BY · PubMed Central
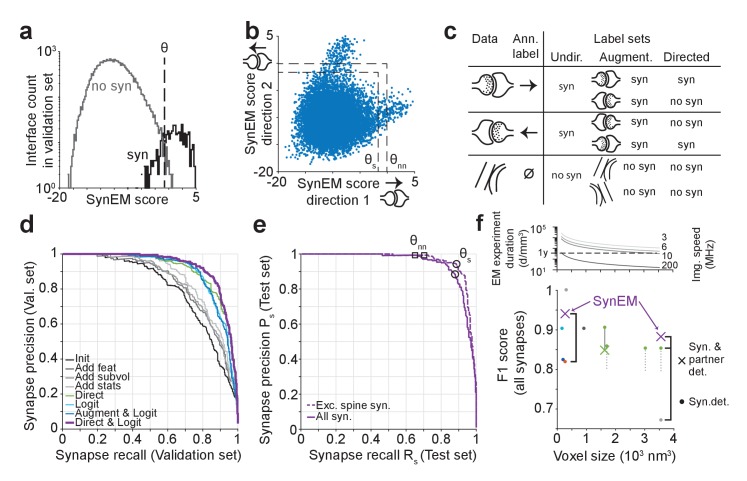
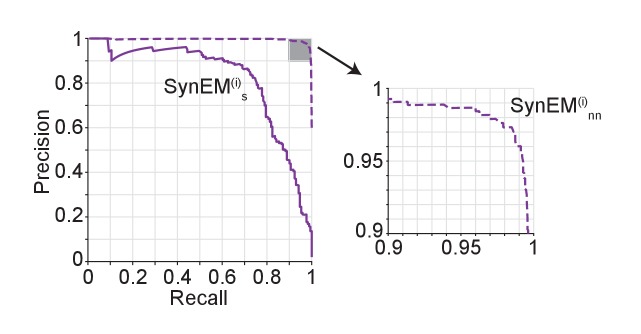
Figure 3. SynEM training and evaluation. (a) Histogram of SynEM scores calculated on the validation set. Fully automated synapse detection is obtained by thresholding the SynEM score at threshold θ. (b) SynEM scores for the two possible directions of interfaces. Note that SynEM scores are disjunct in a threshold regime used for best single synapse performance (θs) and best neuron-to-neuron recall and precision (θnn), see Figure 5, indicating a clear bias towards one of the two possible synaptic directions. (c) Strategy for label generation. Based on annotator labels (Ann. Label), three types of label sets were generated: Initial label set ignored interface orientation (Undir.); Augmented label set included mirror-reflected interfaces (Augment.); Directed label set used augmented data but considered only one synaptic direction as synaptic (Directed, see also Figure 3—figure supplement 1). (d) Development of the SynEM classifier. Classification performance for different features, aggregation statistics, classifier parameters and label sets. Init: initial classifier used (see Table 1). The initial classifier was extended by using additional features (Add feat, see Table 1, first row), 40 and 80 nm subvolumes for feature aggregation (Add subvol, see Figure 2b) and aggregate statistics (Add stats, see Table 1). Direct: Classifier trained on directed label set (see Figure 3c). Logit: Classifier trained on full feature space using LogitBoost. Augment and Logit: Logit classifier trained on augmented label set (see Figure 3c). Direct and Logit: Logit classifier trained on directed label set (see Figure 3c). (e) Test set performance on 3D SBEM data of SynEM (purple) evaluated for spine and shaft synapses (all synapses, solid line) and for spine synapses (exc. synapses, dashed line), only. Threshold values for optimal single synapse detection performance (black circle) and an optimal connectome reconstruction performance (black square, see Figure 5). (see also Figure 3—figure supplement 2) (f) Relation between 3D EM imaging resolution, imaging speed and 3D EM experiment duration (top), exemplified for a dataset sized 1 mm3. Note that the feasibility of experiments strongly depends on the chosen voxel size. Bottom: published synapse detection performance (reported as F1 score) in dependence of the respective imaging resolution (see also Supplementary file 1). dark blue, Mishchenko et al. (2010); cyan, Kreshuk et al. (2011); light gray, Becker et al. (2012); dark gray, Kreshuk et al. (2014); red, Roncal et al. (2015); green, Dorkenwald et al. (2017); Black brackets indicate direct comparison of SynEM to top-performing methods: SynEM vs Roncal et al. (2015) on ATUM-SEM dataset (Kasthuri et al., 2015); SynEM vs Dorkenwald et al. (2017) and Becker et al. (2012) on our test set. See Figure 3—figure supplement 3 for comparison of Precision-Recall curves. Note that SynEM outperforms the previously top-performing methods. Note also that most methods provide synapse detection, but require the detection of synaptic partners and synapse direction in a separate classification step. Gray solid line: drop of partner detection performance compared to synapse detection in Dorkenwald et al. (2017); dashed gray lines, analogous possible range of performance drop as reported for bird dataset in Dorkenwald et al. (2017). SynEM combines synapse detection and partner detection into one classification step. DOI: http://dx.doi.org/10.7554/eLife.26414.008
Figure 3. SynEM training and evaluation. (a) Histogram of SynEM scores calculated on the validation set. Fully automated synapse detection is obtained by thresholding the SynEM score at threshold θ. (b) SynEM scores for the two possible directions of interfaces. Note that SynEM scores are disjunct in a threshold regime used for best single synapse performance (θs) and best neuron-to-neuron recall and precision (θnn), see Figure 5, indicating a clear bias towards one of the two possible synaptic directions. (c) Strategy for label generation. Based on annotator labels (Ann. Label), three types of label sets were generated: Initial label set ignored interface orientation (Undir.); Augmented label set included mirror-reflected interfaces (Augment.); Directed label set used augmented data but considered only one synaptic direction as synaptic (Directed, see also Figure 3—figure supplement 1). (d) Development of the SynEM classifier. Classification performance for different features, aggregation statistics, classifier parameters and label sets. Init: initial classifier used (see Table 1). The initial classifier was extended by using additional features (Add feat, see Table 1, first row), 40 and 80 nm subvolumes for feature aggregation (Add subvol, see Figure 2b) and aggregate statistics (Add stats, see Table 1). Direct: Classifier trained on directed label set (see Figure 3c). Logit: Classifier trained on full feature space using LogitBoost. Augment and Logit: Logit classifier trained on augmented label set (see Figure 3c). Direct and Logit: Logit classifier trained on directed label set (see Figure 3c). (e) Test set performance on 3D SBEM data of SynEM (purple) evaluated for spine and shaft synapses (all synapses, solid line) and for spine synapses (exc. synapses, dashed line), only. Threshold values for optimal single synapse detection performance (black circle) and an optimal connectome reconstruction performance (black square, see Figure 5). (see also Figure 3—figure supplement 2) (f) Relation between 3D EM imaging resolution, imaging speed and 3D EM experiment duration (top), exemplified for a dataset sized 1 mm3. Note that the feasibility of experiments strongly depends on the chosen voxel size. Bottom: published synapse detection performance (reported as F1 score) in dependence of the respective imaging resolution (see also Supplementary file 1). dark blue, Mishchenko et al. (2010); cyan, Kreshuk et al. (2011); light gray, Becker et al. (2012); dark gray, Kreshuk et al. (2014); red, Roncal et al. (2015); green, Dorkenwald et al. (2017); Black brackets indicate direct comparison of SynEM to top-performing methods: SynEM vs Roncal et al. (2015) on ATUM-SEM dataset (Kasthuri et al., 2015); SynEM vs Dorkenwald et al. (2017) and Becker et al. (2012) on our test set. See Figure 3—figure supplement 3 for comparison of Precision-Recall curves. Note that SynEM outperforms the previously top-performing methods. Note also that most methods provide synapse detection, but require the detection of synaptic partners and synapse direction in a separate classification step. Gray solid line: drop of partner detection performance compared to synapse detection in Dorkenwald et al. (2017); dashed gray lines, analogous possible range of performance drop as reported for bird dataset in Dorkenwald et al. (2017). SynEM combines synapse detection and partner detection into one classification step. DOI: http://dx.doi.org/10.7554/eLife.26414.008CC BY · PubMed Central
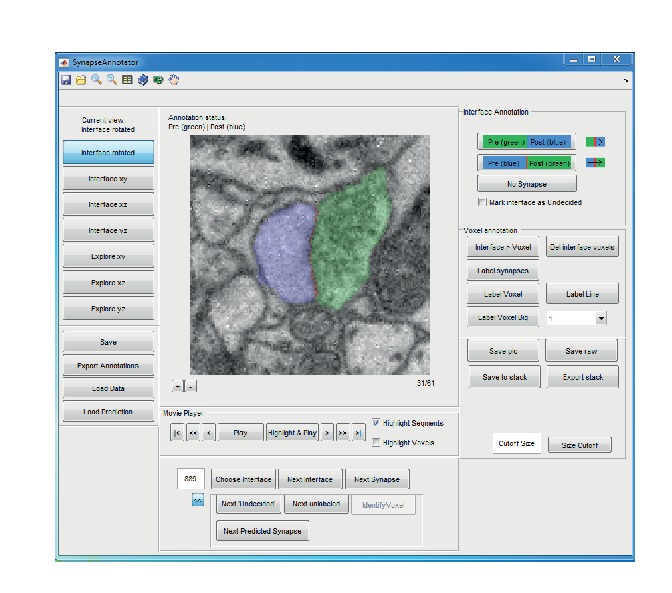
Figure 3—figure supplement 1. Graphical user interface (implemented in MATLAB) for efficient annotation of neurite interfaces as used for generating the training and validation labels. 3D image data are centered to the neurite interface and rotated such that the second and third principal components of the neurite interface span the displayed image plane. Segments are indicated by transparent overlay (interface, red; subsegment S1, blue and S2, green). Note that the test labels were independently annotated by volume search by multiple experts in webKnossos (Boergens et al., 2017), see Materials and methods. DOI: http://dx.doi.org/10.7554/eLife.26414.010
Figure 3—figure supplement 1. Graphical user interface (implemented in MATLAB) for efficient annotation of neurite interfaces as used for generating the training and validation labels. 3D image data are centered to the neurite interface and rotated such that the second and third principal components of the neurite interface span the displayed image plane. Segments are indicated by transparent overlay (interface, red; subsegment S1, blue and S2, green). Note that the test labels were independently annotated by volume search by multiple experts in webKnossos (Boergens et al., 2017), see Materials and methods. DOI: http://dx.doi.org/10.7554/eLife.26414.010CC BY · PubMed Central
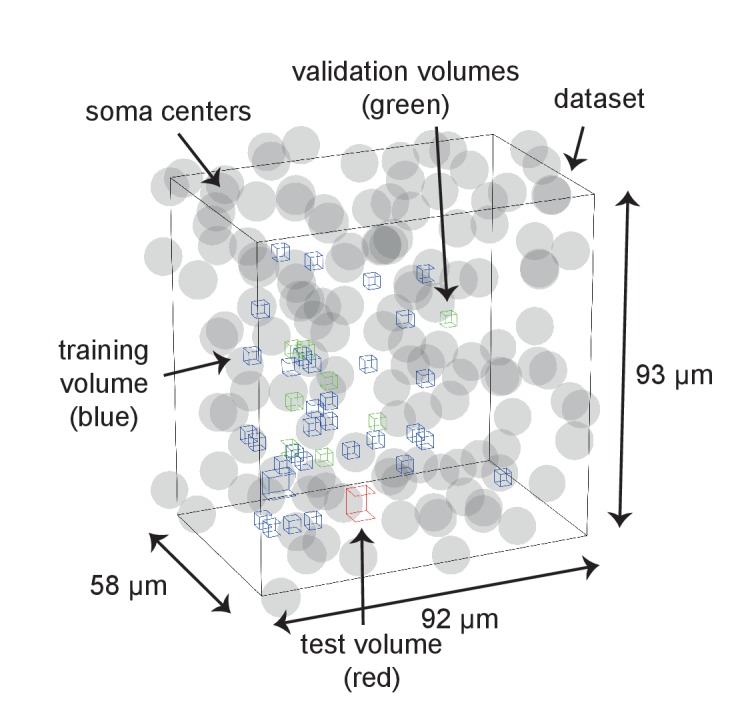
Figure 3—figure supplement 2. Distribution of training, validation and test data volumes within the dataset 2012-09-28_ex145_07x2. Soma locations are indicated by spheres of radius 5 μm. DOI: http://dx.doi.org/10.7554/eLife.26414.011
Figure 3—figure supplement 2. Distribution of training, validation and test data volumes within the dataset 2012-09-28_ex145_07x2. Soma locations are indicated by spheres of radius 5 μm. DOI: http://dx.doi.org/10.7554/eLife.26414.011CC BY · PubMed Central
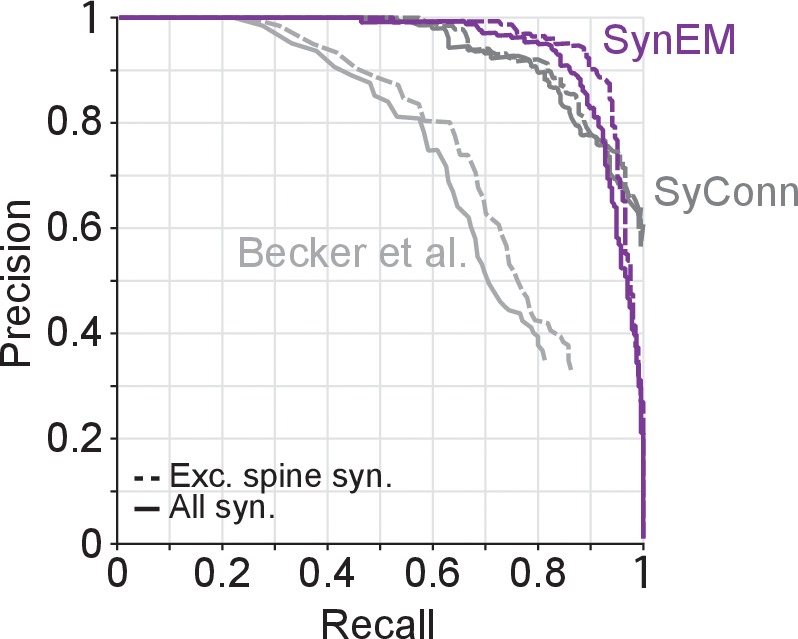
Figure 3—figure supplement 3. Synapse detection performance comparison of SynEM with SyConn (Dorkenwald et al., 2017) and (Becker et al., 2012) on the 3D SBEM SynEM test set (Figure 3e). Note that while SynEM performs synapse detection and partner detection in one step these are separate steps in SyConn with an overall performance that is potentially different from the synapse detection step (in Dorkenwald et al., 2017, a reduction in performance by 9% in recall and 2% in precision from synapse detection to partner detection is reported, yielding a drop in F1 score of 0.057). Becker et al. (2012), does not contain a dedicated partner detection step. DOI: http://dx.doi.org/10.7554/eLife.26414.012
Figure 3—figure supplement 3. Synapse detection performance comparison of SynEM with SyConn (Dorkenwald et al., 2017) and (Becker et al., 2012) on the 3D SBEM SynEM test set (Figure 3e). Note that while SynEM performs synapse detection and partner detection in one step these are separate steps in SyConn with an overall performance that is potentially different from the synapse detection step (in Dorkenwald et al., 2017, a reduction in performance by 9% in recall and 2% in precision from synapse detection to partner detection is reported, yielding a drop in F1 score of 0.057). Becker et al. (2012), does not contain a dedicated partner detection step. DOI: http://dx.doi.org/10.7554/eLife.26414.012CC BY · PubMed Central
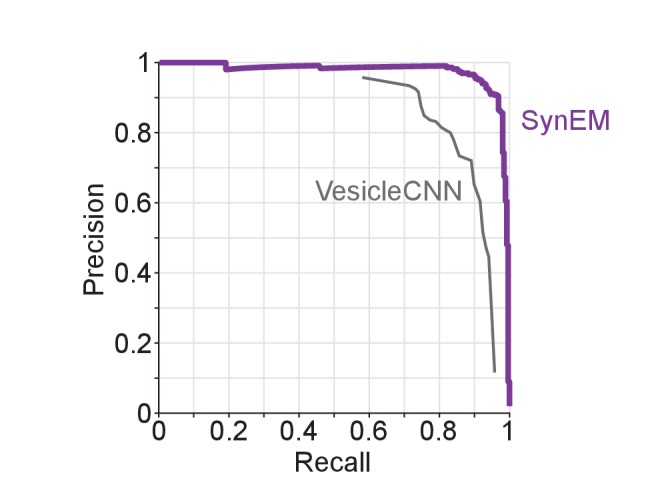
Figure 3—figure supplement 4. Synapse detection performance comparison of SynEM with VesicleCNN (Roncal et al., 2015) on a 3D EM dataset from mouse S1 cortex obtained using ATUM-SEM (Kasthuri et al., 2015). Note that VesicleCNN was developed on that ATUM-SEM dataset. DOI: http://dx.doi.org/10.7554/eLife.26414.014
Figure 3—figure supplement 4. Synapse detection performance comparison of SynEM with VesicleCNN (Roncal et al., 2015) on a 3D EM dataset from mouse S1 cortex obtained using ATUM-SEM (Kasthuri et al., 2015). Note that VesicleCNN was developed on that ATUM-SEM dataset. DOI: http://dx.doi.org/10.7554/eLife.26414.014CC BY · PubMed Central
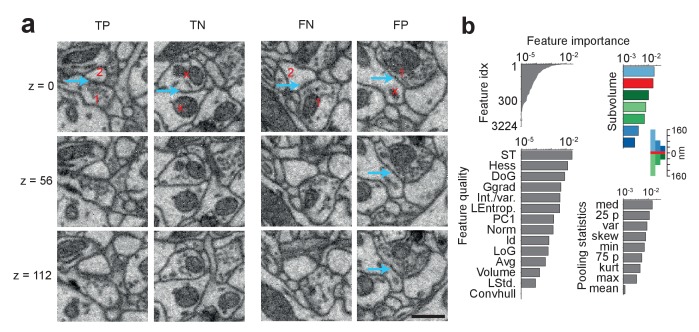
Figure 4. SynEM classification and feature importance. (a) SynEM classification examples at θs (circle in Figure 3e). True positive (TP), true negative (TN), false negative (FN) and false positive (FP) interface classifications (blue arrow, classified interface) shown as 3 image planes spaced by 56 nm (i.e. every second SBEM data slice, top to bottom). Note that synapse detection in 3D SBEM data requires inspection of typically 10–20 consecutive image slices (see Synapse Gallery in Supplementary file 4 for examples). 1: presynaptic; 2: postsynaptic; x: non-synaptic. Note for the FP example that the axonal bouton (1) innervates a neighboring spine head, but the interface to the neurite under classification (x) is non-synaptic (blue arrow). (b) Ranked classification importance of SynEM features. All features (top left), relevance of feature quality (bottom left), subvolumes (top right) and pooling statistics (bottom right). Note that only 378 features contribute to classification. See Table 2 for the 10 feature instances of highest importance, Table 1 for feature name abbreviations, and text for details. Scale bars, 500 nm. DOI: http://dx.doi.org/10.7554/eLife.26414.016
Figure 4. SynEM classification and feature importance. (a) SynEM classification examples at θs (circle in Figure 3e). True positive (TP), true negative (TN), false negative (FN) and false positive (FP) interface classifications (blue arrow, classified interface) shown as 3 image planes spaced by 56 nm (i.e. every second SBEM data slice, top to bottom). Note that synapse detection in 3D SBEM data requires inspection of typically 10–20 consecutive image slices (see Synapse Gallery in Supplementary file 4 for examples). 1: presynaptic; 2: postsynaptic; x: non-synaptic. Note for the FP example that the axonal bouton (1) innervates a neighboring spine head, but the interface to the neurite under classification (x) is non-synaptic (blue arrow). (b) Ranked classification importance of SynEM features. All features (top left), relevance of feature quality (bottom left), subvolumes (top right) and pooling statistics (bottom right). Note that only 378 features contribute to classification. See Table 2 for the 10 feature instances of highest importance, Table 1 for feature name abbreviations, and text for details. Scale bars, 500 nm. DOI: http://dx.doi.org/10.7554/eLife.26414.016CC BY · PubMed Central
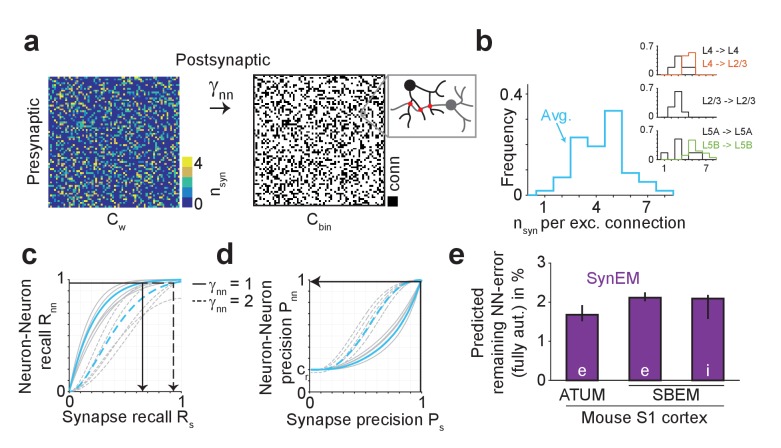
Figure 5. Effect of SynEM classification performance on error rates in automatically mapped binary connectomes. (a) Sketch of a weighted connectome (left) reporting the number of synapses per neuron-to-neuron connection, transformed into a binary connectome (middle) by considering neuron pairs with at least γnn synapses as connected. (b) Distribution of reported synapse number for connected excitatory neuron pairs obtained from paired recordings in rodent cerebral cortex (Feldmeyer et al., 1999, 2002, 2006; Frick et al., 2008; Markram et al., 1997). Average distribution (cyan) is used for the precision estimates in the following (see Supplementary file 2). (c) Relationship between SynEM recall for single interfaces (synapses) Rs and the ensuing neuron-to-neuron connectome recall Rnn (recall in Cbin, a) for each of the excitatory cortico-cortical connections (summarized in b) and for connectome binarization thresholds of γnn = 1 and γnn = 2 (full and dashed, respectively). (d) Relationship between SynEM precision for single interfaces (synapses) Ps and the ensuing neuron-to-neuron connectome precision Pnn. Colors as in c. (for inhibitory synapses see also Figure 5—figure supplement 1) (e) Predicted remaining error in the binary connectome (reported as 1-F1 score for neuron-to-neuron connections) for fully automated synapse classification using SynEM on 3D EM data from mouse cortex using two different imaging modalities: ATUM-SEM (left, Kasthuri et al., 2015) and our data using SBEM (right). e,i: excitatory or inhibitory connectivity model (see b and Materials and methods) shown for cre = 20% and cri = 60%. Black lines indicate range for varying assumptions of pairwise connectivity rate cre = (5%, 10%, 30%) (excitatory) and cri = (20%, 40%, 80%) (inhibitory). Note that SynEM yields a remaining error of close to or less than 2%, well below expected biological wiring noise, allowing for fully automated synapse detection in large-scale binary connectomes. See Suppl. Figure 5—figure supplement 2 for comparison to previous synapse detection methods. DOI: http://dx.doi.org/10.7554/eLife.26414.019
Figure 5. Effect of SynEM classification performance on error rates in automatically mapped binary connectomes. (a) Sketch of a weighted connectome (left) reporting the number of synapses per neuron-to-neuron connection, transformed into a binary connectome (middle) by considering neuron pairs with at least γnn synapses as connected. (b) Distribution of reported synapse number for connected excitatory neuron pairs obtained from paired recordings in rodent cerebral cortex (Feldmeyer et al., 1999, 2002, 2006; Frick et al., 2008; Markram et al., 1997). Average distribution (cyan) is used for the precision estimates in the following (see Supplementary file 2). (c) Relationship between SynEM recall for single interfaces (synapses) Rs and the ensuing neuron-to-neuron connectome recall Rnn (recall in Cbin, a) for each of the excitatory cortico-cortical connections (summarized in b) and for connectome binarization thresholds of γnn = 1 and γnn = 2 (full and dashed, respectively). (d) Relationship between SynEM precision for single interfaces (synapses) Ps and the ensuing neuron-to-neuron connectome precision Pnn. Colors as in c. (for inhibitory synapses see also Figure 5—figure supplement 1) (e) Predicted remaining error in the binary connectome (reported as 1-F1 score for neuron-to-neuron connections) for fully automated synapse classification using SynEM on 3D EM data from mouse cortex using two different imaging modalities: ATUM-SEM (left, Kasthuri et al., 2015) and our data using SBEM (right). e,i: excitatory or inhibitory connectivity model (see b and Materials and methods) shown for cre = 20% and cri = 60%. Black lines indicate range for varying assumptions of pairwise connectivity rate cre = (5%, 10%, 30%) (excitatory) and cri = (20%, 40%, 80%) (inhibitory). Note that SynEM yields a remaining error of close to or less than 2%, well below expected biological wiring noise, allowing for fully automated synapse detection in large-scale binary connectomes. See Suppl. Figure 5—figure supplement 2 for comparison to previous synapse detection methods. DOI: http://dx.doi.org/10.7554/eLife.26414.019CC BY · PubMed Central
Figure 5—figure supplement 1. Performance of SynEM on a test set containing all interfaces between 3 inhibitory axons and all touching neurites (total of 9430 interfaces, 171 synapses). Single synapse detection precision and recall (solid line) and the ensuing predicted neuron-to-neuron precision and recall for inhibitory connections (dashed line) assuming on average 6 synapses for connections from interneurons (see Materials and methods). DOI: http://dx.doi.org/10.7554/eLife.26414.021
Figure 5—figure supplement 1. Performance of SynEM on a test set containing all interfaces between 3 inhibitory axons and all touching neurites (total of 9430 interfaces, 171 synapses). Single synapse detection precision and recall (solid line) and the ensuing predicted neuron-to-neuron precision and recall for inhibitory connections (dashed line) assuming on average 6 synapses for connections from interneurons (see Materials and methods). DOI: http://dx.doi.org/10.7554/eLife.26414.021CC BY · PubMed Central
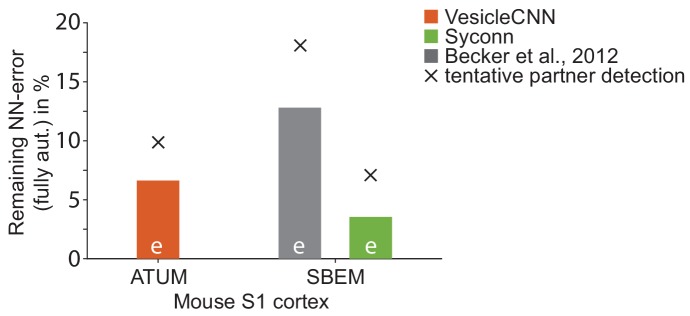
Figure 5—figure supplement 2. Effect of synapse detection errors on predicted connectome error rates for competing methods. Predicted neuron-to-neuron errors (reported as (1 F1 score) in percent) for the ATUM-SEM dataset (Kasthuri et al., 2015) using VesicleCNN (Roncal et al., 2015, orange) and for our SBEM dataset using Becker et al. (2012) (gray) and Syconn (Dorkenwald et al., 2017, green). Note that these approaches provide synapse detection, only. When including the detection of the synaptic partners, Dorkenwald et al. (2017) reported a drop of detection performance by 2% precision and 9% recall (indicated by crosses, tentatively also for the other approaches). SynEM provides synapse detection and partner detection together (compare to Figure 5e). DOI: http://dx.doi.org/10.7554/eLife.26414.023
Figure 5—figure supplement 2. Effect of synapse detection errors on predicted connectome error rates for competing methods. Predicted neuron-to-neuron errors (reported as (1 F1 score) in percent) for the ATUM-SEM dataset (Kasthuri et al., 2015) using VesicleCNN (Roncal et al., 2015, orange) and for our SBEM dataset using Becker et al. (2012) (gray) and Syconn (Dorkenwald et al., 2017, green). Note that these approaches provide synapse detection, only. When including the detection of the synaptic partners, Dorkenwald et al. (2017) reported a drop of detection performance by 2% precision and 9% recall (indicated by crosses, tentatively also for the other approaches). SynEM provides synapse detection and partner detection together (compare to Figure 5e). DOI: http://dx.doi.org/10.7554/eLife.26414.023CC BY · PubMed Central
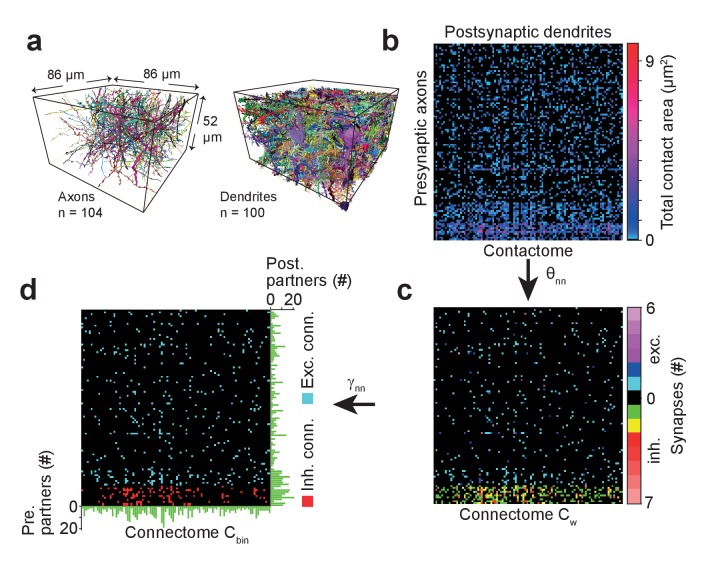
Figure 6. Example sparse local cortical connectome obtained using SynEM. (a) 104 axonal (94 excitatory, 10 inhibitory) and 100 dendritic processes within a volume sized 86 × 52 × 86 µm3 from layer 4 of mouse cortex skeletonized using webKnossos (Boergens et al., 2017), volume segmented using SegEM (Berning et al., 2015). (b) Contactome reporting total contact area between pre- and postsynaptic processes. (c) Weighted connectome obtained at the SynEM threshold θnn optimized for the respective presynaptic type (excitatory, inhibitory) (see Figure 3e, black square, Table 3). (see also Figure 6—figure supplement 1) (d) Binary connectome obtained from the weighted connectome by thresholding at γnn = 1 for excitatory connections and γnn = 2 for inhibitory connections. The resulting predicted neuron-to-neuron recall and precision were 98%, 98% for excitatory and 98%, 97% for inhibitory connections, respectively (see Figure 5e). Green: number of pre- (right) and postsynaptic (bottom) partners for each neurite. DOI: http://dx.doi.org/10.7554/eLife.26414.025
Figure 6. Example sparse local cortical connectome obtained using SynEM. (a) 104 axonal (94 excitatory, 10 inhibitory) and 100 dendritic processes within a volume sized 86 × 52 × 86 µm3 from layer 4 of mouse cortex skeletonized using webKnossos (Boergens et al., 2017), volume segmented using SegEM (Berning et al., 2015). (b) Contactome reporting total contact area between pre- and postsynaptic processes. (c) Weighted connectome obtained at the SynEM threshold θnn optimized for the respective presynaptic type (excitatory, inhibitory) (see Figure 3e, black square, Table 3). (see also Figure 6—figure supplement 1) (d) Binary connectome obtained from the weighted connectome by thresholding at γnn = 1 for excitatory connections and γnn = 2 for inhibitory connections. The resulting predicted neuron-to-neuron recall and precision were 98%, 98% for excitatory and 98%, 97% for inhibitory connections, respectively (see Figure 5e). Green: number of pre- (right) and postsynaptic (bottom) partners for each neurite. DOI: http://dx.doi.org/10.7554/eLife.26414.025CC BY · PubMed Central
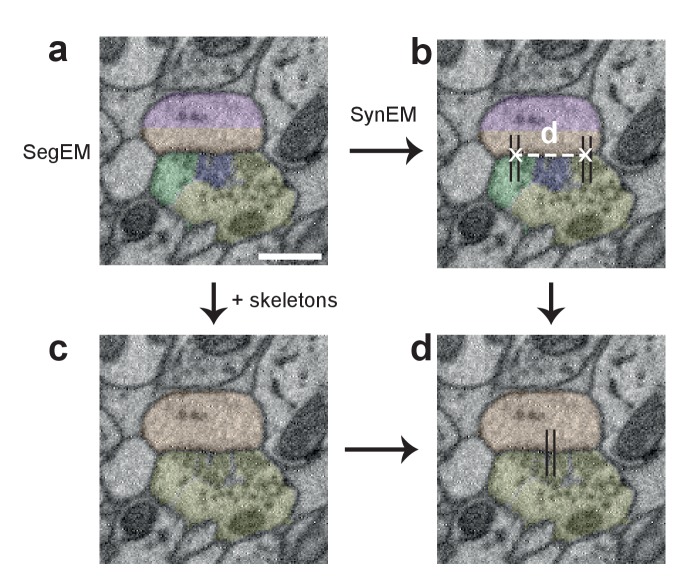
Figure 6—figure supplement 1. Procedure for obtaining synapse counts in the local connectome (Figure 6). (a) Segmentation used for SynEM (note that a segmentation biased to neurite splits was used, see Berning et al., 2015) and (b) interfaces detected as synaptic (black lines). (c) combined skeleton-SegEM segmentation of neurites. (d) Synaptic neurite interfaces established between the same pre- and postsynaptic processes (as determined by the skeleton-SegEM segmentation, c) were clustered using hierarchical clustering with a distance cutoff of d = 1.5 μm (b) for obtaining the final synapse count. Scale bar, 500 nm. DOI: http://dx.doi.org/10.7554/eLife.26414.027
Figure 6—figure supplement 1. Procedure for obtaining synapse counts in the local connectome (Figure 6). (a) Segmentation used for SynEM (note that a segmentation biased to neurite splits was used, see Berning et al., 2015) and (b) interfaces detected as synaptic (black lines). (c) combined skeleton-SegEM segmentation of neurites. (d) Synaptic neurite interfaces established between the same pre- and postsynaptic processes (as determined by the skeleton-SegEM segmentation, c) were clustered using hierarchical clustering with a distance cutoff of d = 1.5 μm (b) for obtaining the final synapse count. Scale bar, 500 nm. DOI: http://dx.doi.org/10.7554/eLife.26414.027CC BY · PubMed Central
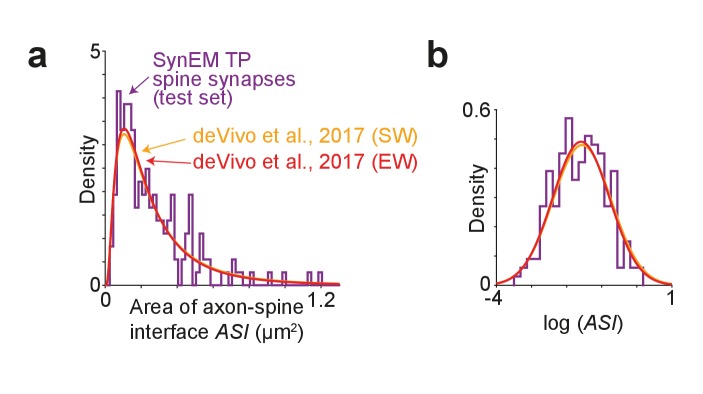
Figure 7. Comparison of synapse size in SBEM data. (a) Distribution of axon-spine interface area ASI for the SynEM-detected synapses onto spines in the test set from mouse S1 cortex imaged at 11.24 × 11.24 × 28 nm3 voxel size (see Figure 3e), purple; and distributions from de Vivo et al. (2017) in S1 cortex from mice under two wakefulness conditions (SW: spontaneous wake, EW: enforced wake), imaged at higher resolution of 5.9 nm (xy plane) with a section thickness of 54.7 ± 4.8 nm (SW), 51.4 ± 10.3 nm (EW) (de Vivo et al., 2017). (b) Same distributions as in (a) shown on natural logarithmic scale (log ASI SynEM −1.60 ± 0.74, n = 181; log ASI SW −1.56 ± 0.83, n = 839; log ASI EW −1.59 ± 0.81, n = 836; mean ± s.d.). Note that the distributions are indistinguishable (p=0.52 (SynEM vs. SW), p=0.83 (SynEM vs. EW), two-sample two-tailed t-test), indicating that the size distribution of synapses detected in our lower-resolution data is representative, and that SynEM does not have a substantial detection bias towards larger synapses. DOI: http://dx.doi.org/10.7554/eLife.26414.029
Figure 7. Comparison of synapse size in SBEM data. (a) Distribution of axon-spine interface area ASI for the SynEM-detected synapses onto spines in the test set from mouse S1 cortex imaged at 11.24 × 11.24 × 28 nm3 voxel size (see Figure 3e), purple; and distributions from de Vivo et al. (2017) in S1 cortex from mice under two wakefulness conditions (SW: spontaneous wake, EW: enforced wake), imaged at higher resolution of 5.9 nm (xy plane) with a section thickness of 54.7 ± 4.8 nm (SW), 51.4 ± 10.3 nm (EW) (de Vivo et al., 2017). (b) Same distributions as in (a) shown on natural logarithmic scale (log ASI SynEM −1.60 ± 0.74, n = 181; log ASI SW −1.56 ± 0.83, n = 839; log ASI EW −1.59 ± 0.81, n = 836; mean ± s.d.). Note that the distributions are indistinguishable (p=0.52 (SynEM vs. SW), p=0.83 (SynEM vs. EW), two-sample two-tailed t-test), indicating that the size distribution of synapses detected in our lower-resolution data is representative, and that SynEM does not have a substantial detection bias towards larger synapses. DOI: http://dx.doi.org/10.7554/eLife.26414.029CC BY · PubMed Central
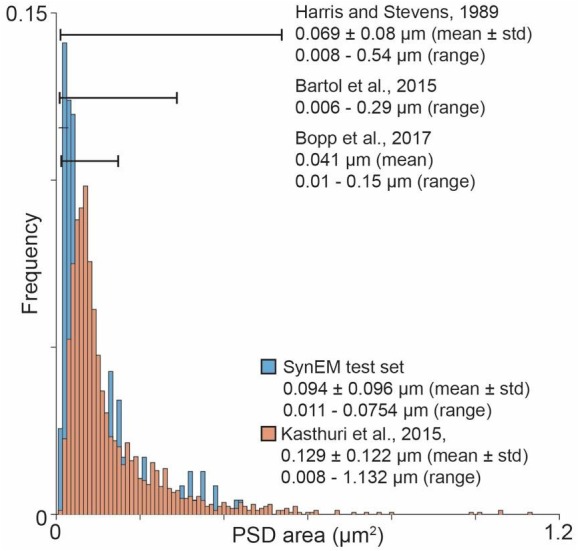
Author response image 1. Overview over published PSD area distribution (Harris and Stevens, 1989; Bartol et al., 2015; Kasthuri et al., 2015; Bopp et al., 2017) in comparison to the SynEM test set PSD area distribution. Ranges as specified in the respective paper (Harris and Stevens, 1989) or estimated from the figures (Bartol et al., 2015; Bopp et al., 2017). The PSD area distribution for (Kasthuri et al., 2015) was calculated using the same method as for the SynEM test set from the synapse segmentation published in (Kasthuri et al., 2015). DOI: http://dx.doi.org/10.7554/eLife.26414.035
Author response image 1. Overview over published PSD area distribution (Harris and Stevens, 1989; Bartol et al., 2015; Kasthuri et al., 2015; Bopp et al., 2017) in comparison to the SynEM test set PSD area distribution. Ranges as specified in the respective paper (Harris and Stevens, 1989) or estimated from the figures (Bartol et al., 2015; Bopp et al., 2017). The PSD area distribution for (Kasthuri et al., 2015) was calculated using the same method as for the SynEM test set from the synapse segmentation published in (Kasthuri et al., 2015). DOI: http://dx.doi.org/10.7554/eLife.26414.035CC BY · PubMed Central
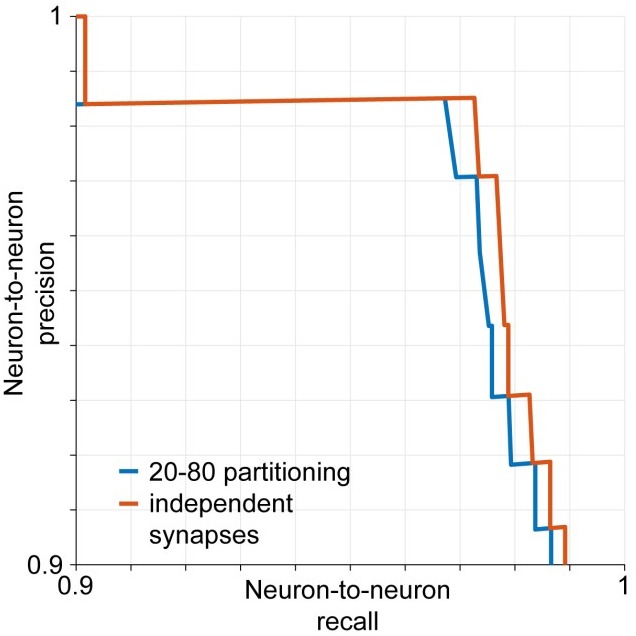
Author response image 2. Estimated neuron-to-neuron recall and precision if synapses are assumed to be retrieved independently by the classifier (red) and assuming that 20% of the connections are made exclusively by the 20% smallest synapses and vice versa (blue). DOI: http://dx.doi.org/10.7554/eLife.26414.036
Author response image 2. Estimated neuron-to-neuron recall and precision if synapses are assumed to be retrieved independently by the classifier (red) and assuming that 20% of the connections are made exclusively by the 20% smallest synapses and vice versa (blue). DOI: http://dx.doi.org/10.7554/eLife.26414.036CC BY · PubMed Central

Verification

Claims the paper makes

The claims and statistics of this paper haven’t been checked yet.

Run the check — free, no account needed. It reads the open-access text and checks the sources it cites.

A few free checks a day · papers already verified open instantly · results are public

Claims other papers make about this one

Each is checked against this paper’s own text: does it say what the citing paper says it does?

Self-check

Percentages, sums and reported differences re-computed from the paper’s own numbers.

The self-check needs the paper’s full text.

Citations

Cites

Show all 9 references

Research works printed but not linked: 40

  1. Bartol, 2015, Nanoconnectomic upper bound on the variability of synaptic plasticity, eLife, 4, e10778, 10.7554/eLife.10778 · DOI
  2. Becker, 2012, Medical Image Computing and Computer-Assisted Intervention – MICCAI 2012: 15th International Conference, Nice, France, October 1-5, 2012, Proceedings, Part I, 585, 10.1007/978-3-642-33415-3_72 · DOI
  3. Becker, 2013, Learning context cues for synapse segmentation, IEEE Transactions on Medical Imaging, 32, 1864, 10.1109/TMI.2013.2267747 · DOI
  4. Berning, 2015, SegEM: efficient image analysis for High-Resolution Connectomics, Neuron, 87, 1193, 10.1016/j.neuron.2015.09.003 · DOI
  5. Boergens, 2017, webKnossos: efficient online 3D data annotation for connectomics, Nature Methods, 14, 691, 10.1038/nmeth.4331 · DOI
  6. Eberle, 2015, High-resolution, high-throughput imaging with a multibeam scanning electron microscope, Journal of Microscopy, 259, 114, 10.1111/jmi.12224 · DOI
  7. Feldmeyer, 2006, Efficacy and connectivity of intracolumnar pairs of layer 2/3 pyramidal cells in the barrel cortex of juvenile rats, The Journal of Physiology, 575, 583, 10.1113/jphysiol.2006.105106 · DOI · Paper page
  8. Feldmeyer, 2002, Synaptic connections between layer 4 spiny neurone- layer 2/3 pyramidal cell pairs in juvenile rat barrel cortex: physiology and anatomy of interlaminar signalling within a cortical column, The Journal of Physiology, 538, 803, 10.1113/jphysiol.2001.012959 · DOI · Paper page
  9. Freund, 1997, A Decision-Theoretic generalization of On-Line Learning and an application to boosting, Journal of Computer and System Sciences, 55, 119, 10.1006/jcss.1997.1504 · DOI · Paper page
  10. Frick, 2008, Monosynaptic connections between pairs of L5A pyramidal neurons in columns of juvenile rat somatosensory cortex, Cerebral Cortex, 18, 397, 10.1093/cercor/bhm074 · DOI
  11. Friedman, 2000, Additive logistic regression: a statistical view of boosting, Annals of Statistics, 28, 337, 10.1214/aos/1016218223 · DOI · Paper page
  12. Gibson, 1999, Two networks of electrically coupled inhibitory neurons in neocortex, Nature, 402, 75, 10.1038/47035 · DOI · Paper page
  13. Gray, 1959, Axo-somatic and axo-dendritic synapses of the cerebral cortex: an electron microscope study, Journal of Anatomy, 93, 420
  14. Gupta, 2000, Organizing principles for a diversity of GABAergic interneurons and synapses in the Neocortex, Science, 287, 273, 10.1126/science.287.5451.273 · DOI · Paper page
  15. Hayworth, 2006, Automating the collection of Ultrathin serial sections for large volume TEM reconstructions, Microscopy and Microanalysis, 12, 86, 10.1017/S1431927606066268 · DOI
  16. Helmstaedter, 2011, High-accuracy neurite reconstruction for high-throughput neuroanatomy, Nature Neuroscience, 14, 1081, 10.1038/nn.2868 · DOI
  17. Helmstaedter, 2013, Cellular-resolution connectomics: challenges of dense neural circuit reconstruction, Nature Methods, 10, 501, 10.1038/nmeth.2476 · DOI
  18. Hoffmann, 2015, Synaptic Conductance estimates of the connection between Local Inhibitor Interneurons and Pyramidal Neurons in Layer 2/3 of a Cortical column, Cerebral Cortex, 25, 4415, 10.1093/cercor/bhv039 · DOI
  19. Hua, 2015, Large-volume en-bloc staining for electron microscopy-based connectomics, Nature Communications, 6, 7923, 10.1038/ncomms8923 · DOI
  20. Huang GB, Scheffer LK, Plaza SM. 2016. Fully-automatic synapse prediction and validation on a large data set. arXiv. https://arxiv.org/abs/1604.03075. · arXiv
  21. Jagadeesh, 2014, Synapse classification and localization in Electron Micrographs, Pattern Recognition Letters, 43, 17, 10.1016/j.patrec.2013.06.001 · DOI
  22. Kasthuri, 2015, Saturated reconstruction of a volume of Neocortex, Cell, 162, 648, 10.1016/j.cell.2015.06.054 · DOI · Paper page
  23. Knott, 2008, Serial section scanning electron microscopy of adult brain tissue using focused ion beam milling, Journal of Neuroscience, 28, 2959, 10.1523/JNEUROSCI.3189-07.2008 · DOI · Paper page
  24. Koelbl, 2015, A barrel-related interneuron in layer 4 of rat somatosensory cortex with a high intrabarrel connectivity, Cerebral Cortex, 25, 713, 10.1093/cercor/bht263 · DOI · Paper page
  25. Kreshuk, 2015, Medical Image Computing and Computer-Assisted Intervention - MICCAI 2015: 18th International Conference, Munich, Germany, October 5-9, 2015, Proceedings, Part I, 661, 10.1007/978-3-319-24553-9_81 · DOI · Paper page
  26. Kreshuk, 2014, Automated detection of synapses in serial section transmission electron microscopy image stacks, PLoS One, 9, e87351, 10.1371/journal.pone.0087351 · DOI
  27. Kreshuk, 2011, Automated detection and segmentation of synaptic contacts in nearly isotropic serial electron microscopy images, PLoS One, 6, e24899, 10.1371/journal.pone.0024899 · DOI
  28. Markram, 1997, Physiology and anatomy of synaptic connections between thick tufted pyramidal neurones in the developing rat neocortex, The Journal of Physiology, 500, 409, 10.1113/jphysiol.1997.sp022031 · DOI · Paper page
  29. Márquez Neila, 2016, A fast method for the segmentation of synaptic Junctions and Mitochondria in serial electron microscopic images of the brain, Neuroinformatics, 14, 235-50, 10.1007/s12021-015-9288-z · DOI
  30. Merchán-Pérez, 2014, Three-dimensional spatial distribution of synapses in the neocortex: a dual-beam electron microscopy study, Cerebral Cortex, 24, 1579, 10.1093/cercor/bht018 · DOI
  31. Mikula, 2012, Staining and embedding the whole mouse brain for electron microscopy, Nature Methods, 9, 1198, 10.1038/nmeth.2213 · DOI
  32. Mikula, 2015, High-resolution whole-brain staining for electron microscopic circuit reconstruction, Nature Methods, 12, 541, 10.1038/nmeth.3361 · DOI
  33. Mishchenko, 2010, Ultrastructural analysis of hippocampal neuropil from the connectomics perspective, Neuron, 67, 1009, 10.1016/j.neuron.2010.08.014 · DOI
  34. Pallotto, 2015, Extracellular space preservation aids the connectomic analysis of neural circuits, eLife, 4, e08206, 10.7554/eLife.08206 · DOI
  35. Perez, 2014, A workflow for the automatic segmentation of organelles in electron microscopy image stacks, Frontiers in Neuroanatomy, 8, 126, 10.3389/fnana.2014.00126 · DOI
  36. Plaza SM, Parag T, Huang GB, Olbris DJ, Saunders MA, Rivlin PK. 2014. Annotating synapses in large EM datasets. arXiv. https://arxiv.org/abs/1409.1801. · arXiv
  37. Roncal WG, Pekala M, Kaynig-Fittkau V, Kleissas DM, Vogelstein JT, Pfister H, Hager GD. 2015. VESICLE: Volumetric Evaluation of Synaptic Interfaces using Computer Vision at Large Scale. BMVA Press. Proceedings of the British Machine Vision Conference.
  38. Sommer C, Straehle C, Kothe U, Hamprecht FA. 2011. Ilastik: interactive Learning and Segmentation Toolkit. 2011 8th Ieee International Symposium on Biomedical Imaging: From Nano to Macro.
  39. Staffler B, Berning M, Boergens KM, Gour A, van der Smagt P, Helmstaedter M. 2017. SynEM: automated synapse detection for connectomics. bioRxiv. http://www.biorxiv.org/content/early/2017/01/22/099994.
  40. White, 1993, Cortical modules in the posteromedial barrel subfield (Sml) of the mouse, The Journal of Comparative Neurology, 334, 86, 10.1002/cne.903340107 · DOI

Cited by

Sorted by citations

See all 62

Metadata

Authors
Staffler, B., Berning, M., Boergens, K. M., Gour, A., Smagt, P. V. D., & Helmstaedter, M.
Affiliations
  • Department of Connectomics, Max Planck Institute for Brain Research, Frankfurt, Germany
  • Biomimetic Robotics and Machine Learning, Munich, Germany
Venue
eLife
Published
2017-07-14
Volume
6
ISSN
2050-084X
Cited by
62
References
9
Language
en
Funders
Max-Planck Society (Open access funding)

About these checks

Registry, retraction, Cites and statistics results are computed, not judged, with one exception: a printed reference that no index lists is read once by a model before it counts as a citation error. Claims are extracted by a model and kept only when their quote appears verbatim in the text; each cited source is then checked, with a model’s help, for whether it says what the claim relies on. Those verdicts can be wrong — read the claim’s quote and the cited source before relying on one.

Statistics and arithmetic are recomputed, not judged.

Confidence bands are shown only for fields calibrated on our annotated test set. None is calibrated yet, so no band is shown.

What counts as a claim ›How we measure confidence ›How we check this ›

Are you an author, or do you see a problem with this page? Request a review

How to cite

Cite CoChat for the checks on this page, and the paper for its own findings.

This page
CoChat. (2026). Citation check: SynEM, automated synapse detection for connectomics. https://app.cochat.ai/papers/10.7554/elife.26414
The paper
Staffler, B., Berning, M., Boergens, K. M., Gour, A., Smagt, P. V. D., & Helmstaedter, M. (2017). SynEM, automated synapse detection for connectomics. eLife. https://doi.org/10.7554/elife.26414