

The DOI matches its Crossref record; 91 of the 91 references it cites were found in a registry or an index.
Experimental evaluation of the importance of colonization history in early-life gut microbiota assembly
Open accessAbstract
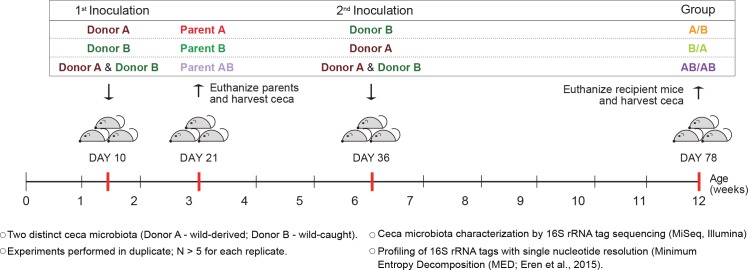
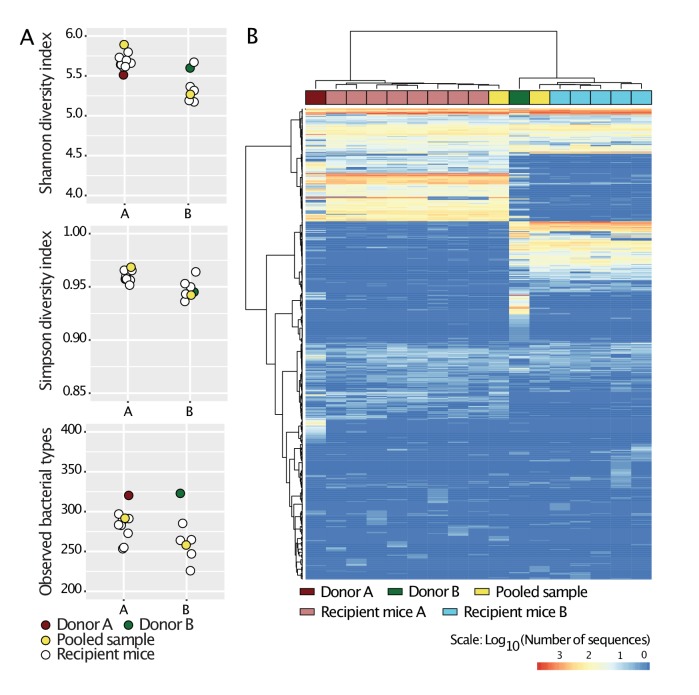
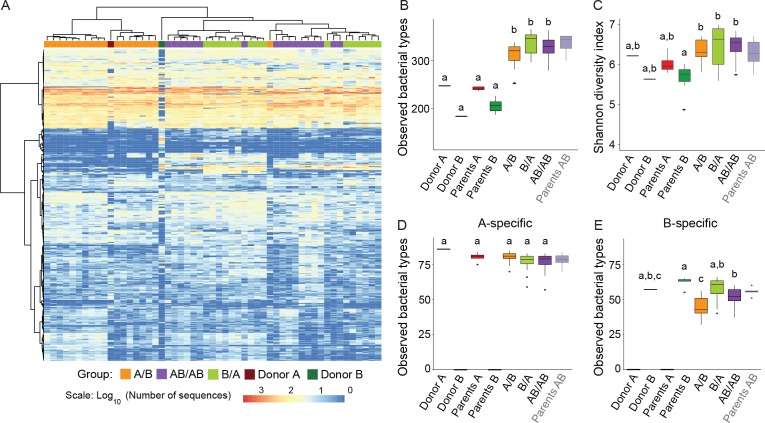
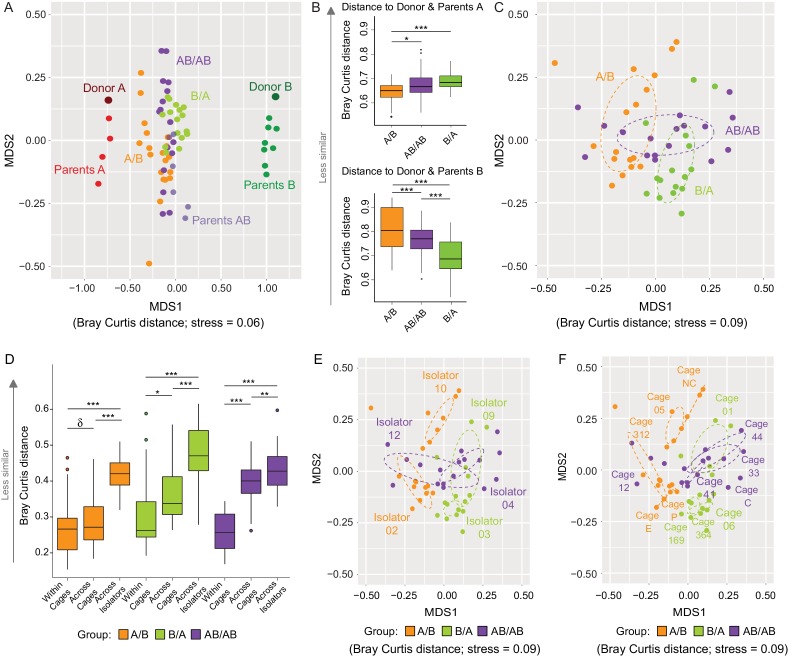
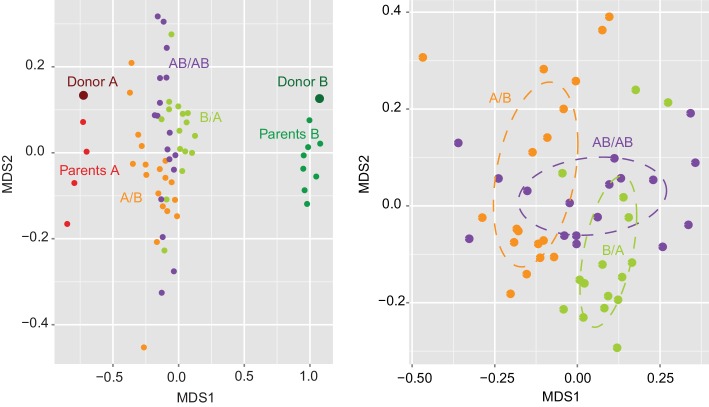
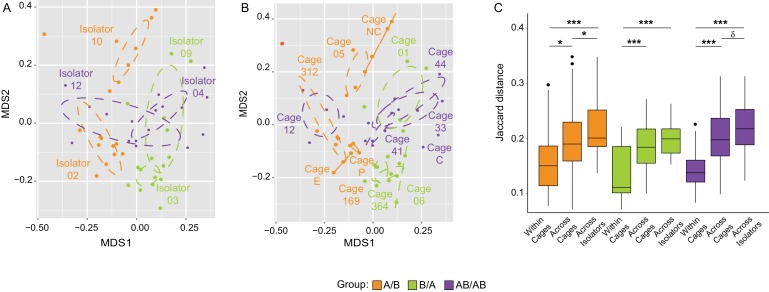
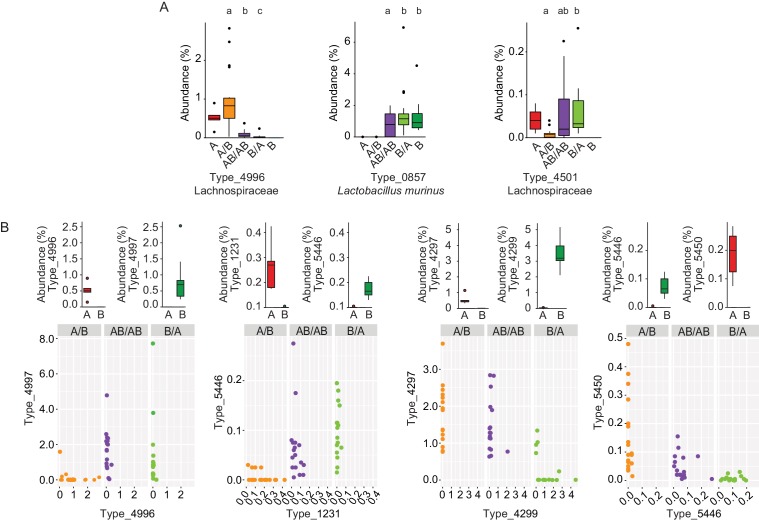
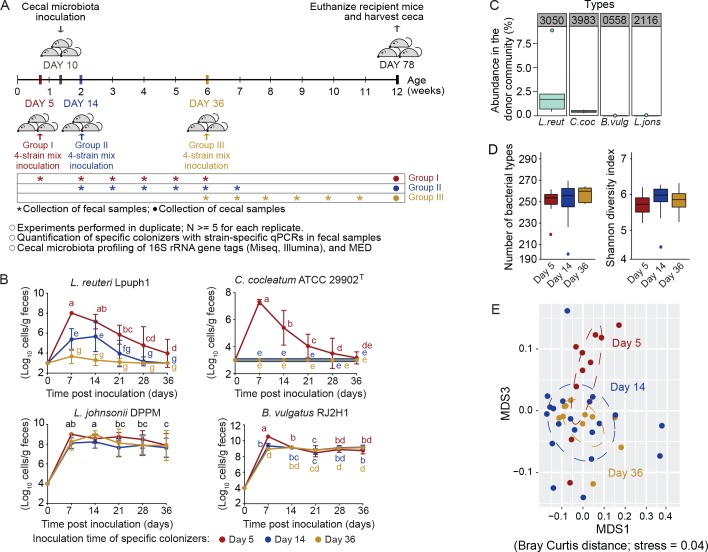
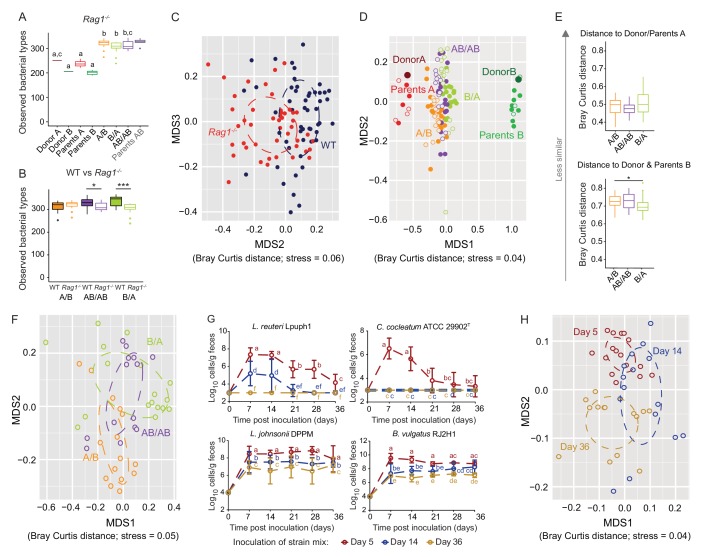
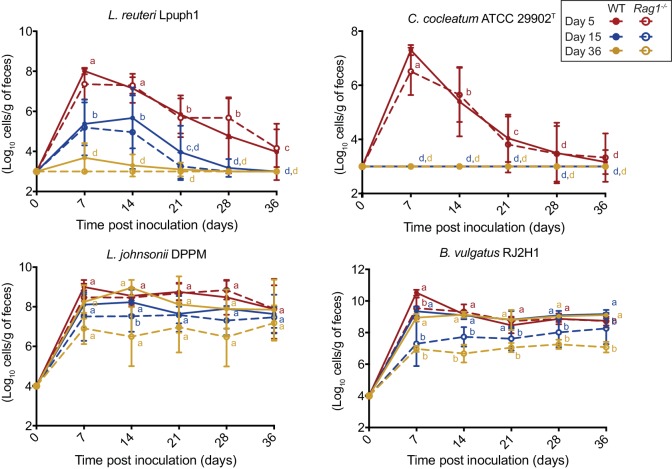
The factors that govern assembly of the gut microbiota are insufficiently understood. Here, we test the hypothesis that inter-individual microbiota variation can arise solely from differences in the order and timing by which the gut is colonized early in life. Experiments in which mice were inoculated in sequence either with two complex seed communities or a cocktail of four bacterial strains and a seed community revealed that colonization order influenced both the outcome of community assembly and the ecological success of individual colonizers. Historical contingency and priority effects also occurred in Rag1-/- mice, suggesting that the adaptive immune system is not a major contributor to these processes. In conclusion, this study established a measurable effect of colonization history on gut microbiota assembly in a model in which host and environmental factors were strictly controlled, illuminating a potential cause for the high levels of unexplained individuality in host-associated microbial communities.
Overview
The claims and statistics of this paper haven’t been checked yet.
Run the check — free, no account needed. It reads the open-access text and checks the sources it cites.
Integrity signals
Registry
Cites
Statistics
Figures
Verification
Claims the paper makes
The claims and statistics of this paper haven’t been checked yet.
Run the check — free, no account needed. It reads the open-access text and checks the sources it cites.
Claims other papers make about this one
Each is checked against this paper’s own text: does it say what the citing paper says it does?
The source backs part of the claim, not all of it — or backs it for a different population, condition or comparison.
In the citing paper
“However, it is known that the microbiota tends to follow one of a few trajectories of development, with early-colonizing species shaping the long-term composition (Martinez et al., 2018).”
From The Microbiota-Gut-Brain Axis (2019) · cites this paper as Martinez et al., 2018
Experimental — accuracy not yet measured
Self-check
Percentages, sums and reported differences re-computed from the paper’s own numbers.
The self-check needs the paper’s full text.
Citations
Cites
R: A Language and Environment for Statistical Computing
R Core Team (2000) · doi:10.32614/r.manuals · Cited by 355,893
Fitting Linear Mixed-Effects Models Using lme4
Bates, D., Mächler, M., Bolker, B., & Walker, S. (2015) · Journal of Statistical Software · doi:10.18637/jss.v067.i01 · Cited by 86,835
QIIME allows analysis of high-throughput community sequencing data
Caporaso, J. G., Kuczynski, J., Stombaugh, J., Bittinger, K., Bushman, F. D., Costello, E. K., Fierer, N., Peña, A. G., Goodrich, J. K., Gordon, J. I., et al. (2010) · Nature Methods · doi:10.1038/nmeth.f.303 · Cited by 34,887
vegan: Community Ecology Package
Oksanen, J., Simpson, G. L., Blanchet, F. G., Kindt, R., Legendre, P., Minchin, P. R., O’Hara, R. B., Sólymos, P., Stevens, M. H. H., Szöcs, E., et al. (2001) · doi:10.32614/cran.package.vegan · Cited by 27,099
Naive Bayesian Classifier for Rapid Assignment of rRNA Sequences into the New Bacterial Taxonomy
Wang, Q., Garrity, G. M., Tiedje, J. M., & Cole, J. R. (2007) · Applied and Environmental Microbiology · doi:10.1128/aem.00062-07 · Cited by 20,145
Simultaneous Inference in General Parametric Models
Hothorn, T., Bretz, F., & Westfall, P. H. (2008) · Biometrical Journal · doi:10.1002/bimj.200810425 · Cited by 14,265
Structure, function and diversity of the healthy human microbiome
The Human Microbiome Project Consortium (2012) · Nature · doi:10.1038/nature11234 · Cited by 11,726
Diet rapidly and reproducibly alters the human gut microbiome
David, L. A., Maurice, C. F., Carmody, R. N., Gootenberg, D. B., Button, J. E., Wolfe, B. E., Ling, A. V., Devlin, A. S., Varma, Y., Fischbach, M. A., et al. (2014) · Nature · doi:10.1038/nature12820 · Cited by 10,100
From Dietary Fiber to Host Physiology: Short-Chain Fatty Acids as Key Bacterial Metabolites
Koh, A., De Vadder, F., Kovatcheva-Datchary, P., & Bäckhed, F. (2016) · Cell · doi:10.1016/j.cell.2016.05.041 · Cited by 7,070
Linking long-term dietary patterns with gut microbial enterotypes
Wu, G. D., Chen, J., Hoffmann, C., Bittinger, K., Chen, Y.-Y., Keilbaugh, S. A., Bewtra, M., Knights, D., Walters, W. A., Knight, R., et al. (2011) · Science · doi:10.1126/science.1208344 · Cited by 6,513
Cited by
Sorted by citations
Items 101–200 of 201
Santos, B., Martins, F. M. S., Sabino‐Pinto, J., Licata, F., & Crottini, A. (2023) · Scientific Reports · doi:10.1038/s41598-023-43340-2 · Cited by 17
Holcomb, L. E., Holman, J. M., Hurd, M., Lavoie, B. A., Colucci, L., Hunt, B., Hunt, T., Kinney, M. S., Pathak, J., Mawe, G. M., et al. (2023) · mSystems · doi:10.1128/msystems.00688-23 · Cited by 20
Zhu, L., Yang, Q., Haute, M. J. S. V., Kok, C. R., Neto, J. C. G., Pavlovikj, N., Pillai, R., Sinha, R., Hassenstab, H. R., Mustoe, A. C., et al. (2021) · mBio · doi:10.1128/mbio.01153-21 · Cited by 16
Self-citationZapién-Campos, R., Sieber, M., & Traulsen, A. (2020) · PLoS Computational Biology · doi:10.1371/journal.pcbi.1008392 · Cited by 13
Resistant starch: A promising ingredient and health promoter
Ribeiro, N. C. B. V., Ramer‐Tait, A. E., & Cazarin, C. B. B. (2022) · PharmaNutrition · doi:10.1016/j.phanu.2022.100304 · Cited by 13
Self-citationBabajanyan, S. G., Garushyants, S. K., Wolf, Y. I., & Koonin, E. V. (2024) · BMC Biology · doi:10.1186/s12915-024-01937-7 · Cited by 15
Liu, W., Sun, Z., Ma, C., Zhang, J., Ma, C., Zhao, Y., Hong Kui, W. E. I., Huang, S. W., & Zhang, H. (2020) · Gut Microbes · doi:10.1080/19490976.2020.1830699 · Cited by 14
Impact of colonization history on the composition of ecological systems
Zhao, N., Saavedra, S., & Liu, Y. (2021) · Physical review. E · doi:10.1103/physreve.103.052403 · Cited by 15
Chiang, E., Deblois, C. L., Carey, H. V., & Suen, G. (2022) · Animal Microbiome · doi:10.1186/s42523-021-00154-9 · Cited by 14
Temperature and the microbial environment alter brain morphology in a larval amphibian
Emerson, K. J., Fontaine, S. S., Kohl, K. D., & Woodley, S. K. (2023) · Journal of Experimental Biology · doi:10.1242/jeb.245333 · Cited by 13
Oguri, N., Kobayashi, C., Ozawa, Y., Kimura, T., Nishinarita, Y., Wada, H., Nemoto, N., Narita, M., Tanigaki, S., Hanawa, T., et al. (2025) · Nature Communications · doi:10.1038/s41467-025-63466-3 · Cited by 13
Jones, K. R., Hughey, M. C., & Belden, L. K. (2023) · Proceedings of the Royal Society B Biological Sciences · doi:10.1098/rspb.2023.0308 · Cited by 12
Koleva, P. T., He, J., Dunsmore, G., Bozorgmehr, N., Lu, J., Huynh, M., Tollenaar, S. L., Huang, V., Walter, J., Way, S. S., et al. (2024) · Microbiome · doi:10.1186/s40168-024-01859-0 · Cited by 14
Self-citationEarly-life gut microbiota assembly patterns are conserved between laboratory and wild mice
Hanski, E., Raulo, A., & Knowles, S. C. L. (2024) · Communications Biology · doi:10.1038/s42003-024-07039-y · Cited by 18
Spatiotemporal dynamics during niche remodeling by super-colonizing microbiota in the mammalian gut
Urtecho, G., Moody, T. U., Huang, Y., Sheth, R. U., Richardson, M., Descamps, H. C., Kaufman, A., Lekan, O., Zhang, Z., Velez‐Cortes, F., et al. (2024) · Cell Systems · doi:10.1016/j.cels.2024.10.007 · Cited by 14
Pérez-Muñoz, M. E., Sugden, S., Harmsen, H. J. M., Hart, B. A. ‘., Laman, J. D., & Walter, J. (2021) · iScience · doi:10.1016/j.isci.2021.102709 · Cited by 12
Self-citationGurung, A., Mukherjee, S., Declercq, M., Souffreau, C., & Meester, L. D. (2024) · Limnology and Oceanography · doi:10.1002/lno.12614 · Cited by 11
Michel, C., & Blottière, H. M. (2022) · Frontiers in Microbiology · doi:10.3389/fmicb.2022.825942 · Cited by 13
Miller, A. J., Gass, J. T., Jo, M. C., Bishop, L., Petereit, J., Woodhams, D. C., & Voyles, J. (2023) · Philosophical Transactions of the Royal Society B Biological Sciences · doi:10.1098/rstb.2022.0125 · Cited by 11
Impact of timing on the invasion of synthetic bacterial communities
Dooley, K. D., Henry, L. P., & Bergelson, J. M. (2024) · The ISME Journal · doi:10.1093/ismejo/wrae220 · Cited by 10
Fernando, S. C., Adams, S., Lakamp, A. D., & Spangler, M. L. (2025) · Journal of Dairy Science · doi:10.3168/jds.2024-25797 · Cited by 10
Muñoz, R. R. S., Quach, T. N., Neto, J. C. G., Xian, Y., Peña, P. A., Weier, S. A., Pellizzon, M., Kittana, H., Cody, L. A., Geis, A. L., et al. (2020) · Molecular Nutrition & Food Research · doi:10.1002/mnfr.202000162 · Cited by 10
Self-citationHinchliffe, T., Pauline, M. L., Wizzard, P. R., Jovel, J., Nation, P. N., Wales, P. W., Madsen, K. L., & Turner, J. M. (2022) · Journal of Parenteral and Enteral Nutrition · doi:10.1002/jpen.2333 · Cited by 10
Systematic dissection of a complex gut bacterial communityPreprint
Cheng, A. G., Aranda-Díaz, A., Jain, S., Yu, F. B., Iakiviak, M., Meng, X., Weakley, A. M., Patil, A., Shiver, A. L., Deutschbauer, A. M., et al. (2021) · bioRxiv (Cold Spring Harbor Laboratory) · doi:10.1101/2021.06.15.448618 · Cited by 9
Huang, H., Kuo, T.-C., Lee, Y., & Chen, M. (2025) · Frontiers in Veterinary Science · doi:10.3389/fvets.2025.1590388 · Cited by 9
Beaumont, M., Lencina, C., Bertide, A., Gallo, L., Barilly, C., Marrauld, C., Cauquil, L., Samson, A., & Combes, S. (2023) · Microbiology Spectrum · doi:10.1128/spectrum.00694-23 · Cited by 11
Yu, J., Zhou, Y., Wen, Q., Wang, B., Gong, H., Zhu, L., Lan, H., Wu, B., Lang, W., Zheng, X., et al. (2021) · Animal Production Science · doi:10.1071/an21093 · Cited by 9
Priority effects alter the colonization success of a host‐associated parasite and mutualist
Burr, A. A., Woods, K. D., Cassidy, S. T., & Wood, C. W. (2022) · Ecology · doi:10.1002/ecy.3720 · Cited by 9
Vertical transmission of sponge microbiota is inconsistent and unfaithfulPreprint
Björk, J. R., Diéz-Vives, C., Astudillo-García, C., Archie, E. A., & Montoya, J. M. (2018) · bioRxiv (Cold Spring Harbor Laboratory) · doi:10.1101/425009 · Cited by 9
Effects of past and present habitat on the gut microbiota of a wild rodent
Scholier, T., Lavrinienko, A., Kallio, E. R. K., Watts, P. C., & Mappes, T. (2024) · Proceedings of the Royal Society B Biological Sciences · doi:10.1098/rspb.2023.2531 · Cited by 8
Microbial community interactions on a chip
Juang, D. S., Wightman, W. E., Lozano, G. L., Juang, T. D., Barkal, L. J., Yu, J., Garavito, M. F., Hurley, A. I., Venturelli, O. S., Handelsman, J., et al. (2024) · Proceedings of the National Academy of Sciences · doi:10.1073/pnas.2403510121 · Cited by 8
Elendu, C., Omeludike, E., Aregbesola, E. T., Mordi, P., Blewusi, G. S., Ogidan, A. O., Okeke, N. S., Obidigbo, B. T., Asini, A. O., Ubi, E. S., et al. (2025) · Annals of Medicine and Surgery · doi:10.1097/ms9.0000000000003649 · Cited by 9
Bifidobacterium as Keystone Species Driving Microbial Interactions in the Infant Digestive Tract
Vásquez-Dean, J., Canales, A., Orellana, C. A., & Garrido, D. (2026) · Annual Review of Food Science and Technology · doi:10.1146/annurev-food-052924-065321 · Cited by 7
An Updated Narrative Mini-Review on the Microbiota Changes in Antenatal and Post-Partum Depression
Doroftei, B., Ilie, O., Diaconu, R., Huțanu, D., Stoian, I. L., & Ilea, C. G. (2022) · Diagnostics · doi:10.3390/diagnostics12071576 · Cited by 10
The effect of intrinsic factors and mechanisms in shaping human gut microbiota
Wang, H., Li, J., Wu, G., Zhang, F., Jia, Y., & He, Y. (2022) · Medicine in Microecology · doi:10.1016/j.medmic.2022.100054 · Cited by 9
Gut microbes predominantly act as living beneficial partners rather than raw nutrients
Silva-Soares, N. F., Quagliariello, A., Yigitturk, S., & Martino, M. E. (2023) · Scientific Reports · doi:10.1038/s41598-023-38669-7 · Cited by 6
Yu, X., Ma, F., Dai, H., Liu, J., Hashem, N. M., & Sun, P. (2023) · Animals · doi:10.3390/ani13213366 · Cited by 6
Andres, K. J., Liu, B., Johnson, L., Kapuscinski, K. L., Moerke, A. H., Ling, F., & Knouft, J. H. (2024) · Aquaculture · doi:10.1016/j.aquaculture.2024.741469 · Cited by 6
Alberdi, A., Limborg, M. T., Groussin, M., Aizpurua, O., & Gilbert, M. T. P. (2025) · Journal of Evolutionary Biology · doi:10.1093/jeb/voaf063 · Cited by 5
Quantifying (non)parallelism of gut microbial community change using multivariate vector analysis
Härer, A., & Rennison, D. J. (2022) · Ecology and Evolution · doi:10.1002/ece3.9674 · Cited by 5
Bo, T., & Kohl, K. D. (2021) · Animal Microbiome · doi:10.1186/s42523-021-00087-3 · Cited by 6
Muñoz, R. R. S., Mantz, S., Martínez, I., Schmaltz, R. J., Walter, J., & Ramer‐Tait, A. E. (2020) · Research Square · doi:10.21203/rs.3.rs-123088/v1 · Cited by 6
Self-citationFructooligosaccharides as Prebiotics, their Metabolism, and Health Benefits
de la Rosa, O., Flores‐Gallegos, A. C., Ascacio-Valdés, J. A., Sepúlveda, L., Montañez, J., & Aguilar, C. N. (2022) · doi:10.1002/9781119702160.ch13 · Cited by 6
Hick, E., Suárez, M., Rey-Mariño, A., Mantecón, L., Fernández, N., Sánchez, G. S., Gueimonde, M., & Arboleya, S. (2024) · Nutrients · doi:10.3390/nu16131976 · Cited by 5
Miyoshi, J., & Hisamatsu, T. (2024) · Clinical Journal of Gastroenterology · doi:10.1007/s12328-024-02088-6 · Cited by 5
Fontaine, S. S., & Trevelline, B. K. (2025) · Journal of Experimental Biology · doi:10.1242/jeb.250130 · Cited by 6
Long-distance movement dynamics shape host microbiome richness and turnover
Pearman, W. S., Duffy, G. A., Gemmell, N. J., Morales, S. E., & Fraser, C. I. (2024) · FEMS Microbiology Ecology · doi:10.1093/femsec/fiae089 · Cited by 5
Microbiome: Evolution in a World of Interaction
King, K. C., Stevens, E. J., & Drew, G. (2020) · Current Biology · doi:10.1016/j.cub.2020.02.010 · Cited by 5
Nishinarita, Y., Miyoshi, J., Kuronuma, S., Wada, H., Oguri, N., Hibi, N., Takeuchi, O., Akimoto, Y., Lee, S. T. M., Matsuura, M., et al. (2025) · Scientific Reports · doi:10.1038/s41598-025-03661-w · Cited by 4
Hudcovic, T., Hermanová, P. P., Kozáková, H., Benada, O., Kofroňová, O., Schwarzer, M., & Šrůtková, D. (2024) · Frontiers in Microbiology · doi:10.3389/fmicb.2024.1393732 · Cited by 4
Moore, M. A., Whittington, H. D., Knickmeyer, R. C., Azcárate-Peril, M. A., & Bruno-Bárcena, J. M. (2024) · Gut Microbes · doi:10.1080/19490976.2024.2440120 · Cited by 4
Lumpi, T., Guo, X., & Lindström, E. S. (2023) · Environmental Microbiology · doi:10.1111/1462-2920.16450 · Cited by 4
The Aquatic Microbial Environment Shapes the Tadpole Microbiome and Antipredator Behavior
Emerson, K. J., Shaikh, S. S., Bradley-Slagle, D. P., & Woodley, S. K. (2025) · Integrative and Comparative Biology · doi:10.1093/icb/icaf009 · Cited by 3
Yu, Y., Tian, S., Zhou, S., Wang, X., Liu, Y., Zhao, Y., Liang, J., Jimenez, L., & Zhang, G. (2026) · International Journal of Food Microbiology · doi:10.1016/j.ijfoodmicro.2026.111800 · Cited by 3
Gut immune responses and evolution of the gut microbiome—a hypothesis
Viney, M., & Cheynel, L. (2023) · Discovery Immunology · doi:10.1093/discim/kyad025 · Cited by 3
Duration of rupture of membranes and microbiome transmission to the newborn: A prospective study
Ribère, M., Lemieux‐Labonté, V., Pincez, T., Azria, É., & Lapointe, F. (2024) · BJOG An International Journal of Obstetrics & Gynaecology · doi:10.1111/1471-0528.17774 · Cited by 3
Investigating the core microbiome concept: Daphnia as a case study
Gurung, A., Callens, M., Massol, F., Souffreau, C., Mukherjee, S., Houwenhuyse, S., Stoks, R., Meester, L. D., & Decaestecker, E. (2025) · Environmental Microbiome · doi:10.1186/s40793-025-00834-y · Cited by 3
Kashyap, S., & Das, A. (2023) · Acta Microbiologica et Immunologica Hungarica · doi:10.1556/030.2023.02054 · Cited by 4
Maternal transmission as a microbial symbiont sieve, and the absence of lactation in male mammals
Fagan, B., Constable, G. W. A., & Law, R. (2024) · Nature Communications · doi:10.1038/s41467-024-49559-5 · Cited by 4
Xiang, Q., Yan, X., Shi, X., Huang, Y., Li, L., Zhong, J., Xu, T., Tang, S., Shi, W., & Zhou, K. (2024) · Computational and Structural Biotechnology Journal · doi:10.1016/j.csbj.2024.07.007 · Cited by 3
Lin, C.-Y. L., Huang, Y., Lin, H., Tsai, M., Ku, J.-T., Lee, F.-C., & Chang, H. C. (2025) · Pediatrics & Neonatology · doi:10.1016/j.pedneo.2025.03.008 · Cited by 2
The type VI secretion system governs strain maintenance in a wild mammalian gut microbiome
Shen, B. A., Asfahl, K. L., Lim, B., Bertolli, S. K., Minot, S. S., Radey, M. C., Penewit, K. M., Ngo, B., Salipante, S. J., Johnston, C. D., et al. (2026) · eLife · doi:10.1101/2025.11.29.690828 · Cited by 2
The microbiome in infant gut health and development
Alipour, Z., Duman, H., Lee, J. J., Karav, S., & Frese, S. A. (2024) · Elsevier eBooks · doi:10.1016/b978-0-443-18979-1.00003-4 · Cited by 2
Hashem, N. M., Hosny, N. S., El-Desoky, N. I., Lail, G. A. E., Soltan, Y. A., Elolimy, A. A., Abu-Tor, E.-S. M., & Sallam, S. M. A. (2025) · Probiotics and Antimicrobial Proteins · doi:10.1007/s12602-025-10822-w · Cited by 2
Interspecies interaction controls Escherichia coli growth in human gut microbiome samples
Boumasmoud, M., León‐Sampedro, R., Beusch, V., Benz, F., Arnoldini, M., & Hall, A. R. (2026) · Proceedings of the National Academy of Sciences · doi:10.1073/pnas.2527793123 · Cited by 2
Impact of delivery mode in early life microbiome and risk of disease
Martineau, E., & Clemente, J. C. (2020) · Elsevier eBooks · doi:10.1016/b978-0-12-818097-6.00005-5 · Cited by 1
Özkurt, E. (2025) · mSystems · doi:10.1128/msystems.01745-24 · Cited by 2
Ioannou, A., & Belzer, C. (2025) · Current Opinion in Microbiology · doi:10.1016/j.mib.2025.102659 · Cited by 1
Long-term culture of germ-free zebrafish using gamma-irradiated feeds
Okyere, L., Fulvio, A. D., & Gaulke, C. A. (2026) · mSystems · doi:10.1128/msystems.00353-26 · Cited by 1
Ayayee, P. A., Custer, G., Clayton, J. B., Price, J., Ramer‐Tait, A. E., & Larsen, T. (2025) · Communications Biology · doi:10.1038/s42003-025-08966-0 · Cited by 1
Self-citationEarly‐life assembly of gut microbiota affects anti‐predator defenses in host Daphnia
Liu, Q., Sun, Q., Gu, L., Sun, Y., Lee, J., & Yang, Z. (2025) · Limnology and Oceanography · doi:10.1002/lno.70277 · Cited by 1
Maternal transmission as a microbial symbiont sieve, and the absence of lactation in male mammalsPreprint
Fagan, B., Constable, G. W. A., & Law, R. (2022) · bioRxiv (Cold Spring Harbor Laboratory) · doi:10.1101/2022.01.10.475639 · Cited by 1
Babajanyan, S. G., Garushyants, S. K., Wolf, Y. I., & Koonin, E. V. (2024) · bioRxiv (Cold Spring Harbor Laboratory) · doi:10.1101/2024.01.17.576128 · Cited by 1
Barrier-Free Microhabitats: Self-Organized Seclusion in Microbial CommunitiesPreprint
Slepukhin, V. M., Peris-Yague, V., Westendorf, C., Koch, B., & Hallatschek, O. (2025) · bioRxiv (Cold Spring Harbor Laboratory) · doi:10.1101/2025.03.26.645601 · Cited by 1
Neonatal Peyer’s patch cDC activation as a pacemaker of postnatal immune maturationPreprint
Torow, N., Li, R., Hitch, T. C. A., Mingels, C., Bounny, S. A., van Best, N., Stange, E.-L., Benabid, A., Rüttger, L., Gadermayr, M., et al. (2022) · bioRxiv (Cold Spring Harbor Laboratory) · doi:10.1101/2022.03.03.482839 · Cited by 1
The type VI secretion system governs strain maintenance in a wild mammalian gut microbiomePreprint
Shen, B. A., Asfahl, K. L., Lim, B., Bertolli, S. K., Minot, S. S., Radey, M. C., Penewit, K. M., Ngo, B., Salipante, S. J., Johnston, C. D., et al. (2026) · eLife · doi:10.7554/elife.110200.1 · Cited by 1
The type VI secretion system governs strain maintenance in a wild mammalian gut microbiomePreprint
Shen, B. A., Asfahl, K. L., Lim, B., Bertolli, S. K., Minot, S. S., Radey, M. C., Penewit, K. M., Ngo, B., Salipante, S. J., Johnston, C. D., et al. (2026) · eLife · doi:10.7554/elife.110200 · Cited by 1
Impact of probiotics on commensal and pathogenic swine intestinal microbes
Wang, W. (2019) · ERA: Education and Research Archive (University of Alberta) · doi:10.7939/r3-7akn-0y16
We built this city on pollution and mold
Ness, S. (2020) · Health Science Inquiry · doi:10.29173/hsi315
The nature of gut microbiota in early life
van Best, N. (2021) · Research Publications (Maastricht University) · doi:10.26481/dis.20210430nb
Ecological Dynamics Imposes Fundamental Challenges in Microbial Source TrackingPreprint
Wang, X., Wu, L. H., Dai, L., Yin, X., Zhang, T., Weiss, S. T., & Liu, Y. (2022) · bioRxiv (Cold Spring Harbor Laboratory) · doi:10.1101/2022.05.21.492809
Early Life Microbiome Colonization and Human Health
Mims, T. S., Miyoshi, J., & Pierre, J. F. (2022) · Royal Society of Chemistry eBooks · doi:10.1039/9781839160950-00150
Gut microbes predominantly act as symbiotic partners rather than raw nutrientsPreprint
Soares, N. F. D. S., Quagliariello, A., Yigitturk, S., & Martino, M. E. (2023) · bioRxiv (Cold Spring Harbor Laboratory) · doi:10.1101/2023.02.08.527620
Andres, K. J., Liu, B., Johnson, L., Kapuscinski, K. L., Moerke, A. H., Ling, F., & Knouft, J. H. (2023) · bioRxiv (Cold Spring Harbor Laboratory) · doi:10.1101/2023.02.21.529474
The repercussions of timing in the invasion of synthetic bacterial communitiesPreprint
Dooley, K. D., & Bergelson, J. M. (2024) · bioRxiv (Cold Spring Harbor Laboratory) · doi:10.1101/2024.03.24.586461
Quan, J., Xu, C., Ruan, D., Ye, Y., Qiu, Y., Wu, J., Zhou, S., Luan, M., Zhao, X., Chen, Y., et al. (2023) · Figshare · doi:10.6084/m9.figshare.24558148
Mackawy, A. M. H., Alharbi, B. F., Almatroudi, A., Huq, M., Hussain, A., Wasti, A. Z., Elharbi, M. F., & Allemailem, K. S. (2025) · Breastfeeding Medicine · doi:10.1089/bfm.2024.0209 · Cited by 1
Genetic keys to microbial gut colonization
Anantharaman, K., & Martin, C. (2025) · Cell Host & Microbe · doi:10.1016/j.chom.2025.04.016
Ruan, W. H., Thapa, S., & Versalovic, J. A. (2025) · Elsevier eBooks · doi:10.1016/b978-0-323-82763-8.00005-4
Jimenez, C. R., Assalim, G., Gomes, J. F., Fernandes, M. A., Presuto, L. M., Corrêa, P. S., & Louvandini, H. (2025) · Ciência Animal Brasileira · doi:10.1590/1809-6891v26e-80984p
Priority effects determine community composition at the strain level in the honeybee gut microbiotaPreprint
Prasad, A., Santos-Matos, G., Szigeti, A., Mazel, F., & Engel, P. (2025) · bioRxiv (Cold Spring Harbor Laboratory) · doi:10.1101/2025.11.22.689826
Quan, J., Xu, C., Ruan, D., Ye, Y., Qiu, Y., Wu, J., Zhou, S., Luan, M., Zhao, X., Chen, Y., et al. (2024) · Figshare · doi:10.6084/m9.figshare.24558202
Jimenez, C. R., Assalim, G., Gomes, J. F., Fernandes, M. A., Presuto, L. M., Corrêa, P. S., & Louvandini, H. (2025) · Ciência Animal Brasileira · doi:10.1590/1809-6891v26e-80984e
Microbial adaptation under pH fluctuation: Response and molecular strategies
Joshi, H. C., Pant, P., Karki, H., Chauhan, H. K., & Joshi, S. M. (2026) · Elsevier eBooks · doi:10.1016/b978-0-443-41696-5.00018-2
Olea, X. D., Beede, K. A., Pereira, G. V., Scott, D. A., Petucci, C. J., Martens, E. C., Rodionov, D., Shah, A. S., Martinez, M. P., Kim, H., et al. (2026) · Cell Reports Medicine · doi:10.1016/j.xcrm.2026.102921 · Cited by 1
Self-citationThe type VI secretion system governs strain maintenance in a wild mammalian gut microbiomePreprint
Shen, B. A., Asfahl, K. L., Lim, B., Bertolli, S. K., Minot, S. S., Radey, M. C., Penewit, K. M., Ngo, B., Salipante, S. J., Johnston, C. D., et al. (2026) · eLife · doi:10.7554/elife.110200.2
van Best, N., & Hornef, M. W. (2026) · Springer eBooks · doi:10.1007/978-3-032-26410-7_3
Chen, Z. N., Xue, J., Chen, X., Liu, H., & Kong, Z. (2026) · Soil Biology and Biochemistry · doi:10.1016/j.soilbio.2026.110310
Metadata
- Authors
- Martínez, I., Maldonado-Gomez, M. X., Gomes-Neto, J. C., Kittana, H., Ding, H., Schmaltz, R., Joglekar, P., Cardona, R. J., Marsteller, N. L., Kembel, S. W., Benson, A. K., Peterson, D. A., Ramer-Tait, A. E., & Walter, J.
- Affiliations
- University of Nebraska–Lincoln (US)
- Department of Food Science and Technology, University of Nebraska-Lincoln, Lincoln, United States
- Johns Hopkins University (US)
- Université du Québec à Montréal (CA)
- Corresponding author
- Walter, Jens
- ORCID
- Venue
- eLife
- Publisher
- eLife Sciences Publications, Ltd
- Published
- 2018-09-18
- Volume
- 7
- ISSN
- 2050-084X (ISSN-L)
- PMC
- PMC6143339
- OpenAlex
- W2890655424
- Cited by
- 199
- References
- 91
- Citations by year
- 2026: 13 · 2025: 25 · 2024: 29 · 2023: 24 · 2022: 30 · 2021: 27 · 2020: 29 · 2019: 21 · 2018: 1
- FWCI
- 6.94
- Type
- journal article
- Language
- en
- Open access
- gold
- doi.org
- Licence
- Locations
- eLife (publishedVersion, cc-by)
- Europe PMC (PubMed Central) (publishedVersion, cc-by)
- PubMed Central (publishedVersion, cc-by)
- PubMed (publishedVersion)
- Lincoln (University of Nebraska) (submittedVersion, cc-by)
- DOAJ (DOAJ: Directory of Open Access Journals) (submittedVersion, cc-by-sa)
- Funders
- National Institutes of Health (5R01GM099525-02)
- National Institute of General Medical Sciences (1P20GM104320)
- Topics
- Life Sciences › Biochemistry, Genetics and Molecular Biology › Molecular Biology › Gut microbiota and health
- Physical Sciences › Environmental Science › Ecology › Microbial Community Ecology and Physiology
- Health Sciences › Dentistry › Periodontics › Oral microbiology and periodontitis research
- Keywords
- colonization history, priority effects, historical contingency, microbial community assembly, Rag1-deficient mice, adaptive immunity, microbial inoculation, host-associated microbiome
- MeSH terms
- Gastrointestinal Microbiome, Animals, Bacteria, Cecum, Mice, Inbred C57BL, Time Factors, Colony Count, Microbial, Homeodomain Proteins, Models, Animal, Biodiversity, Adaptive Immunity
About these checks
Registry, retraction, Cites and statistics results are computed, not judged, with one exception: a printed reference that no index lists is read once by a model before it counts as a citation error. Claims are extracted by a model and kept only when their quote appears verbatim in the text; each cited source is then checked, with a model’s help, for whether it says what the claim relies on. Those verdicts can be wrong — read the claim’s quote and the cited source before relying on one.
Statistics and arithmetic are recomputed, not judged.
Confidence bands are shown only for fields calibrated on our annotated test set. None is calibrated yet, so no band is shown.
What counts as a claim ›How we measure confidence ›How we check this ›
Are you an author, or do you see a problem with this page? Request a review
