Cited by 109

The DOI matches its Crossref record.

Structure of the CLC-1 chloride channel from Homo sapiens

Park, Eunyong, MacKinnon, Roderick·2018·eLife

Abstract

CLC channels mediate passive Cl− conduction, while CLC transporters mediate active Cl− transport coupled to H+ transport in the opposite direction. The distinction between CLC-0/1/2 channels and CLC transporters seems undetectable by amino acid sequence. To understand why they are different functionally we determined the structure of the human CLC-1 channel. Its ‘glutamate gate’ residue, known to mediate proton transfer in CLC transporters, adopts a location in the structure that appears to preclude it from its transport function. Furthermore, smaller side chains produce a wider pore near the intracellular surface, potentially reducing a kinetic barrier for Cl− conduction. When the corresponding residues are mutated in a transporter, it is converted to a channel. Finally, Cl− at key sites in the pore appear to interact with reduced affinity compared to transporters. Thus, subtle differences in glutamate gate conformation, internal pore diameter and Cl− affinity distinguish CLC channels and transporters.

Overview

The claims and statistics of this paper haven’t been checked yet.

Run the check — free, no account needed. It reads the open-access text and checks the sources it cites.

A few free checks a day · papers already verified open instantly · results are public

Integrity signals

Registry

Crossref · 10.7554/elife.36629

Cites

Statistics

Figures

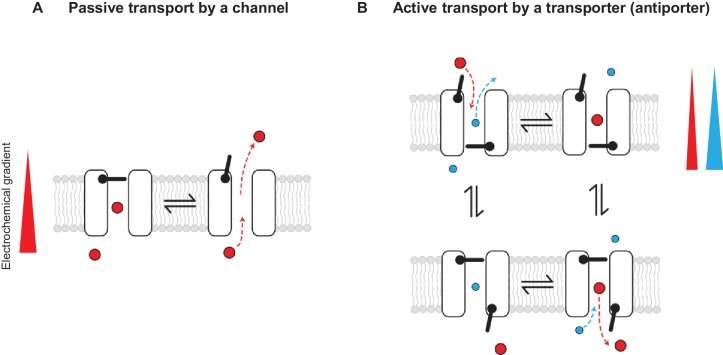
Figure 1. Passive and active transport explained by gating mechanisms. One-gate (A) and two-gate (B) models explaining passive transport by a channel and active transport by a transporter (shown is an antiporter). Direction of the solute electrochemical gradient is indicated by a wedge (the thicker end means more positive).
Figure 1. Passive and active transport explained by gating mechanisms. One-gate (A) and two-gate (B) models explaining passive transport by a channel and active transport by a transporter (shown is an antiporter). Direction of the solute electrochemical gradient is indicated by a wedge (the thicker end means more positive).CC BY · PubMed Central
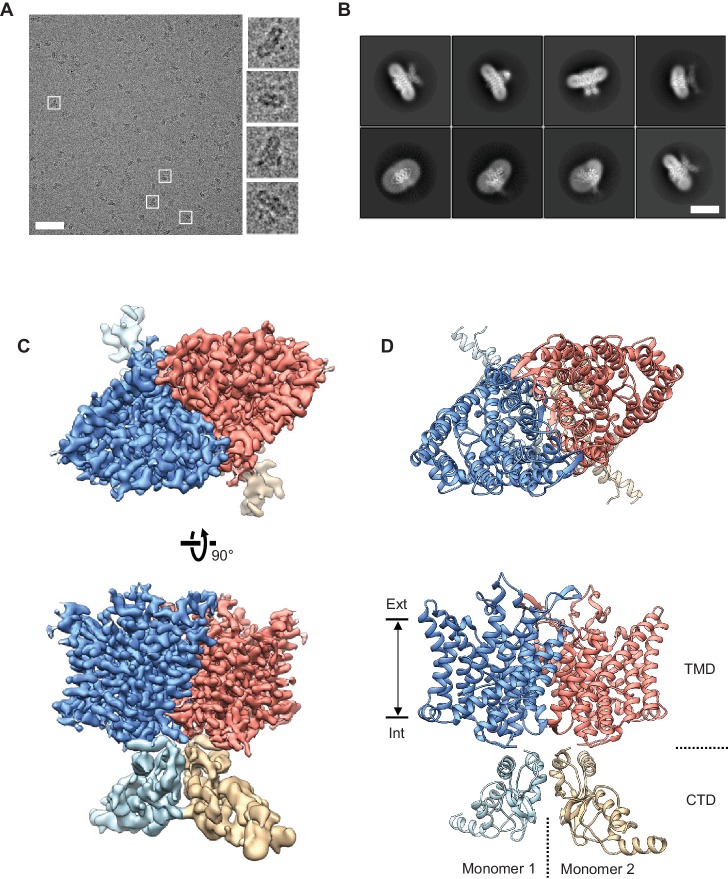
Figure 2. Cryo-EM structure of the human CLC-1 channel. (A) Representative micrograph of the purified CLC-1 channel (scale bar, 50 nm) on a cryo-EM grid. Representative particles (white squares) are magnified and shown in the right panels. (B) Images of selected 2D classes from reference-free 2D classification by RELION. Scale bar, 10 nm. (C and D) Cryo-EM density map (C) and atomic model (D) of the hCLC-1 channel. The transmembrane domain (TMD; blue and salmon) and the cytosolic domain (CTD; light blue and tan) were separately refined and combined for visualization. Ext, extracellular side. Int, intracellular side. The approximate lipid bilayer region is shown by arrows.
Figure 2. Cryo-EM structure of the human CLC-1 channel. (A) Representative micrograph of the purified CLC-1 channel (scale bar, 50 nm) on a cryo-EM grid. Representative particles (white squares) are magnified and shown in the right panels. (B) Images of selected 2D classes from reference-free 2D classification by RELION. Scale bar, 10 nm. (C and D) Cryo-EM density map (C) and atomic model (D) of the hCLC-1 channel. The transmembrane domain (TMD; blue and salmon) and the cytosolic domain (CTD; light blue and tan) were separately refined and combined for visualization. Ext, extracellular side. Int, intracellular side. The approximate lipid bilayer region is shown by arrows.CC BY · PubMed Central
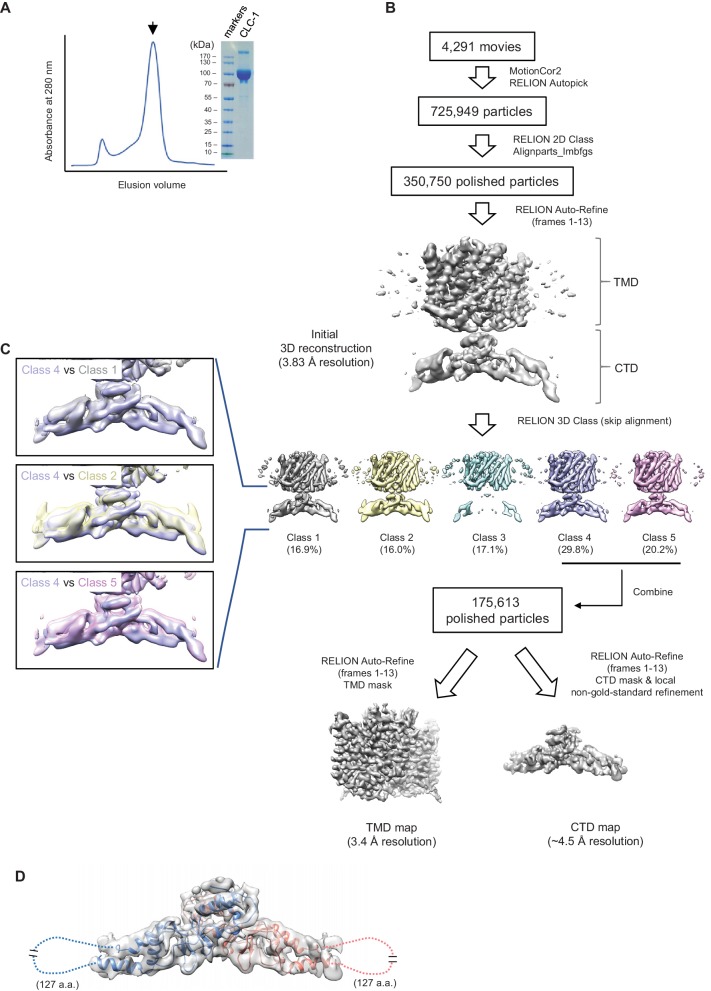
Figure 2—figure supplement 1. Sample preparation and cryo-EM image processing procedures. (A) Superdex-200 gel-filtration profile (UV absorbance at 280 nm) of affinity purified human CLC-1. Peak fractions (arrowhead) were collected for cryo-EM grid preparation and SDS-PAGE analysis (right). (B) Summary of cryo-EM image processing procedure (see the Methods section). (C) Classes indicated were aligned and superimposed to compare their CTD density. Note that there are significant mismatches between classes mainly due to pivotal movements of the two arms. (D) A model for CTD was generated by Rosetta using a crystal structure of the CLC-0 CBS domains and the CLC-1 density map. The model was superimposed (blue and salmon for each monomer) onto the CBS density map (semi-transparent gray surface). Note that density for a segment of ~127 amino acids is missing likely due to flexibility of the segment.
Figure 2—figure supplement 1. Sample preparation and cryo-EM image processing procedures. (A) Superdex-200 gel-filtration profile (UV absorbance at 280 nm) of affinity purified human CLC-1. Peak fractions (arrowhead) were collected for cryo-EM grid preparation and SDS-PAGE analysis (right). (B) Summary of cryo-EM image processing procedure (see the Methods section). (C) Classes indicated were aligned and superimposed to compare their CTD density. Note that there are significant mismatches between classes mainly due to pivotal movements of the two arms. (D) A model for CTD was generated by Rosetta using a crystal structure of the CLC-0 CBS domains and the CLC-1 density map. The model was superimposed (blue and salmon for each monomer) onto the CBS density map (semi-transparent gray surface). Note that density for a segment of ~127 amino acids is missing likely due to flexibility of the segment.CC BY · PubMed Central
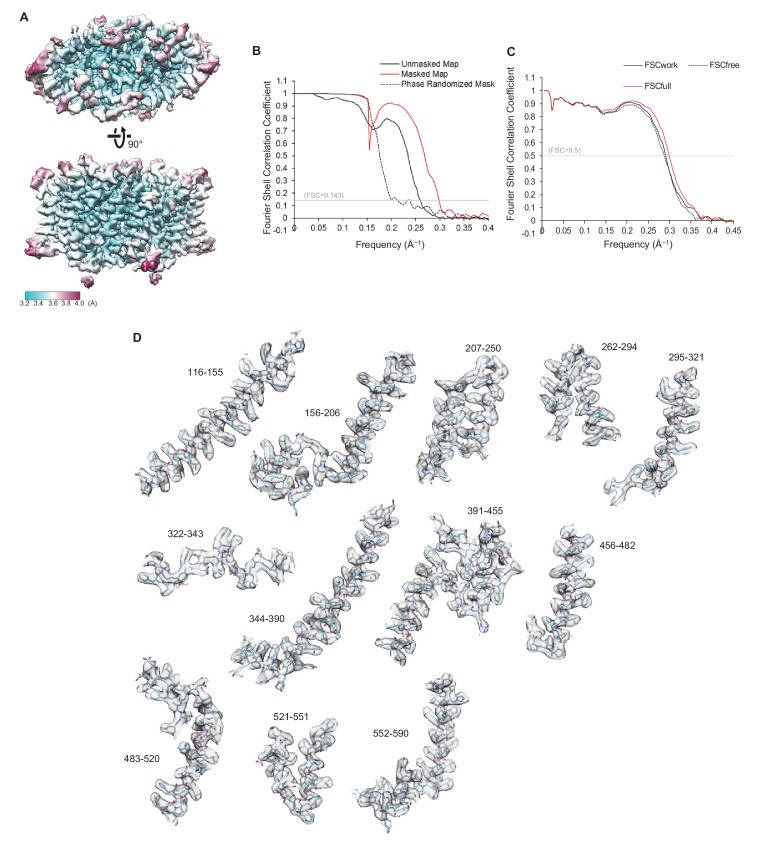
Figure 2—figure supplement 2. Quality of the cryo-EM map and atomic model of CLC-1. (A) Local resolution was estimated by the RELION program (relion_postprocess) and displayed on the TMD map. Shown is the combined map (a sum of two half maps), which is not sharpened or filtered. Top, a view from the extracellular side. Bottom, a side view. (B) Fourier shell correlation (FSC) of two half maps before (black) and after (red) masking for TMD. The masked FSC curve was corrected for masking effects during the RELION postprocessing procedure. Correlation between the map and the phase-randomized mask is shown as a black dashed line. (C) FSC between the atomic model and EM maps of the CLC-1 TMD. The red curve shows the FSC between the final refined atomic model and the combined map that the model was refined against (FSCfull). To test potential overfitting during the model refinement procedure, a test refinement was performed using the first half map. The resulting model was then compared to the first half map (FSCwork; solid black curve) and the second half map (FSCfree; dashed black curve). Similarity of the two curves indicates that overfitting is insignificant. (D) Segments of the TMD model in stick representation were superimposed with EM density (semi-transparent gray surface). Numbers indicate amino acid positions of segments. The density map was sharpened with a B-factor of −97 Å2 and low-pass filtered at 3.4 Å.
Figure 2—figure supplement 2. Quality of the cryo-EM map and atomic model of CLC-1. (A) Local resolution was estimated by the RELION program (relion_postprocess) and displayed on the TMD map. Shown is the combined map (a sum of two half maps), which is not sharpened or filtered. Top, a view from the extracellular side. Bottom, a side view. (B) Fourier shell correlation (FSC) of two half maps before (black) and after (red) masking for TMD. The masked FSC curve was corrected for masking effects during the RELION postprocessing procedure. Correlation between the map and the phase-randomized mask is shown as a black dashed line. (C) FSC between the atomic model and EM maps of the CLC-1 TMD. The red curve shows the FSC between the final refined atomic model and the combined map that the model was refined against (FSCfull). To test potential overfitting during the model refinement procedure, a test refinement was performed using the first half map. The resulting model was then compared to the first half map (FSCwork; solid black curve) and the second half map (FSCfree; dashed black curve). Similarity of the two curves indicates that overfitting is insignificant. (D) Segments of the TMD model in stick representation were superimposed with EM density (semi-transparent gray surface). Numbers indicate amino acid positions of segments. The density map was sharpened with a B-factor of −97 Å2 and low-pass filtered at 3.4 Å.CC BY · PubMed Central
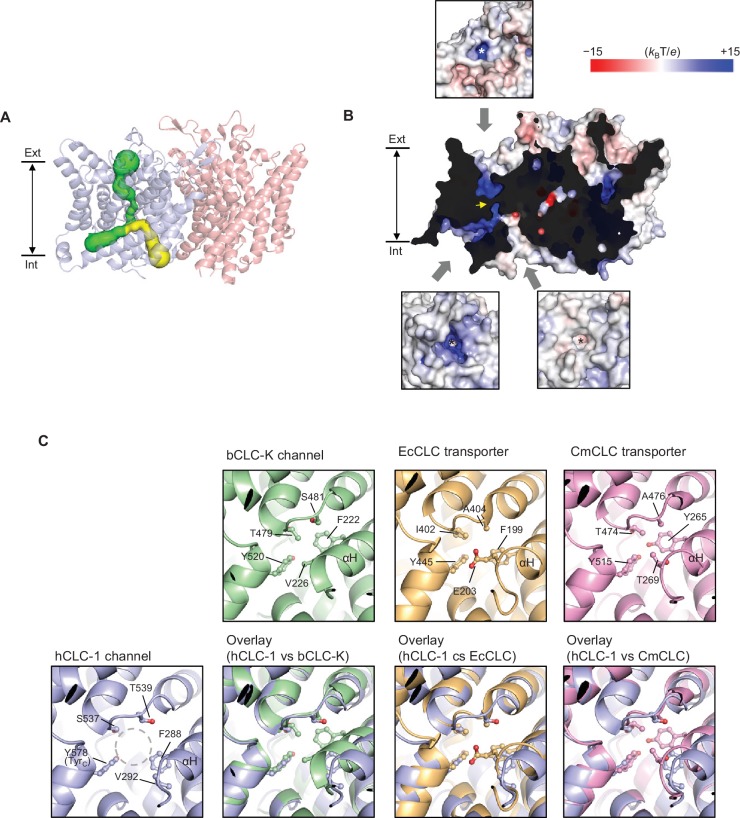
Figure 3. Bifurcated pore structure of the CLC-1 channel. (A) The canonical Cl− transport pathway (green) and the second intracellular pore (yellow) are depicted in a side view of CLC-1. The pores of only one monomer are shown for simplicity. (B) Surface electrostatistics of CLC-1’s pore lining. The protein surface was clipped to show optimally the pore lining of the CLC-1 monomer on the left. The yellow arrowhead indicates the position of the selectivity filter. The insets show views into the pore entrances, which are marked with asterisks. (C) A view into the second intracellular pore entrance from the cytosolic surface was compared to equivalent views with other CLC proteins. In the CLC-1 panel, the pore is indicated by a dashed gray circle. Amino acids lining the pore were indicated with their side chain atoms shown in ball-and-stick representation.
Figure 3. Bifurcated pore structure of the CLC-1 channel. (A) The canonical Cl− transport pathway (green) and the second intracellular pore (yellow) are depicted in a side view of CLC-1. The pores of only one monomer are shown for simplicity. (B) Surface electrostatistics of CLC-1’s pore lining. The protein surface was clipped to show optimally the pore lining of the CLC-1 monomer on the left. The yellow arrowhead indicates the position of the selectivity filter. The insets show views into the pore entrances, which are marked with asterisks. (C) A view into the second intracellular pore entrance from the cytosolic surface was compared to equivalent views with other CLC proteins. In the CLC-1 panel, the pore is indicated by a dashed gray circle. Amino acids lining the pore were indicated with their side chain atoms shown in ball-and-stick representation.CC BY · PubMed Central
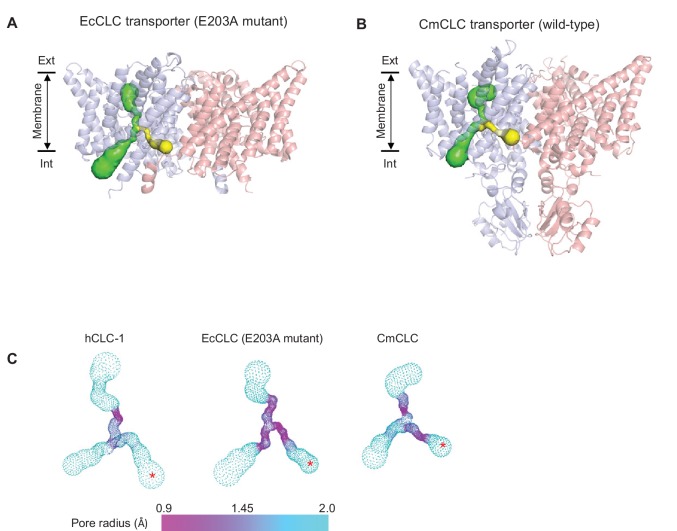
Figure 3—figure supplement 1. Comparison of the second intracellular pore among CLC proteins. (A) and (B) As in Figure 2A, pores in the protein interior were detected in EcCLC (A) and CmCLC (B) transporters using the Caver program. The canonical Cl− transport pathway and the second intracellular pore are shown as green and yellow surfaces, respectively, superimposed on ribbon representations of the proteins (side view). For simplicity, pores of only one monomer (blue) are shown. Note that the second intracellular pore (minimal radius larger than 0.9 Å) could be detected only with the E203 mutant of the EcCLC and wild-type CmCLC transporters, not with the wild-type EcCLC or the bovine CLC-K channel (not shown). (C) The pore radii are displayed as a color map. The second intracellular pore is indicated by a red asterisk. The view angle is similar to (A) and (B).
Figure 3—figure supplement 1. Comparison of the second intracellular pore among CLC proteins. (A) and (B) As in Figure 2A, pores in the protein interior were detected in EcCLC (A) and CmCLC (B) transporters using the Caver program. The canonical Cl− transport pathway and the second intracellular pore are shown as green and yellow surfaces, respectively, superimposed on ribbon representations of the proteins (side view). For simplicity, pores of only one monomer (blue) are shown. Note that the second intracellular pore (minimal radius larger than 0.9 Å) could be detected only with the E203 mutant of the EcCLC and wild-type CmCLC transporters, not with the wild-type EcCLC or the bovine CLC-K channel (not shown). (C) The pore radii are displayed as a color map. The second intracellular pore is indicated by a red asterisk. The view angle is similar to (A) and (B).CC BY · PubMed Central
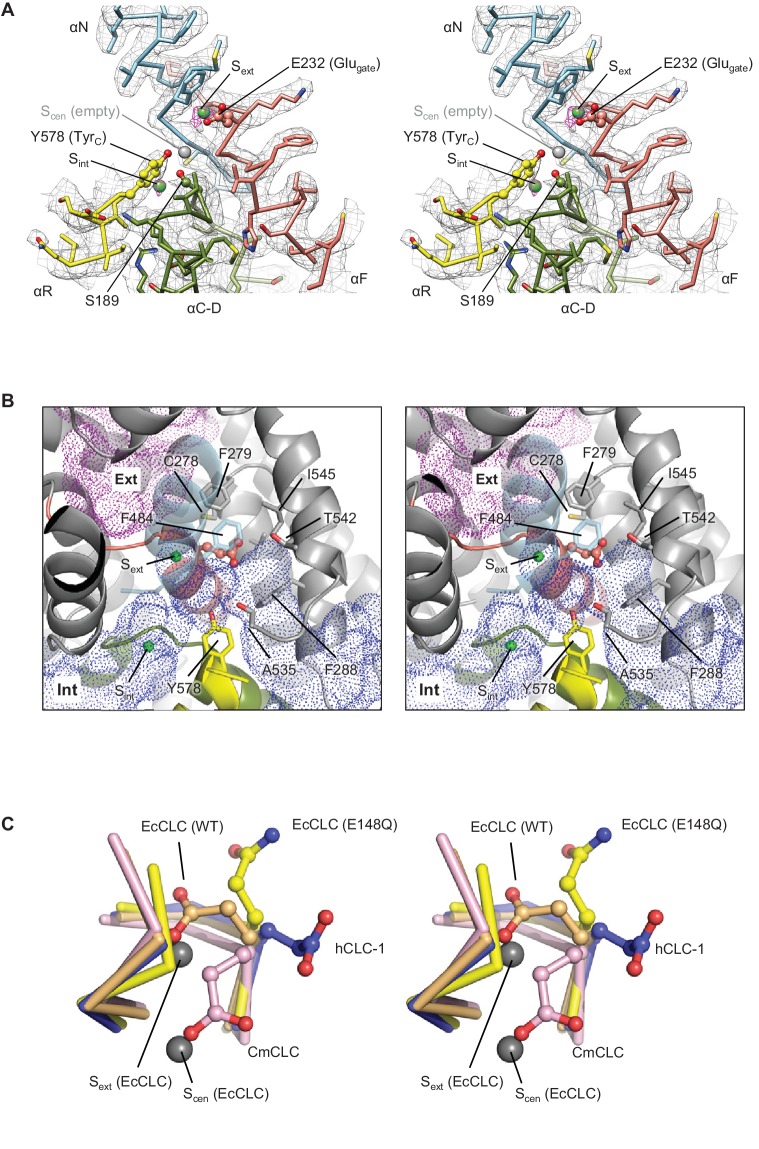
Figure 4. Glutamate gate (Glugate) and Cl−-binding sites of CLC-1. (A) View (stereo) into the selectivity filter of CLC-1. αN, αF, αR, and αC-D segments (Cα trace and side chains) are shown in cyan, salmon, yellow, and olive, respectively. The side chains of Glugate, TyrC, and SerC are represented with balls and sticks. Cl−-binding sites are indicated by green (Sext and Sint) and gray (Scen) spheres. The cryo-EM density map is shown in mesh (Sext and Sint in magenta and the rest in gray). (B) Water-accessible regions in the filter region, probed by Hollow (Ho and Gruswitz, 2008), are shown with purple (extracellular vestibule) and blue (intracellular vestibule) dots. Glugate is represented in ball-and-stick. (C) Comparison of Glugate positions between the CLC-1 channel and CLC transporters. The amino acid segments 146–149 and 355–358 forming the anion selectivity filter were aligned between structures. Cα-traces of the segments are shown with the Glugate side chains in ball-and-stick representation. Blue, CLC-1. Light orange, WT EcCLC (PDB ID: 1OTS). Yellow, EcCLC E148Q mutant (PDB ID: 1OTU). Magenta, CmCLC (PDB ID: 3ORG). Gray spheres represent the positions of Cl− ions seen in EcCLC E148Q mutant (Sext and Scen). Note that the Cl− ion at CLC-1’s Sext (not shown) essentially coincides with Sext of EcCLC.
Figure 4. Glutamate gate (Glugate) and Cl−-binding sites of CLC-1. (A) View (stereo) into the selectivity filter of CLC-1. αN, αF, αR, and αC-D segments (Cα trace and side chains) are shown in cyan, salmon, yellow, and olive, respectively. The side chains of Glugate, TyrC, and SerC are represented with balls and sticks. Cl−-binding sites are indicated by green (Sext and Sint) and gray (Scen) spheres. The cryo-EM density map is shown in mesh (Sext and Sint in magenta and the rest in gray). (B) Water-accessible regions in the filter region, probed by Hollow (Ho and Gruswitz, 2008), are shown with purple (extracellular vestibule) and blue (intracellular vestibule) dots. Glugate is represented in ball-and-stick. (C) Comparison of Glugate positions between the CLC-1 channel and CLC transporters. The amino acid segments 146–149 and 355–358 forming the anion selectivity filter were aligned between structures. Cα-traces of the segments are shown with the Glugate side chains in ball-and-stick representation. Blue, CLC-1. Light orange, WT EcCLC (PDB ID: 1OTS). Yellow, EcCLC E148Q mutant (PDB ID: 1OTU). Magenta, CmCLC (PDB ID: 3ORG). Gray spheres represent the positions of Cl− ions seen in EcCLC E148Q mutant (Sext and Scen). Note that the Cl− ion at CLC-1’s Sext (not shown) essentially coincides with Sext of EcCLC.CC BY · PubMed Central
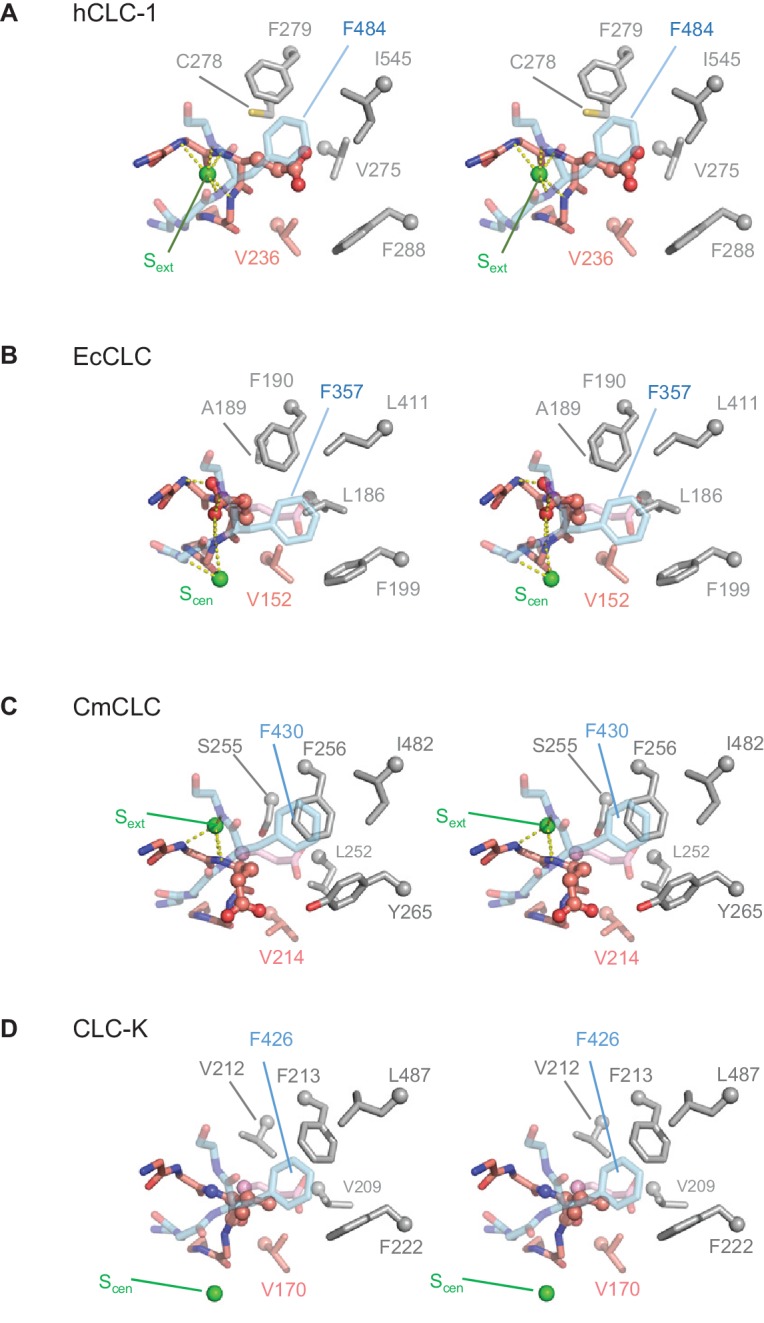
Figure 4—figure supplement 1. Comparison of the anion selectivity filter and Glugate between CLC proteins. (A–D) As in Figure 3B, but focused on Glugate and neighboring hydrophobic amino acids (stereo views with the same view angle). (B–D) also include superimposed Glugate of CLC-1 in pink semi-transparent sticks, to show steric clashes with neighboring hydrophobic amino acid side chains of other CLC proteins. The green spheres indicate the position of Sext or Scen. Note that in the EcCLC and CmCLC structures, Glugate’s side chain occupies Sext and Scen, respectively, and in the bCLC-K, Sext is unoccupied.
Figure 4—figure supplement 1. Comparison of the anion selectivity filter and Glugate between CLC proteins. (A–D) As in Figure 3B, but focused on Glugate and neighboring hydrophobic amino acids (stereo views with the same view angle). (B–D) also include superimposed Glugate of CLC-1 in pink semi-transparent sticks, to show steric clashes with neighboring hydrophobic amino acid side chains of other CLC proteins. The green spheres indicate the position of Sext or Scen. Note that in the EcCLC and CmCLC structures, Glugate’s side chain occupies Sext and Scen, respectively, and in the bCLC-K, Sext is unoccupied.CC BY · PubMed Central
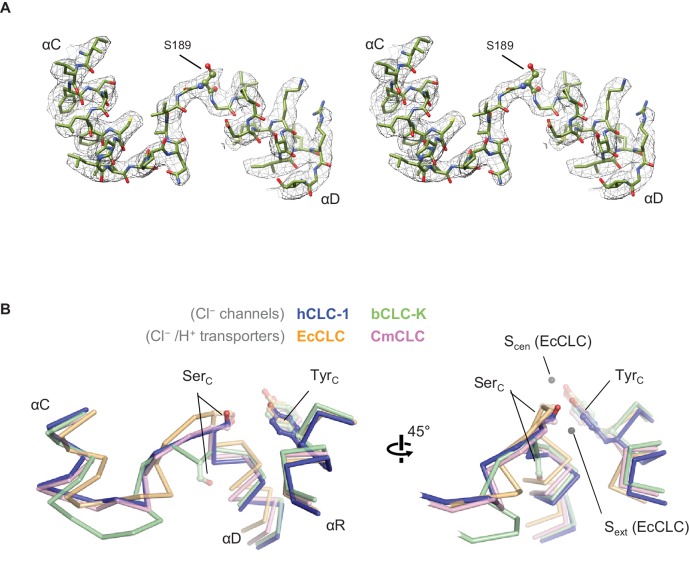
Figure 5. Structure of the αC-D loop and SerC. (A) Atomic model and cryo-EM density of the CLC-1 αC-D. (B) Comparison of the αC-D and αR segments (shown in Cα-only trace) among CLC channels and transporters. The side chains of SerC and TyrC are shown in sticks.
Figure 5. Structure of the αC-D loop and SerC. (A) Atomic model and cryo-EM density of the CLC-1 αC-D. (B) Comparison of the αC-D and αR segments (shown in Cα-only trace) among CLC channels and transporters. The side chains of SerC and TyrC are shown in sticks.CC BY · PubMed Central
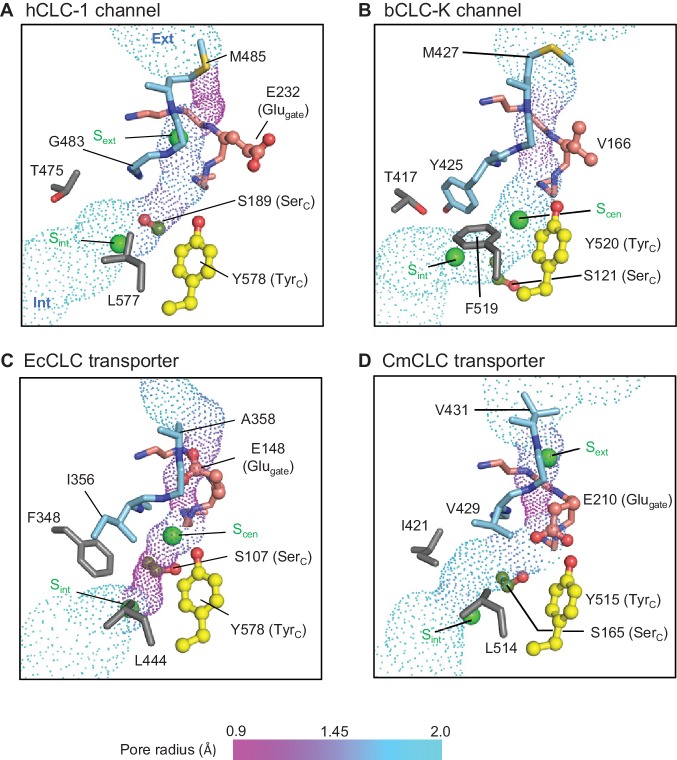
Figure 6. Profile of the Cl− transport pore and the kinetic barrier between Scen and Sint. Pore structures along the Cl− pathway are shown in dot representation together with amino acids around it. Glugate, TyrC, and SerC side chains are shown in ball-and-stick representation. The color scheme is the same as in Figure 4. Pore-lining amino acids that are distinctive between CLC channels and transporters are shown in gray.
Figure 6. Profile of the Cl− transport pore and the kinetic barrier between Scen and Sint. Pore structures along the Cl− pathway are shown in dot representation together with amino acids around it. Glugate, TyrC, and SerC side chains are shown in ball-and-stick representation. The color scheme is the same as in Figure 4. Pore-lining amino acids that are distinctive between CLC channels and transporters are shown in gray.CC BY · PubMed Central
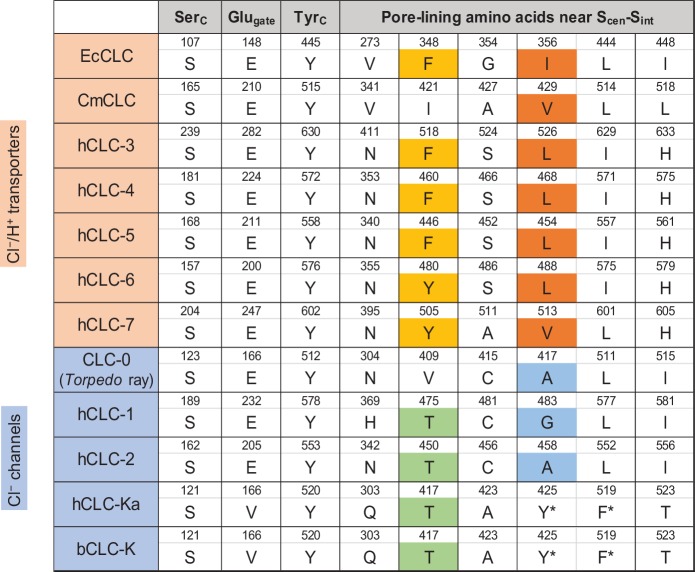
Figure 6—figure supplement 1. Sequence comparison of selected amino acids forming the ion selectivity filter and the pore lining. Amino acids and their positions (numbers) of selected residues in the filter and pore lining are indicated. For transporters, E. coli CLC (EcCLC), C. merolae CLC (CmCLC), and human CLC transporters (hCLC-3 to hCLC-7) were selected. For channels, Torpedo marmorata CLC-0, human CLC channels (hCLC-1, hCLC-2, and hCLC-Ka), and bovine CLC-K (bCLC-K) channel were included. Amino acids showing a pattern distinguishing channels and transporters were highlighted (positions 348 and 356 in EcCLC). Note that in hCLC-Ka and bCLC-K, the side chains of tyrosine and phenylalanine, denoted by an asterisk, are involved in binding of a Cl− ion at Scen by quadrupole-anion interactions (see Figure 6D).
Figure 6—figure supplement 1. Sequence comparison of selected amino acids forming the ion selectivity filter and the pore lining. Amino acids and their positions (numbers) of selected residues in the filter and pore lining are indicated. For transporters, E. coli CLC (EcCLC), C. merolae CLC (CmCLC), and human CLC transporters (hCLC-3 to hCLC-7) were selected. For channels, Torpedo marmorata CLC-0, human CLC channels (hCLC-1, hCLC-2, and hCLC-Ka), and bovine CLC-K (bCLC-K) channel were included. Amino acids showing a pattern distinguishing channels and transporters were highlighted (positions 348 and 356 in EcCLC). Note that in hCLC-Ka and bCLC-K, the side chains of tyrosine and phenylalanine, denoted by an asterisk, are involved in binding of a Cl− ion at Scen by quadrupole-anion interactions (see Figure 6D).CC BY · PubMed Central
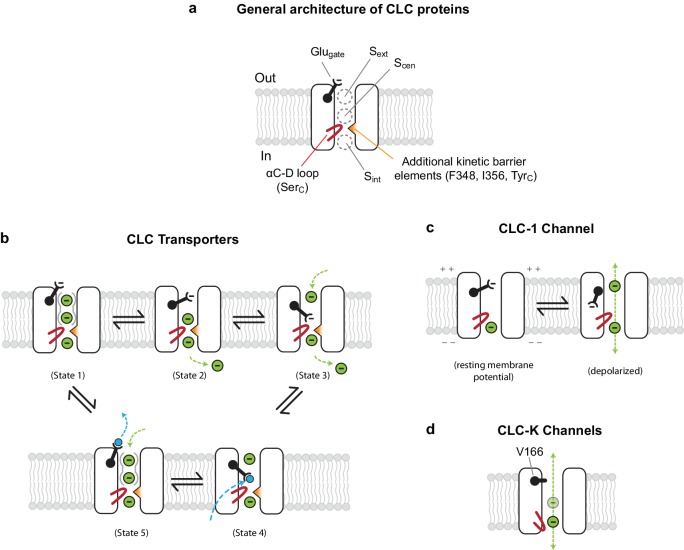
Figure 7. Models for ion transport mechanisms of CLC transporters and channels. (A) General architecture of CLC proteins. F348 and I356 are labelled according to E. coli transporter (EcCLC) numbering. (B) Model for 2:1 Cl−/H+ exchange by CLC transporters. The negatively-charged carboxylic group of the Glugate side chain can occupy Sext (state 2) or Scen (state 3) by a swinging motion, competing with a Cl− ion for binding therein. When protonated at Scen by a proton transferred from the cytosol (state 4), the Glugate side chain flips out to the extracellular side (state5). The kinetic barrier between Scen and Sint would prevent leakage of Cl− ions through the open pore during this transient step. Also, as seen previously with EcCLC (Picollo et al., 2009), synergistic binding of two Cl− ions at Sext and Scen (depicted by solid gray curves around Sext and Scen) might further deter slippage of Cl− ions. Deprotonation resets the cycle (state1). The cycle is reversible, and for simplicity the intermediate steps were omitted. Cl− ions and H+ are depicted as green and blue spheres, respectively. (C) Model for the CLC-1 channel. The cryo-EM structure of CLC-1 presented in this study represents the depolarized state. Although the conformation of the αC-D loop remains similar to that of transporters, CLC-1’s kinetic barrier is lower than transporters due to the lack of additional kinetic barrier elements. In addition, weak Cl−-binding affinity at Scen might facilitate rapid permeation of Cl− ions along the pore. When the membrane potential is negative (resting), the Glugate side chain may occupy Sext or Scen as in transporters, blocking the pore. (D) Model for CLC-K channels. The outer gate is removed by a natural mutation of Glugate to valine (V166). The kinetic barrier is largely reduced due to a flip-down of SerC, as well as lack of other kinetic barrier elements. The cryo-EM structure suggested that Sext and Scen have weaker Cl−-binding affinity than transporters (empty and with a semi-transparent Cl− sphere).
Figure 7. Models for ion transport mechanisms of CLC transporters and channels. (A) General architecture of CLC proteins. F348 and I356 are labelled according to E. coli transporter (EcCLC) numbering. (B) Model for 2:1 Cl−/H+ exchange by CLC transporters. The negatively-charged carboxylic group of the Glugate side chain can occupy Sext (state 2) or Scen (state 3) by a swinging motion, competing with a Cl− ion for binding therein. When protonated at Scen by a proton transferred from the cytosol (state 4), the Glugate side chain flips out to the extracellular side (state5). The kinetic barrier between Scen and Sint would prevent leakage of Cl− ions through the open pore during this transient step. Also, as seen previously with EcCLC (Picollo et al., 2009), synergistic binding of two Cl− ions at Sext and Scen (depicted by solid gray curves around Sext and Scen) might further deter slippage of Cl− ions. Deprotonation resets the cycle (state1). The cycle is reversible, and for simplicity the intermediate steps were omitted. Cl− ions and H+ are depicted as green and blue spheres, respectively. (C) Model for the CLC-1 channel. The cryo-EM structure of CLC-1 presented in this study represents the depolarized state. Although the conformation of the αC-D loop remains similar to that of transporters, CLC-1’s kinetic barrier is lower than transporters due to the lack of additional kinetic barrier elements. In addition, weak Cl−-binding affinity at Scen might facilitate rapid permeation of Cl− ions along the pore. When the membrane potential is negative (resting), the Glugate side chain may occupy Sext or Scen as in transporters, blocking the pore. (D) Model for CLC-K channels. The outer gate is removed by a natural mutation of Glugate to valine (V166). The kinetic barrier is largely reduced due to a flip-down of SerC, as well as lack of other kinetic barrier elements. The cryo-EM structure suggested that Sext and Scen have weaker Cl−-binding affinity than transporters (empty and with a semi-transparent Cl− sphere).CC BY · PubMed Central
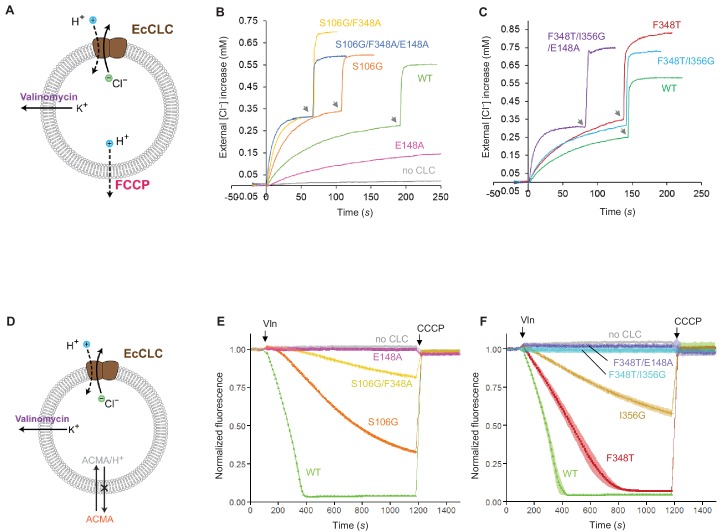
Figure 8. Effects of Glugate and kinetic barrier mutations on Cl− and H+ transport activities of EcCLC. (A) Schematics of the Cl− dump assay to measure the Cl− transport rate of EcCLC. Purified EcCLC protein is reconstituted into proteoliposomes containing 300 mM KCl inside. Buffer outside the liposomes was reduced to 150 mM K2SO4, lowering the Cl− concentration outside to ~1 mM. Transmembrane ion flux was initiated by addition of the K+-ionophore valinomycin (Vln) and the protonophore carbonyl cyanide-4-(trifluoromethoxy)phenylhydrazone (FCCP). Increase of the Cl− concentration outside the liposomes was monitored using a Cl−-selective electrode. (B) and (C) Examples of raw traces of Cl− dump assays. Vln/FCCP was added at t = 0. the gray arrowheads indicate addition of the β-octyl glucoside detergent to the reaction to release all Cl− from liposomes. (D) Schematics of the fluorescence-based H+ influx assay to measure the H+ transport activity of EcCLC. EcCLC proteoliposomes containing 450 mM KCl inside were diluted to buffer containing 450 mM potassium gluconate, lowering Cl− concentration outside to ~30 mM. The flux was initiated by addition of valinomycin at t = 100 s. As H+ are transported into the vesicles by EcCLC, intravesicular pH drops, which can be monitored by the quenching of 9-amino-6-chloro-2-methoxyacridine (ACMA) fluorescence. At the end of experiments (t = 1200 s), the protonophore carbonyl cyanide m-chlorophenylhydrazone (CCCP) was added to release all H+ from the vesicles. (E) and (F) Examples of normalized fluorescence traces of ACMA-based H+ influx assay. Shown are means (line and symbols) and s.e.m. (band) of 4 experiments.
Figure 8. Effects of Glugate and kinetic barrier mutations on Cl− and H+ transport activities of EcCLC. (A) Schematics of the Cl− dump assay to measure the Cl− transport rate of EcCLC. Purified EcCLC protein is reconstituted into proteoliposomes containing 300 mM KCl inside. Buffer outside the liposomes was reduced to 150 mM K2SO4, lowering the Cl− concentration outside to ~1 mM. Transmembrane ion flux was initiated by addition of the K+-ionophore valinomycin (Vln) and the protonophore carbonyl cyanide-4-(trifluoromethoxy)phenylhydrazone (FCCP). Increase of the Cl− concentration outside the liposomes was monitored using a Cl−-selective electrode. (B) and (C) Examples of raw traces of Cl− dump assays. Vln/FCCP was added at t = 0. the gray arrowheads indicate addition of the β-octyl glucoside detergent to the reaction to release all Cl− from liposomes. (D) Schematics of the fluorescence-based H+ influx assay to measure the H+ transport activity of EcCLC. EcCLC proteoliposomes containing 450 mM KCl inside were diluted to buffer containing 450 mM potassium gluconate, lowering Cl− concentration outside to ~30 mM. The flux was initiated by addition of valinomycin at t = 100 s. As H+ are transported into the vesicles by EcCLC, intravesicular pH drops, which can be monitored by the quenching of 9-amino-6-chloro-2-methoxyacridine (ACMA) fluorescence. At the end of experiments (t = 1200 s), the protonophore carbonyl cyanide m-chlorophenylhydrazone (CCCP) was added to release all H+ from the vesicles. (E) and (F) Examples of normalized fluorescence traces of ACMA-based H+ influx assay. Shown are means (line and symbols) and s.e.m. (band) of 4 experiments.CC BY · PubMed Central
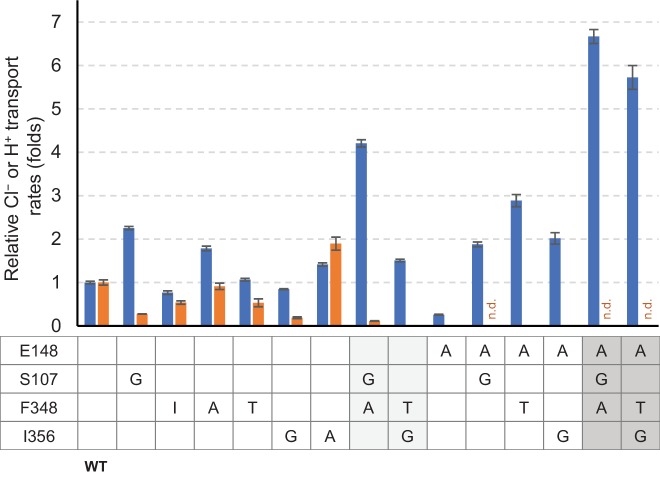
Figure 8—figure supplement 1. Summary of relative Cl− and H+ transport activities of EcCLC mutants. Cl− (blue bars) and H+ (orange bars) transport rates of EcCLC mutants were calculated from raw data (Figure 8) as described in the Materials and methods section and shown as relative values with respect to the values of wildtype EcCLC. The Cl− transport measurement assay allows quantification of Cl− turnover rates, which was 800 s−1 per monomer for wildtype EcCLC. Error bars, s.e.m. (n = 4 or 5). n.d., not determined.
Figure 8—figure supplement 1. Summary of relative Cl− and H+ transport activities of EcCLC mutants. Cl− (blue bars) and H+ (orange bars) transport rates of EcCLC mutants were calculated from raw data (Figure 8) as described in the Materials and methods section and shown as relative values with respect to the values of wildtype EcCLC. The Cl− transport measurement assay allows quantification of Cl− turnover rates, which was 800 s−1 per monomer for wildtype EcCLC. Error bars, s.e.m. (n = 4 or 5). n.d., not determined.CC BY · PubMed Central

Verification

Claims the paper makes

The claims and statistics of this paper haven’t been checked yet.

Run the check — free, no account needed. It reads the open-access text and checks the sources it cites.

A few free checks a day · papers already verified open instantly · results are public

Claims other papers make about this one

Each is checked against this paper’s own text: does it say what the citing paper says it does?

Self-check

Percentages, sums and reported differences re-computed from the paper’s own numbers.

The self-check needs the paper’s full text.

Citations

Cites

No references could be resolved yet.

Research works printed but not linked: 62

  1. Accardi, 2004, Ionic currents mediated by a prokaryotic homologue of CLC Cl- channels, The Journal of General Physiology, 123, 109, 10.1085/jgp.200308935 · DOI
  2. Accardi, 2004, Secondary active transport mediated by a prokaryotic homologue of ClC Cl- channels, Nature, 427, 803, 10.1038/nature02314 · DOI
  3. Accardi, 2006, Synergism between halide binding and proton transport in a CLC-type exchanger, Journal of Molecular Biology, 362, 691, 10.1016/j.jmb.2006.07.081 · DOI · Paper page
  4. Accardi, 2010, CLC channels and transporters: proteins with borderline personalities, Biochimica et Biophysica Acta (BBA) - Biomembranes, 1798, 1457, 10.1016/j.bbamem.2010.02.022 · DOI
  5. Baker, 2001, Electrostatics of nanosystems: application to microtubules and the ribosome, PNAS, 98, 10037, 10.1073/pnas.181342398 · DOI
  6. Basilio, 2014, Conformational changes required for H(+)/Cl(-) exchange mediated by a CLC transporter, Nature Structural & Molecular Biology, 21, 456, 10.1038/nsmb.2814 · DOI
  7. Chen, 2010, MolProbity: all-atom structure validation for macromolecular crystallography, Acta Crystallographica Section D Biological Crystallography, 66, 12, 10.1107/S0907444909042073 · DOI · Paper page
  8. Chovancova, 2012, CAVER 3.0: a tool for the analysis of transport pathways in dynamic protein structures, PLoS Computational Biology, 8, e1002708, 10.1371/journal.pcbi.1002708 · DOI
  9. Dutzler, 2002, X-ray structure of a ClC chloride channel at 3.0 A reveals the molecular basis of anion selectivity, Nature, 415, 287, 10.1038/415287a · DOI · Paper page
  10. Dutzler, 2003, Gating the selectivity filter in ClC chloride channels, Science, 300, 108, 10.1126/science.1082708 · DOI · Paper page
  11. Emsley, 2010, Features and development of Coot, Acta Crystallographica Section D Biological Crystallography, 66, 486, 10.1107/S0907444910007493 · DOI · Paper page
  12. Estévez, 2004, Functional and structural conservation of CBS domains from CLC chloride channels, The Journal of Physiology, 557, 363, 10.1113/jphysiol.2003.058453 · DOI
  13. Fahlke, 1996, Mechanism of voltage-dependent gating in skeletal muscle chloride channels, Biophysical Journal, 71, 695, 10.1016/S0006-3495(96)79269-X · DOI
  14. Fahlke, 1997, Pore-forming segments in voltage-gated chloride channels, Nature, 390, 529, 10.1038/37391 · DOI
  15. Feng, 2010, Structure of a eukaryotic CLC transporter defines an intermediate state in the transport cycle, Science, 330, 635, 10.1126/science.1195230 · DOI · Paper page
  16. Feng, 2012, Molecular mechanism of proton transport in CLC Cl-/H+ exchange transporters, PNAS, 109, 11699, 10.1073/pnas.1205764109 · DOI · Paper page
  17. Gadsby, 2009, Ion channels versus ion pumps: the principal difference, in principle, Nature Reviews Molecular Cell Biology, 10, 344, 10.1038/nrm2668 · DOI
  18. George, 1993, Molecular basis of Thomsen's disease (autosomal dominant myotonia congenita), Nature Genetics, 3, 305, 10.1038/ng0493-305 · DOI
  19. Goehring, 2014, Screening and large-scale expression of membrane proteins in mammalian cells for structural studies, Nature Protocols, 9, 2574, 10.1038/nprot.2014.173 · DOI
  20. Gradogna, 2010, A regulatory calcium-binding site at the subunit interface of CLC-K kidney chloride channels, The Journal of General Physiology, 136, 311, 10.1085/jgp.201010455 · DOI
  21. Ho, 2008, HOLLOW: generating accurate representations of channel and interior surfaces in molecular structures, BMC Structural Biology, 8, 49, 10.1186/1472-6807-8-49 · DOI
  22. Isom, 2010, Charges in the hydrophobic interior of proteins, PNAS, 107, 16096, 10.1073/pnas.1004213107 · DOI
  23. Jayaram, 2008, Ion permeation through a Cl--selective channel designed from a CLC Cl-/H+ exchanger, PNAS, 105, 11194, 10.1073/pnas.0804503105 · DOI · Paper page
  24. Jayaram, 2011, Structure of a slow CLC Cl⁻/H+ antiporter from a cyanobacterium, Biochemistry, 50, 788, 10.1021/bi1019258 · DOI
  25. Jentsch, 1990, Primary structure of Torpedo marmorata chloride channel isolated by expression cloning in Xenopus oocytes, Nature, 348, 510, 10.1038/348510a0 · DOI
  26. Khantwal, 2016, Revealing an outward-facing open conformational state in a CLC cl(-)/H(+) exchange transporter, eLife, 5, e11189, 10.7554/eLife.11189 · DOI
  27. Kimanius, 2016, Accelerated cryo-EM structure determination with parallelisation using GPUs in RELION-2, eLife, 5, e18722, 10.7554/eLife.18722 · DOI
  28. Koch, 1992, The skeletal muscle chloride channel in dominant and recessive human myotonia, Science, 257, 797, 10.1126/science.1379744 · DOI
  29. L'Hoste, 2013, Characterization of the mouse ClC-K1/Barttin chloride channel, Biochimica et Biophysica Acta (BBA) - Biomembranes, 1828, 2399, 10.1016/j.bbamem.2013.06.012 · DOI
  30. Lim, 2009, Intracellular proton-transfer mutants in a CLC cl-/H+ exchanger, The Journal of General Physiology, 133, 131, 10.1085/jgp.200810112 · DOI
  31. Lim, 2012, Intracellular proton access in a Cl(-)/H(+) antiporter, PLoS Biology, 10, e1001441, 10.1371/journal.pbio.1001441 · DOI
  32. Lobet, 2006, Ion-binding properties of the ClC chloride selectivity filter, The EMBO Journal, 25, 24, 10.1038/sj.emboj.7600909 · DOI
  33. Lorenz, 1994, Genomic organization of the human muscle chloride channel CIC-1 and analysis of novel mutations leading to Becker-type myotonia, Human Molecular Genetics, 3, 941, 10.1093/hmg/3.6.941 · DOI
  34. Ludewig, 1996, Two physically distinct pores in the dimeric ClC-0 chloride channel, Nature, 383, 340, 10.1038/383340a0 · DOI
  35. Lísal, 2008, The ClC-0 chloride channel is a 'broken' Cl-/H+ antiporter, Nature Structural & Molecular Biology, 15, 805, 10.1038/nsmb.1466 · DOI · Paper page
  36. Mastronarde, 2005, Automated electron microscope tomography using robust prediction of specimen movements, Journal of Structural Biology, 152, 36, 10.1016/j.jsb.2005.07.007 · DOI
  37. Meyer, 2006, Crystal structure of the cytoplasmic domain of the chloride channel ClC-0, Structure, 14, 299, 10.1016/j.str.2005.10.008 · DOI
  38. Miller, 1984, Dimeric structure of single chloride channels from Torpedo electroplax, PNAS, 81, 2772, 10.1073/pnas.81.9.2772 · DOI
  39. Miller, 2006, ClC chloride channels viewed through a transporter lens, Nature, 440, 484, 10.1038/nature04713 · DOI
  40. Nguitragool, 2006, Uncoupling of a CLC Cl-/H+ exchange transporter by polyatomic anions, Journal of Molecular Biology, 362, 682, 10.1016/j.jmb.2006.07.006 · DOI
  41. Niemeyer, 2009, Voltage-dependent and -independent titration of specific residues accounts for complex gating of a ClC chloride channel by extracellular protons, The Journal of Physiology, 587, 1387, 10.1113/jphysiol.2008.167353 · DOI
  42. Park, 2017, Structure of a CLC chloride ion channel by cryo-electron microscopy, Nature, 541, 500, 10.1038/nature20812 · DOI · Paper page
  43. Pettersen, 2004, UCSF Chimera--a visualization system for exploratory research and analysis, Journal of Computational Chemistry, 25, 1605, 10.1002/jcc.20084 · DOI
  44. Phillips, 2012, Surprises from an unusual CLC homolog, Biophysical Journal, 103, L44, 10.1016/j.bpj.2012.08.063 · DOI
  45. Picollo, 2005, Chloride/proton antiporter activity of mammalian CLC proteins ClC-4 and ClC-5, Nature, 436, 420, 10.1038/nature03720 · DOI
  46. Picollo, 2009, Basis of substrate binding and conservation of selectivity in the CLC family of channels and transporters, Nature Structural & Molecular Biology, 16, 1294, 10.1038/nsmb.1704 · DOI
  47. Pusch, 1995, Mutations in dominant human myotonia congenita drastically alter the voltage dependence of the CIC-1 chloride channel, Neuron, 15, 1455, 10.1016/0896-6273(95)90023-3 · DOI
  48. Rohou, 2015, CTFFIND4: Fast and accurate defocus estimation from electron micrographs, Journal of Structural Biology, 192, 216, 10.1016/j.jsb.2015.08.008 · DOI
  49. Rubinstein, 2015, Alignment of cryo-EM movies of individual particles by optimization of image translations, Journal of Structural Biology, 192, 188, 10.1016/j.jsb.2015.08.007 · DOI
  50. Rychkov, 1996, Concentration and pH dependence of skeletal muscle chloride channel ClC-1, The Journal of Physiology, 497 (Pt 2), 423, 10.1113/jphysiol.1996.sp021778 · DOI
  51. Saviane, 1999, The muscle chloride channel ClC-1 has a double-barreled appearance that is differentially affected in dominant and recessive myotonia, The Journal of General Physiology, 113, 457, 10.1085/jgp.113.3.457 · DOI
  52. Scheel, 2005, Voltage-dependent electrogenic chloride/proton exchange by endosomal CLC proteins, Nature, 436, 424, 10.1038/nature03860 · DOI
  53. Scheres, 2012, RELION: implementation of a Bayesian approach to cryo-EM structure determination, Journal of Structural Biology, 180, 519, 10.1016/j.jsb.2012.09.006 · DOI · Paper page
  54. Scholl, 2006, Barttin modulates trafficking and function of ClC-K channels, PNAS, 103, 11411, 10.1073/pnas.0601631103 · DOI
  55. Steinmeyer, 1991, Inactivation of muscle chloride channel by transposon insertion in myotonic mice, Nature, 354, 304, 10.1038/354304a0 · DOI
  56. Walden, 2007, Uncoupling and turnover in a cl-/H+ exchange transporter, The Journal of General Physiology, 129, 317, 10.1085/jgp.200709756 · DOI · Paper page
  57. Wang, 2016, Automated structure refinement of macromolecular assemblies from cryo-EM maps using rosetta, eLife, 5, e17219, 10.7554/eLife.17219 · DOI · Paper page
  58. Weinreich, 2001, Pores formed by single subunits in mixed dimers of different CLC chloride channels, Journal of Biological Chemistry, 276, 2347, 10.1074/jbc.M005733200 · DOI · Paper page
  59. Wollnik, 1997, Identification of functionally important regions of the muscular chloride channel CIC-1 by analysis of recessive and dominant myotonic mutations, Human Molecular Genetics, 6, 805, 10.1093/hmg/6.5.805 · DOI
  60. Zdebik, 2008, Determinants of anion-proton coupling in mammalian endosomal CLC proteins, Journal of Biological Chemistry, 283, 4219, 10.1074/jbc.M708368200 · DOI
  61. Zheng, 2017, MotionCor2: anisotropic correction of beam-induced motion for improved cryo-electron microscopy, Nature Methods, 14, 331, 10.1038/nmeth.4193 · DOI
  62. Zhou, 2001, Chemistry of ion coordination and hydration revealed by a K+ channel-Fab complex at 2.0 A resolution, Nature, 414, 43, 10.1038/35102009 · DOI

Cited by

Sorted by citations

Metadata

Authors
Park, E., & MacKinnon, R.
Affiliations
Laboratory of Molecular Neurobiology and Biophysics, Howard Hughes Medical Institute, The Rockefeller University, New York, United States
Venue
eLife
Published
2018-05-29
Volume
7
ISSN
2050-084X
Cited by
109
References
0
Language
en
Funders
  • Howard Hughes Medical Institute
  • Jane Coffin Childs Memorial Fund for Medical Research (61-1513)
  • Charles H. Revson Foundation (16-33)

About these checks

Registry, retraction, Cites and statistics results are computed, not judged, with one exception: a printed reference that no index lists is read once by a model before it counts as a citation error. Claims are extracted by a model and kept only when their quote appears verbatim in the text; each cited source is then checked, with a model’s help, for whether it says what the claim relies on. Those verdicts can be wrong — read the claim’s quote and the cited source before relying on one.

Statistics and arithmetic are recomputed, not judged.

Confidence bands are shown only for fields calibrated on our annotated test set. None is calibrated yet, so no band is shown.

What counts as a claim ›How we measure confidence ›How we check this ›

Are you an author, or do you see a problem with this page? Request a review