Cited by 127

The DOI matches its Crossref record; 19 of the 19 references it cites were found in a registry or an index.

Systemic racial disparities in funding rates at the National Science Foundation

Chen, Christine Yifeng, Kahanamoku, Sara S, Tripati, Aradhna, Alegado, Rosanna A, Morris, Vernon R, Andrade, Karen, Hosbey, Justin·2022·eLife

Published version of a preprint

Abstract

Concerns about systemic racism at academic and research institutions have increased over the past decade. Here, we investigate data from the National Science Foundation (NSF), a major funder of research in the United States, and find evidence for pervasive racial disparities. In particular, white principal investigators (PIs) are consistently funded at higher rates than most non-white PIs. Funding rates for white PIs have also been increasing relative to annual overall rates with time. Moreover, disparities occur across all disciplinary directorates within the NSF and are greater for research proposals. The distributions of average external review scores also exhibit systematic offsets based on PI race. Similar patterns have been described in other research funding bodies, suggesting that racial disparities are widespread. The prevalence and persistence of these racial disparities in funding have cascading impacts that perpetuate a cumulative advantage to white PIs across all of science, technology, engineering, and mathematics.

Overview

The claims and statistics of this paper haven’t been checked yet.

Run the check — free, no account needed. It reads the open-access text and checks the sources it cites.

A few free checks a day · papers already verified open instantly · results are public

Integrity signals

Registry

Crossref · 10.7554/elife.83071

Cites

19 of 19 references verified0 citation errors · 0 not checkable

Statistics

Figures
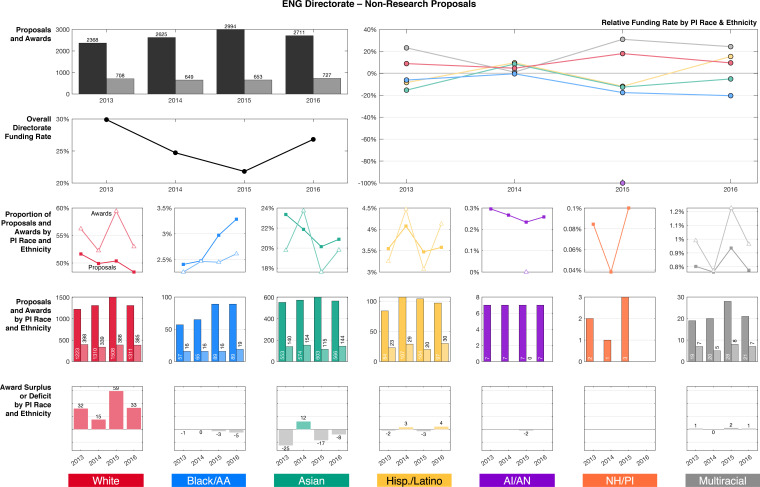
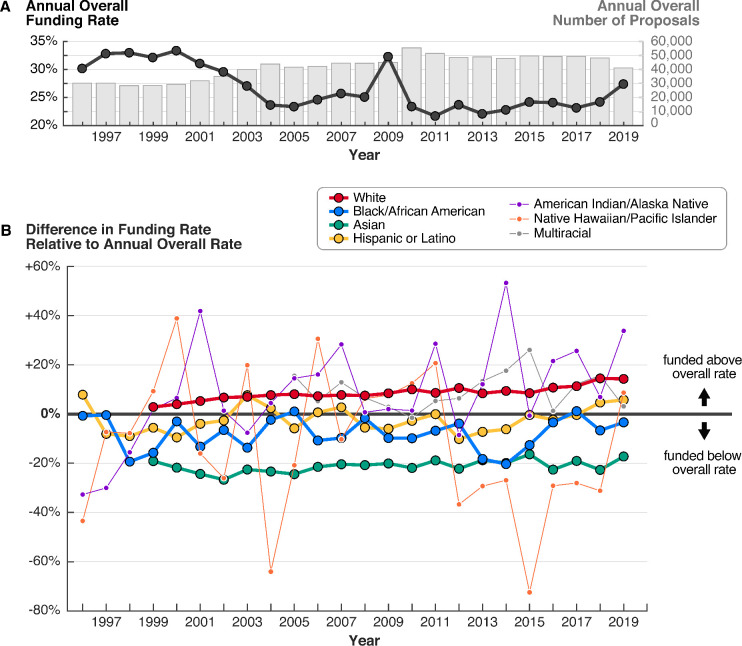
Figure 1. From 1999 to 2019, proposals by white PIs were consistently funded at rates above the overall average, while proposals by most other groups were funded at rates below the overall average. (A) Overall funding rates (black line) and total number of proposals (gray bars) have fluctuated on a yearly basis over time. (B) Racial disparities in funding rates have persisted for more than 20 years. Funding rates by PI race and ethnicity are normalized to the overall rate for each year. Groups represented by thinner lines submitted on average fewer than 500 proposals annually. Data for white and Asian PIs are only available starting in 1999, and for multiracial PIs starting in 2005. Source data: Data S1 in the accompanying data repository (https://doi.org/10.5061/dryad.2fqz612rt).
Figure 1. From 1999 to 2019, proposals by white PIs were consistently funded at rates above the overall average, while proposals by most other groups were funded at rates below the overall average. (A) Overall funding rates (black line) and total number of proposals (gray bars) have fluctuated on a yearly basis over time. (B) Racial disparities in funding rates have persisted for more than 20 years. Funding rates by PI race and ethnicity are normalized to the overall rate for each year. Groups represented by thinner lines submitted on average fewer than 500 proposals annually. Data for white and Asian PIs are only available starting in 1999, and for multiracial PIs starting in 2005. Source data: Data S1 in the accompanying data repository (https://doi.org/10.5061/dryad.2fqz612rt).CC0 · PubMed Central
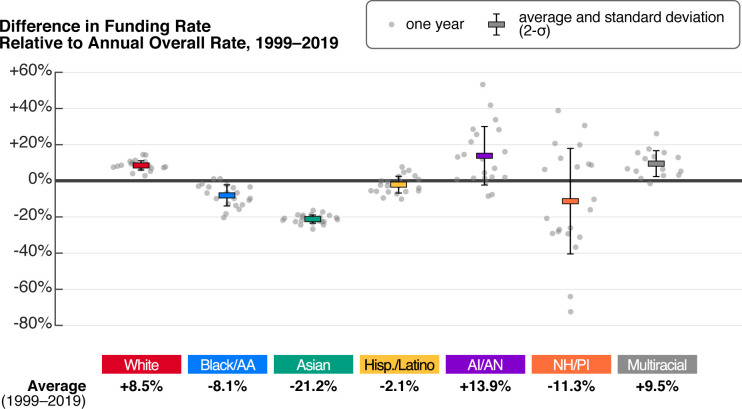
Figure 1—figure supplement 1. Jitter plot illustrating the variance of annual overall relative funding rates for all proposals by PI race and ethnicity, 1999–2019. Each gray dot shows the data for one year. The colored horizontal bars with error bars represent the average and standard deviation of the annual overall relative funding rate for all available data for each group. Averages are reported for each group along the bottom of the chart. Note that only 15 years of data are available for proposals by multiracial PIs (2005–2019). While data for Black/AA, AI/AN, NH/PI and Hispanic or Latino PIs exist for the years 1996–1998, averages are only calculated for the years 1999–2019 to allow for comparability with data for white and Asian PIs, for which data are only available since 1999. Source data: Data S1 in the accompanying data repository (https://doi.org/10.5061/dryad.2fqz612rt).
Figure 1—figure supplement 1. Jitter plot illustrating the variance of annual overall relative funding rates for all proposals by PI race and ethnicity, 1999–2019. Each gray dot shows the data for one year. The colored horizontal bars with error bars represent the average and standard deviation of the annual overall relative funding rate for all available data for each group. Averages are reported for each group along the bottom of the chart. Note that only 15 years of data are available for proposals by multiracial PIs (2005–2019). While data for Black/AA, AI/AN, NH/PI and Hispanic or Latino PIs exist for the years 1996–1998, averages are only calculated for the years 1999–2019 to allow for comparability with data for white and Asian PIs, for which data are only available since 1999. Source data: Data S1 in the accompanying data repository (https://doi.org/10.5061/dryad.2fqz612rt).CC0 · PubMed Central
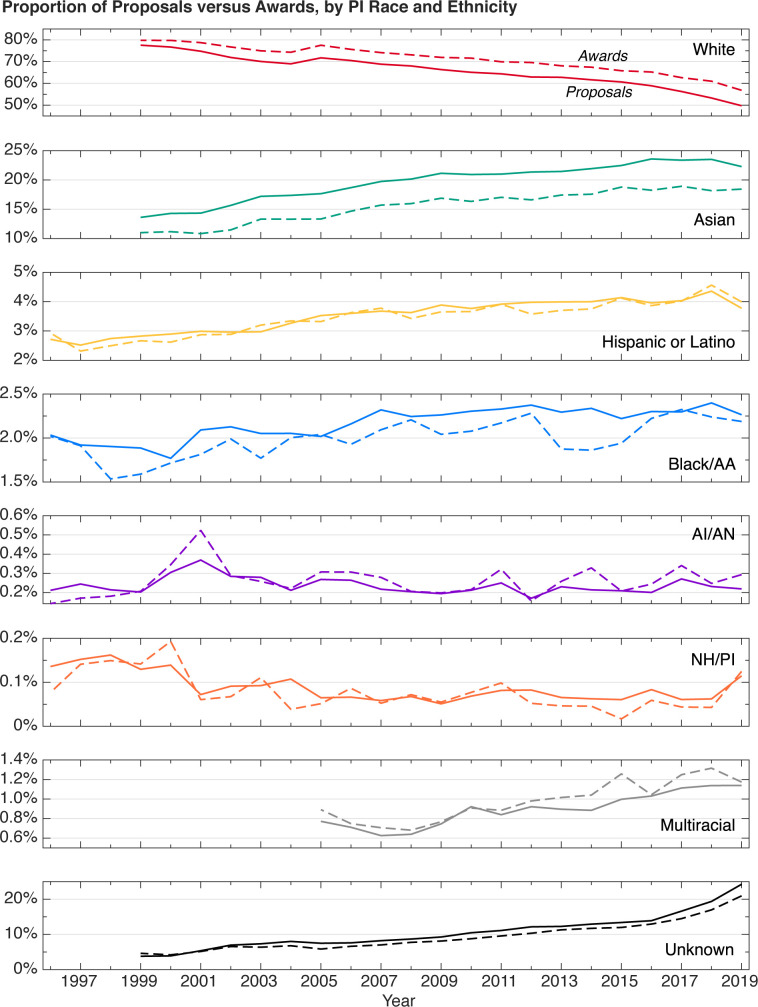
Figure 1—figure supplement 2. The proportions of all proposals and all awards by PI race and ethnicity, 1996–2019. Source data: Data S1 in the accompanying data repository (https://doi.org/10.5061/dryad.2fqz612rt).
Figure 1—figure supplement 2. The proportions of all proposals and all awards by PI race and ethnicity, 1996–2019. Source data: Data S1 in the accompanying data repository (https://doi.org/10.5061/dryad.2fqz612rt).CC0 · PubMed Central
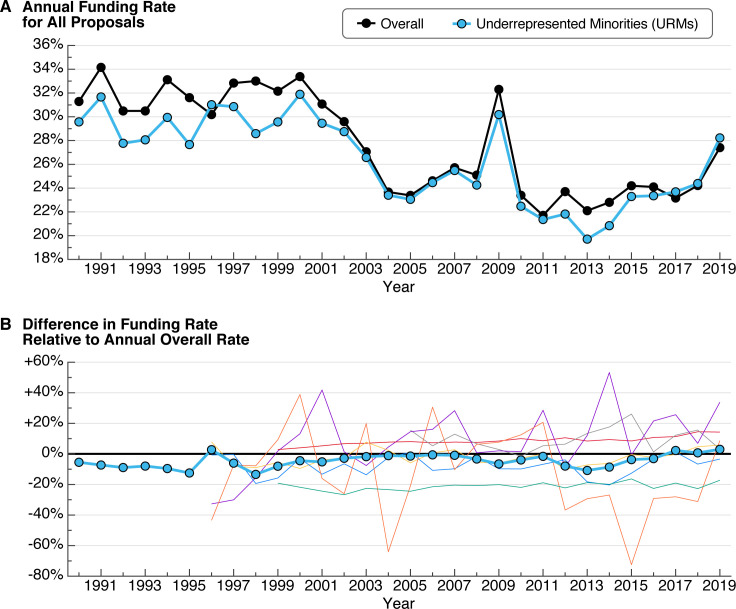
Figure 1—figure supplement 3. Funding rates and relative funding rates for underrepresented racial and ethnic minority PIs. (A) Comparison of the overall funding rate (black) and the funding rate for proposals by PIs who are underrepresented racial and ethnic minorities (URMs; blue). NSF defines URM as a category that includes American Indian/Alaska Native (AI/AN), Black/African American (Black/AA), Hispanic or Latino, and Native Hawaiian/Pacific Islander (NH/PI) PIs, and excludes Asian and non-Hispanic white PIs. (B) Comparison of the relative funding rate for proposals by URM PIs (thick blue line with markers) and the relative funding rate for proposals by PIs of other racial and ethnic groups (thin lines; from Figure 1B). Source data: Data S6 in the accompanying data repository (https://doi.org/10.5061/dryad.2fqz612rt).
Figure 1—figure supplement 3. Funding rates and relative funding rates for underrepresented racial and ethnic minority PIs. (A) Comparison of the overall funding rate (black) and the funding rate for proposals by PIs who are underrepresented racial and ethnic minorities (URMs; blue). NSF defines URM as a category that includes American Indian/Alaska Native (AI/AN), Black/African American (Black/AA), Hispanic or Latino, and Native Hawaiian/Pacific Islander (NH/PI) PIs, and excludes Asian and non-Hispanic white PIs. (B) Comparison of the relative funding rate for proposals by URM PIs (thick blue line with markers) and the relative funding rate for proposals by PIs of other racial and ethnic groups (thin lines; from Figure 1B). Source data: Data S6 in the accompanying data repository (https://doi.org/10.5061/dryad.2fqz612rt).CC0 · PubMed Central
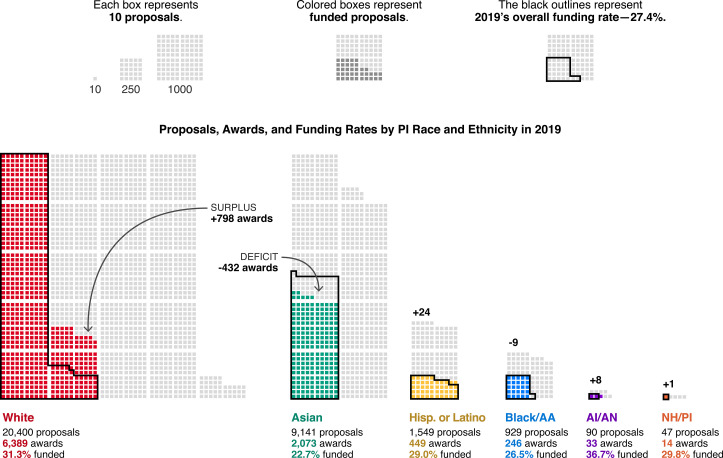
Figure 2. In 2019, racial disparities in funding rates corresponded to hundreds of awards in surplus to white PIs and hundreds of awards in deficit to other groups. Each box represents 10 proposals. Light gray boxes are unsuccessful proposals; colored boxes are funded proposals (awards). The black outlines represent 27.4% of the proposals submitted by each group, where 27.4% is the overall funding rate in 2019. For each group, the number of awards above (surplus) or below (deficit) this threshold is in bold. This graphic does not include proposals by multiracial PIs or PIs who did not provide their race or ethnicity. Source data: Data S1 in the accompanying data repository (https://doi.org/10.5061/dryad.2fqz612rt).
Figure 2. In 2019, racial disparities in funding rates corresponded to hundreds of awards in surplus to white PIs and hundreds of awards in deficit to other groups. Each box represents 10 proposals. Light gray boxes are unsuccessful proposals; colored boxes are funded proposals (awards). The black outlines represent 27.4% of the proposals submitted by each group, where 27.4% is the overall funding rate in 2019. For each group, the number of awards above (surplus) or below (deficit) this threshold is in bold. This graphic does not include proposals by multiracial PIs or PIs who did not provide their race or ethnicity. Source data: Data S1 in the accompanying data repository (https://doi.org/10.5061/dryad.2fqz612rt).CC0 · PubMed Central
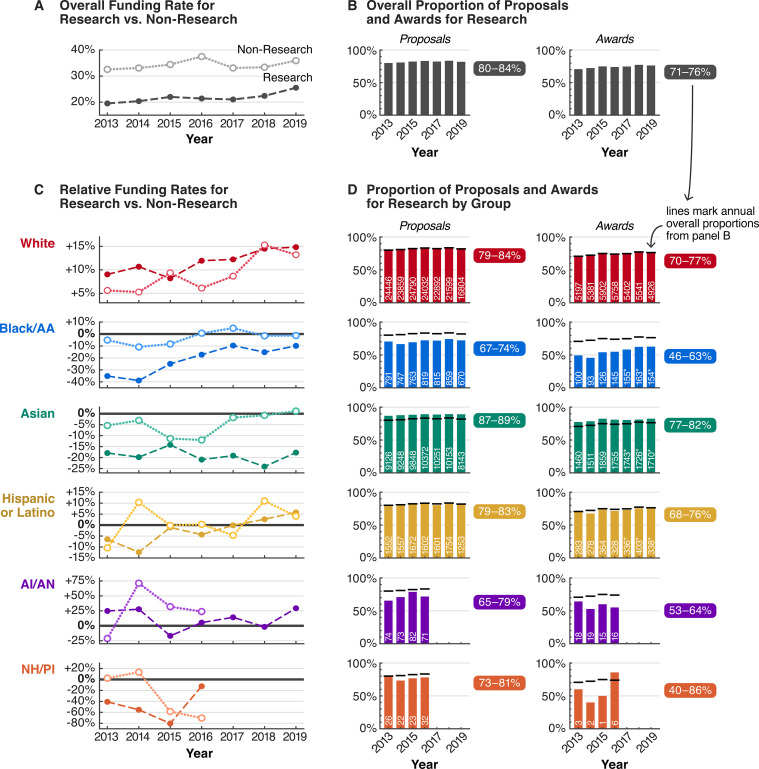
Figure 3. From 2013 to 2019, racial funding disparities were even greater for Research proposals, contributing to racial stratification in Research versus Non-Research activities. (A) Overall funding rates for Research proposals (dark dashed line) are more competitive than overall funding rates for Non-Research proposals (light dotted line). (B) 80–84% of all proposals and 71–76% of all awards were for Research activities. (C) Both Research and Non-Research proposals by white PIs were funded above overall rates. In contrast, Research proposals by PIs of most other groups were funded below overall rates, and at rates generally lower than those for Non-Research. (D) Only 46–63% of all awards to Black/AA PIs were for Research, far below overall proportions of awards for Research for all groups combined (black horizontal lines; panel B), contributing to a stratification of awarded activities by race. White text denotes the number of Research proposals or awards for each group per year; asterisk indicates that numbers are estimates based on available data. Non-Research data for AI/AN and NH/PI PIs were not available 2017–2019. Source data: Data S2–3 in the accompanying data repository (https://doi.org/10.5061/dryad.2fqz612rt).
Figure 3. From 2013 to 2019, racial funding disparities were even greater for Research proposals, contributing to racial stratification in Research versus Non-Research activities. (A) Overall funding rates for Research proposals (dark dashed line) are more competitive than overall funding rates for Non-Research proposals (light dotted line). (B) 80–84% of all proposals and 71–76% of all awards were for Research activities. (C) Both Research and Non-Research proposals by white PIs were funded above overall rates. In contrast, Research proposals by PIs of most other groups were funded below overall rates, and at rates generally lower than those for Non-Research. (D) Only 46–63% of all awards to Black/AA PIs were for Research, far below overall proportions of awards for Research for all groups combined (black horizontal lines; panel B), contributing to a stratification of awarded activities by race. White text denotes the number of Research proposals or awards for each group per year; asterisk indicates that numbers are estimates based on available data. Non-Research data for AI/AN and NH/PI PIs were not available 2017–2019. Source data: Data S2–3 in the accompanying data repository (https://doi.org/10.5061/dryad.2fqz612rt).CC0 · PubMed Central
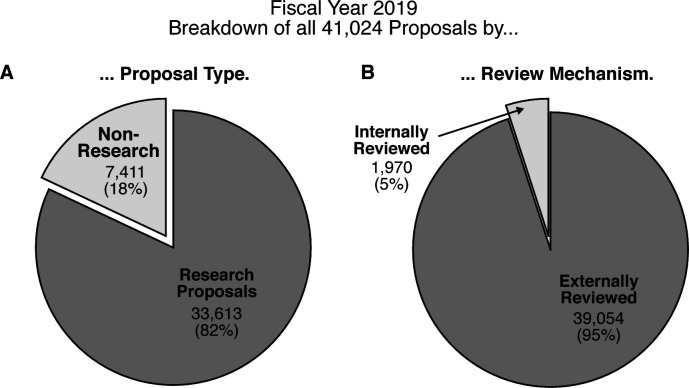
Figure 3—figure supplement 1. Pie charts representing the percentage breakdown of all proposals from 2019 by proposal type and review mechanism. (A) Research proposals are the typical mechanism through which NSF funds PIs. NSF defines Non-Research proposals as those for education and training; operation costs for facilities; grants for equipment, instrumentation, conferences, and symposia; and grants in the Small Business Innovation Research program. (B) The “Externally Reviewed” category includes proposals reviewed by panels and/or ad hoc external reviews. The “Internally Reviewed” category includes proposals that were reviewed by NSF program managers and experts, but did not receive external reviews. Proposal types which are not externally reviewed include RAPID, EAGER, RAISE proposals, and small grants for travel and symposia. Proposals that are not included in these charts and are not evaluated in this study are proposals that are returned without review (770 in 2019) and proposals withdrawn by the PI (280 in 2019), which NSF describes as proposals without an award or decline decision.
Figure 3—figure supplement 1. Pie charts representing the percentage breakdown of all proposals from 2019 by proposal type and review mechanism. (A) Research proposals are the typical mechanism through which NSF funds PIs. NSF defines Non-Research proposals as those for education and training; operation costs for facilities; grants for equipment, instrumentation, conferences, and symposia; and grants in the Small Business Innovation Research program. (B) The “Externally Reviewed” category includes proposals reviewed by panels and/or ad hoc external reviews. The “Internally Reviewed” category includes proposals that were reviewed by NSF program managers and experts, but did not receive external reviews. Proposal types which are not externally reviewed include RAPID, EAGER, RAISE proposals, and small grants for travel and symposia. Proposals that are not included in these charts and are not evaluated in this study are proposals that are returned without review (770 in 2019) and proposals withdrawn by the PI (280 in 2019), which NSF describes as proposals without an award or decline decision.CC0 · PubMed Central
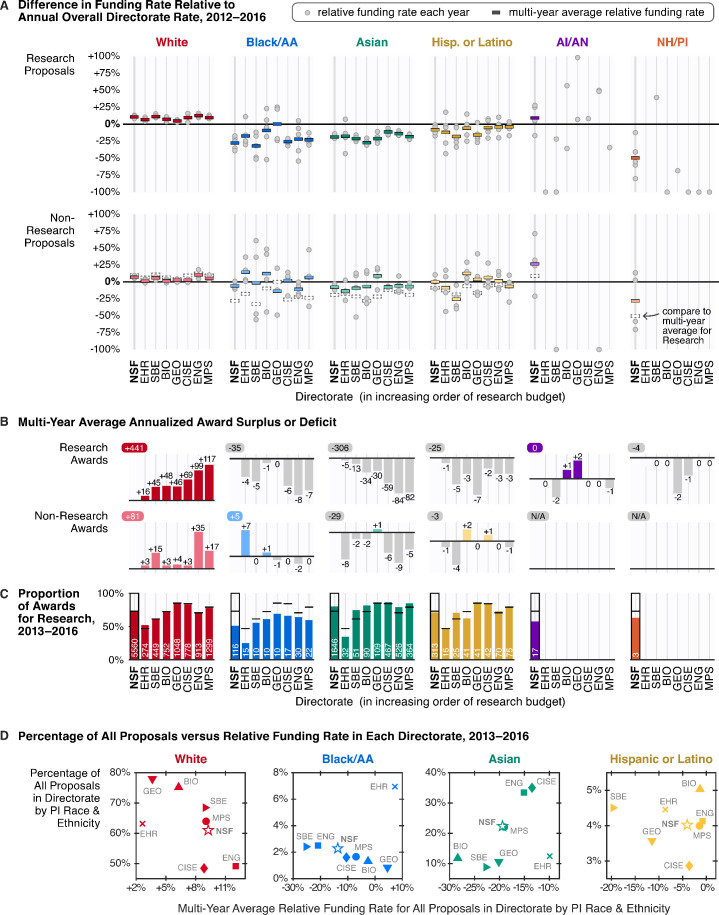
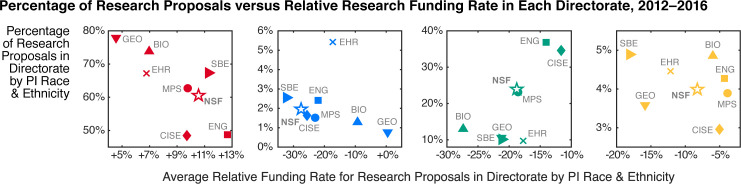
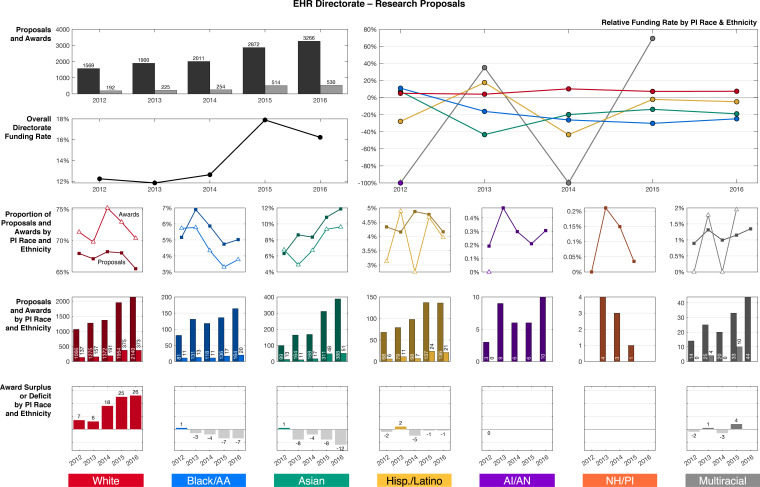
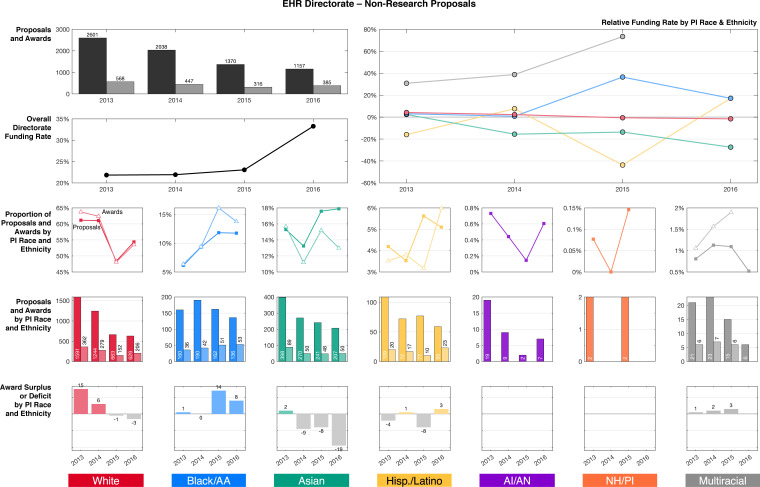
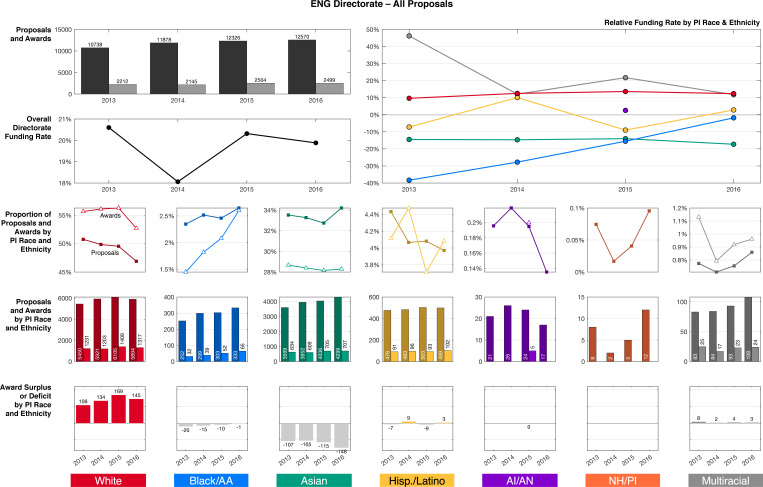
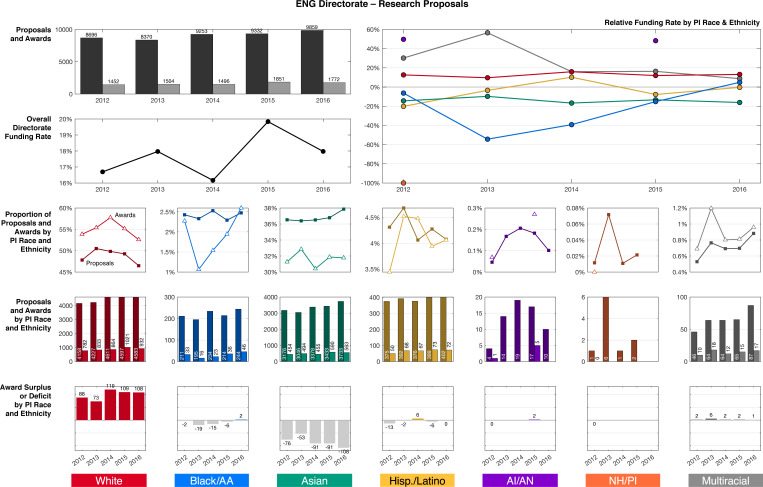
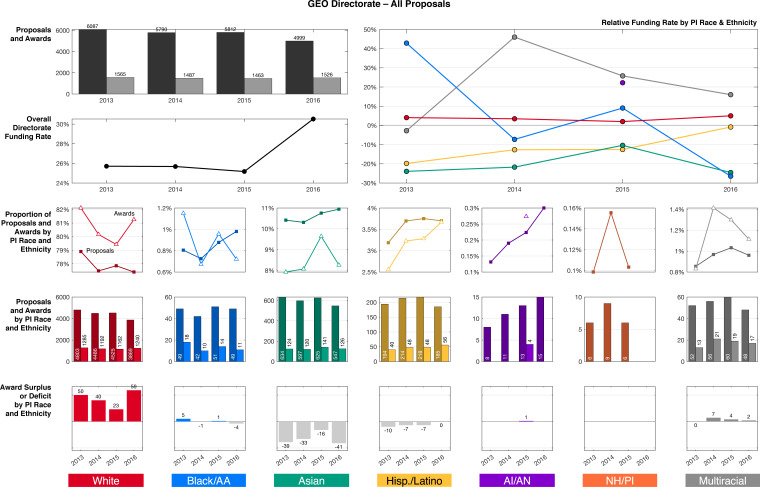
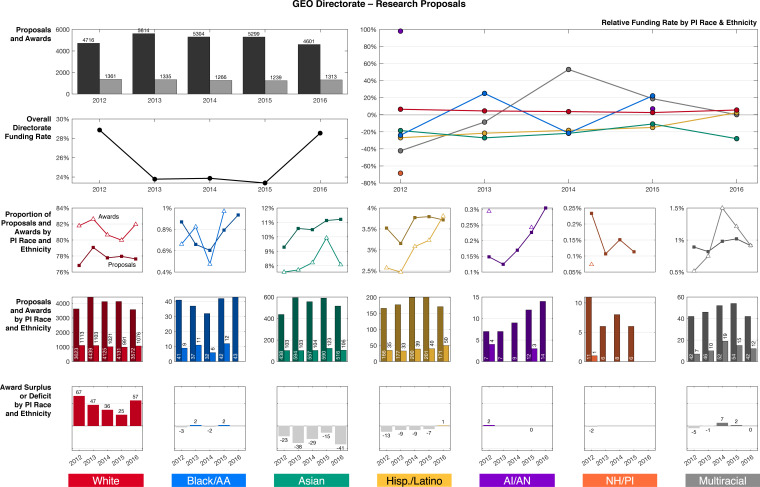
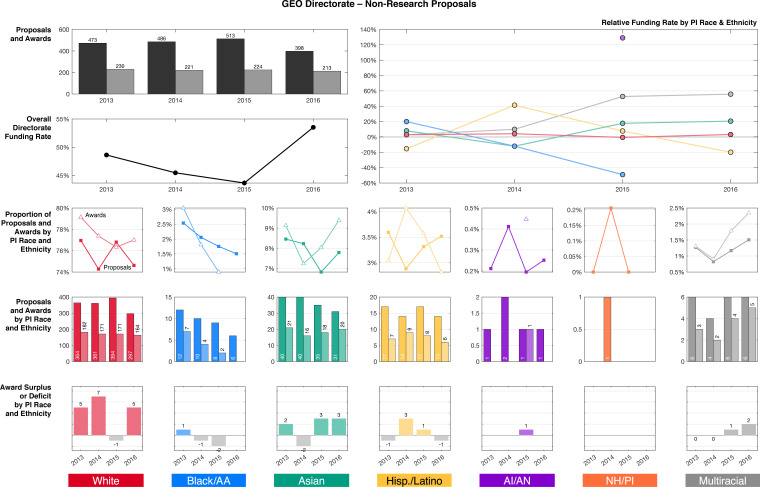
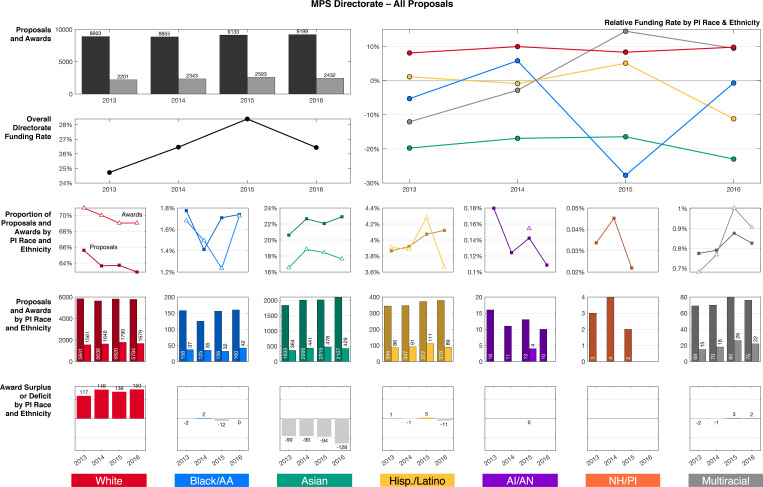
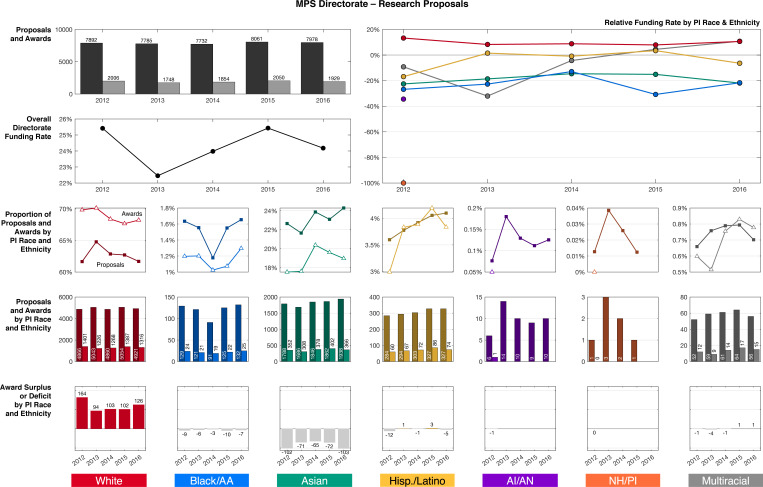
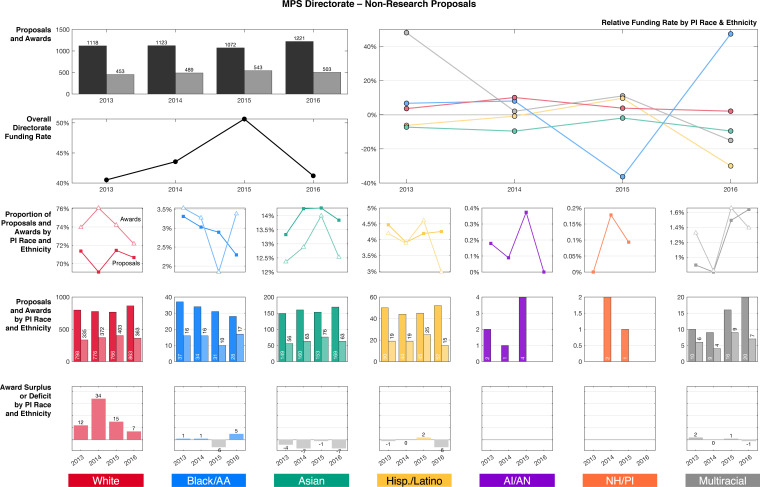
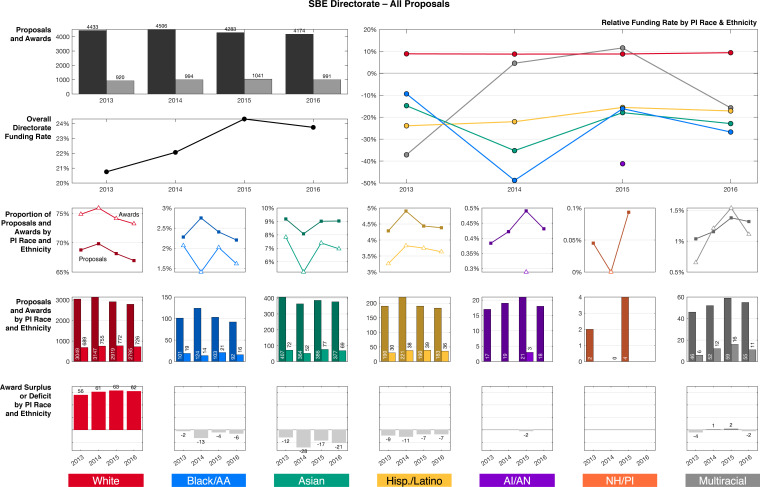
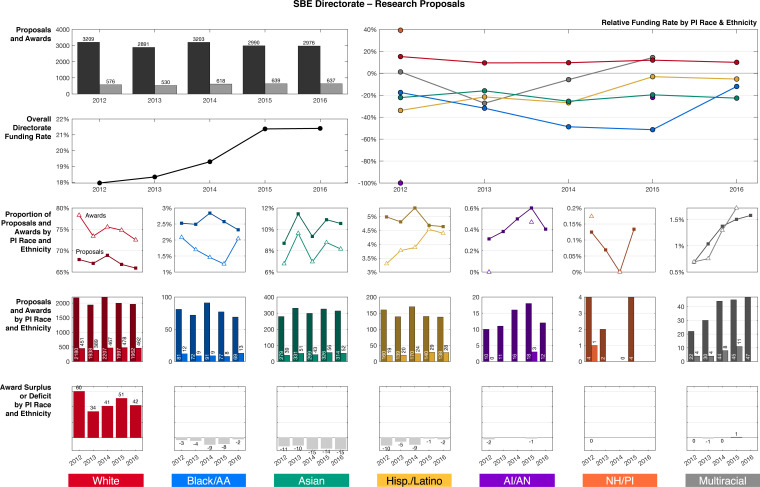
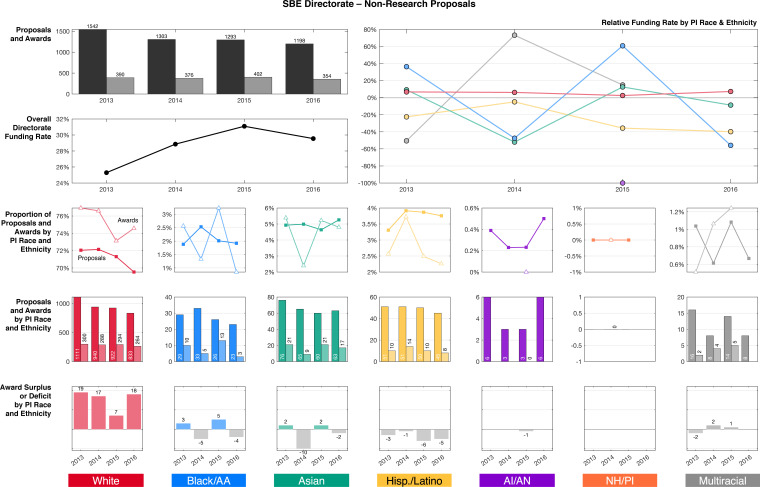
Figure 4. From 2012 to 2016, all disciplinary directorates exhibited racial disparities in funding rates and racial stratification in awarded activities. (A) Relative funding rates by directorate for Research (top) versus Non-Research (bottom) proposals by PI race and ethnicity. Gray circles mark relative funding rates for each available year; colored rectangles represent the multi-year average. To aid visual comparison, the multi-year average relative funding rate for Research proposals is superimposed on the Non-Research panel as a dotted rectangle. For Research proposals, data are available for at most 5 years (2012–2016); for Non-Research proposals, data are available for at most 4 years (2013–2016). (B) Multi-year average annualized award surplus or deficit per directorate by PI race and ethnicity, for Research (top) and Non-Research (bottom). The upper-left number in each sub-panel is the multi-year average annualized award surplus or deficit for each group for all seven directorates, excluding awards made by the Office of the Director. For AI/AN and NH/PI PIs, only data for Research awards in 2012 are shown; no directorate data for Non-Research awards are available. (C) Proportion of awards for Research by directorate and PI race and ethnicity, compared to overall directorate proportions (black horizontal lines), 2013–2016. White text denotes average annual number of Research awards per directorate to each group. (D) Percentage of all proposals submitted to each directorate by white (red), Black/AA (blue), Asian (green), and Hispanic or Latino PIs (yellow) versus the multi-year average relative funding rate for all proposals by each group, 2013–2016. Source data: Data S4 in the accompanying data repository (https://doi.org/10.5061/dryad.2fqz612rt).
Figure 4. From 2012 to 2016, all disciplinary directorates exhibited racial disparities in funding rates and racial stratification in awarded activities. (A) Relative funding rates by directorate for Research (top) versus Non-Research (bottom) proposals by PI race and ethnicity. Gray circles mark relative funding rates for each available year; colored rectangles represent the multi-year average. To aid visual comparison, the multi-year average relative funding rate for Research proposals is superimposed on the Non-Research panel as a dotted rectangle. For Research proposals, data are available for at most 5 years (2012–2016); for Non-Research proposals, data are available for at most 4 years (2013–2016). (B) Multi-year average annualized award surplus or deficit per directorate by PI race and ethnicity, for Research (top) and Non-Research (bottom). The upper-left number in each sub-panel is the multi-year average annualized award surplus or deficit for each group for all seven directorates, excluding awards made by the Office of the Director. For AI/AN and NH/PI PIs, only data for Research awards in 2012 are shown; no directorate data for Non-Research awards are available. (C) Proportion of awards for Research by directorate and PI race and ethnicity, compared to overall directorate proportions (black horizontal lines), 2013–2016. White text denotes average annual number of Research awards per directorate to each group. (D) Percentage of all proposals submitted to each directorate by white (red), Black/AA (blue), Asian (green), and Hispanic or Latino PIs (yellow) versus the multi-year average relative funding rate for all proposals by each group, 2013–2016. Source data: Data S4 in the accompanying data repository (https://doi.org/10.5061/dryad.2fqz612rt).CC0 · PubMed Central
Figure 4—figure supplement 1. Comparison of average relative funding rates for Research proposals in each directorate and the proportion of Research proposal in each directorate for white, Black/AA, Asian, and Hispanic or Latino PIs. From left to right: white PIs (red), Black/AA PIs (blue); Asian PIs (green); and Hispanic or Latino PIs (yellow). Abbreviations: Education and Human Resources (EHR); Social, Behavioral, and Economic Sciences (SBE); Biological Sciences (BIO); Geosciences (GEO); Computer and Information Science and Engineering (CISE); Engineering (ENG); and Mathematical and Physical Sciences (MPS). Source data: Data S4 in the accompanying data repository (https://doi.org/10.5061/dryad.2fqz612rt).
Figure 4—figure supplement 1. Comparison of average relative funding rates for Research proposals in each directorate and the proportion of Research proposal in each directorate for white, Black/AA, Asian, and Hispanic or Latino PIs. From left to right: white PIs (red), Black/AA PIs (blue); Asian PIs (green); and Hispanic or Latino PIs (yellow). Abbreviations: Education and Human Resources (EHR); Social, Behavioral, and Economic Sciences (SBE); Biological Sciences (BIO); Geosciences (GEO); Computer and Information Science and Engineering (CISE); Engineering (ENG); and Mathematical and Physical Sciences (MPS). Source data: Data S4 in the accompanying data repository (https://doi.org/10.5061/dryad.2fqz612rt).CC0 · PubMed Central
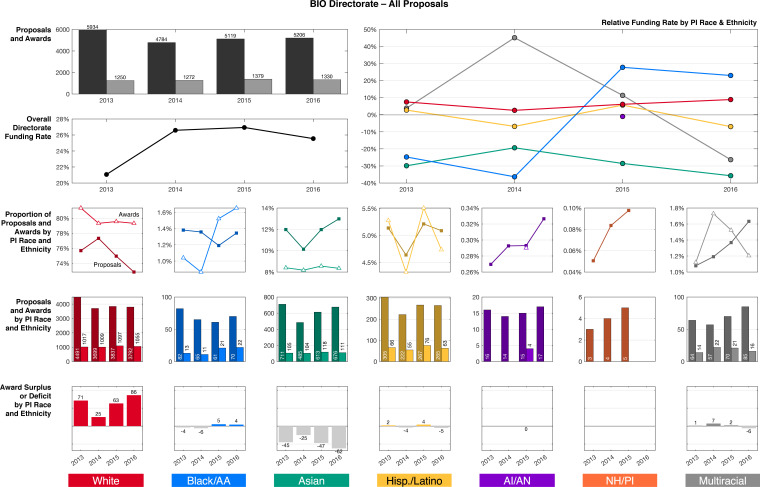
Figure 4—figure supplement 2. Funding outcomes by PI race and ethnicity for all proposals in the BIO Directorate, 2012–2016. Source data: Data S4 in the accompanying data repository (https://doi.org/10.5061/dryad.2fqz612rt).
Figure 4—figure supplement 2. Funding outcomes by PI race and ethnicity for all proposals in the BIO Directorate, 2012–2016. Source data: Data S4 in the accompanying data repository (https://doi.org/10.5061/dryad.2fqz612rt).CC0 · PubMed Central
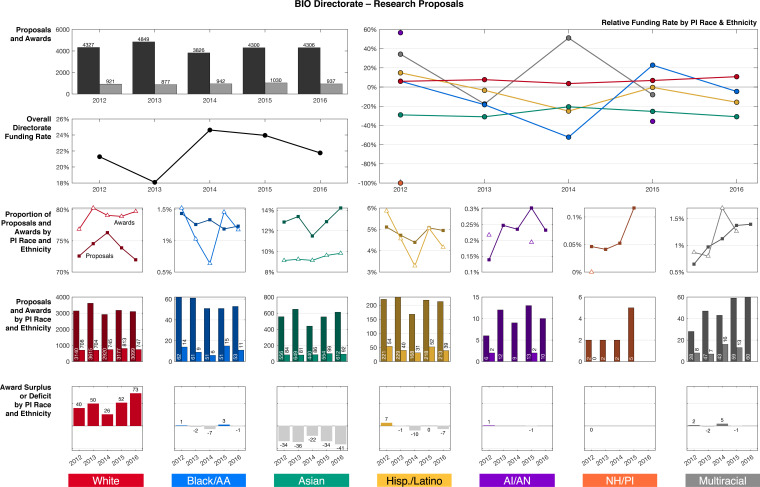
Figure 4—figure supplement 3. Funding outcomes by PI race and ethnicity for Research proposals in the BIO Directorate, 2012–2016. Source data: Data S4 in the accompanying data repository (https://doi.org/10.5061/dryad.2fqz612rt).
Figure 4—figure supplement 3. Funding outcomes by PI race and ethnicity for Research proposals in the BIO Directorate, 2012–2016. Source data: Data S4 in the accompanying data repository (https://doi.org/10.5061/dryad.2fqz612rt).CC0 · PubMed Central
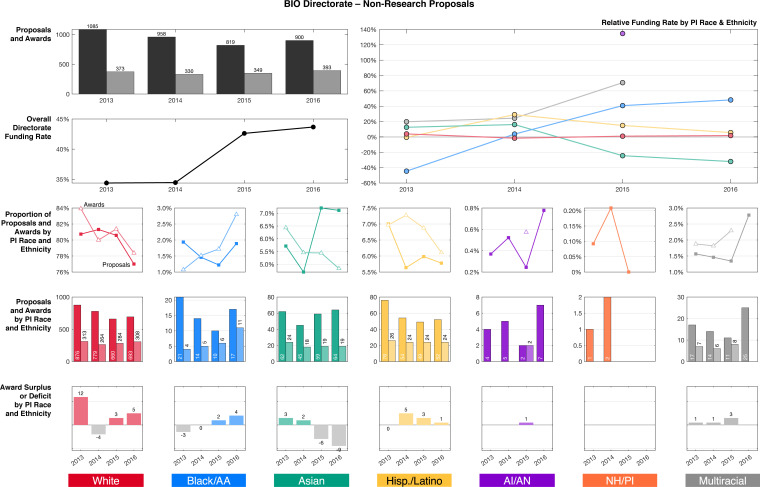
Figure 4—figure supplement 4. Funding outcomes by PI race and ethnicity for Non-Research proposals in the BIO Directorate, 2012–2016. Source data: Data S4 in the accompanying data repository (https://doi.org/10.5061/dryad.2fqz612rt).
Figure 4—figure supplement 4. Funding outcomes by PI race and ethnicity for Non-Research proposals in the BIO Directorate, 2012–2016. Source data: Data S4 in the accompanying data repository (https://doi.org/10.5061/dryad.2fqz612rt).CC0 · PubMed Central
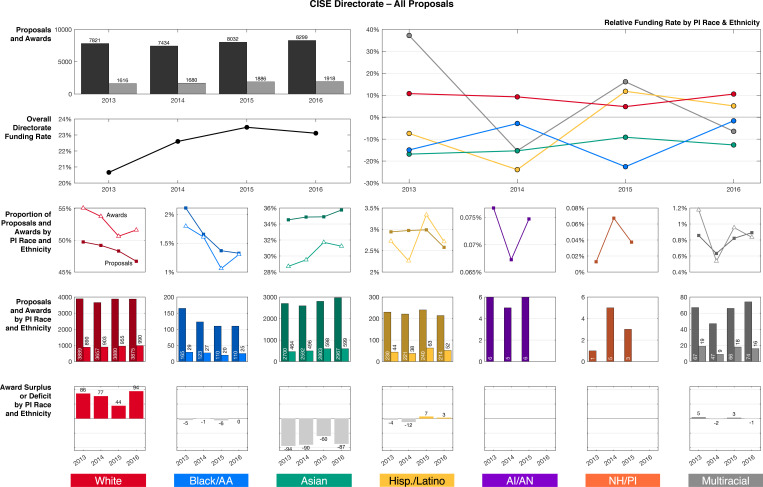
Figure 4—figure supplement 5. Funding outcomes by PI race and ethnicity for all proposals in the CISE Directorate, 2012–2016. Source data: Data S4 in the accompanying data repository (https://doi.org/10.5061/dryad.2fqz612rt).
Figure 4—figure supplement 5. Funding outcomes by PI race and ethnicity for all proposals in the CISE Directorate, 2012–2016. Source data: Data S4 in the accompanying data repository (https://doi.org/10.5061/dryad.2fqz612rt).CC0 · PubMed Central
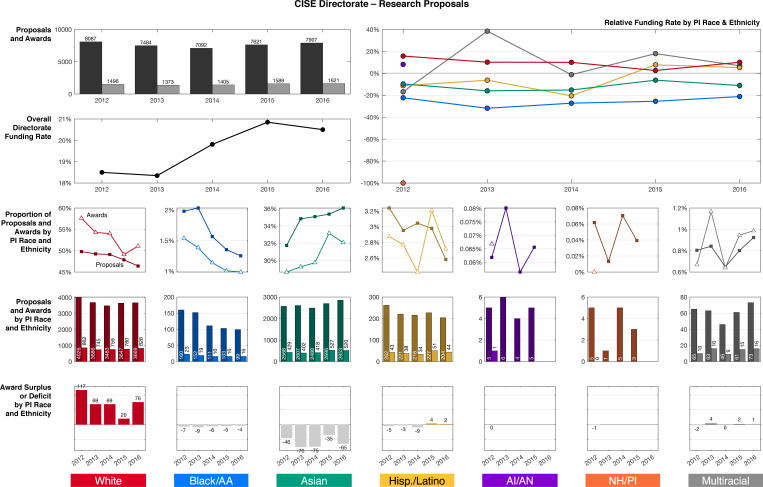
Figure 4—figure supplement 6. Funding outcomes by PI race and ethnicity for Research proposals in the CISE Directorate, 2012–2016. Source data: Data S4 in the accompanying data repository (https://doi.org/10.5061/dryad.2fqz612rt).
Figure 4—figure supplement 6. Funding outcomes by PI race and ethnicity for Research proposals in the CISE Directorate, 2012–2016. Source data: Data S4 in the accompanying data repository (https://doi.org/10.5061/dryad.2fqz612rt).CC0 · PubMed Central
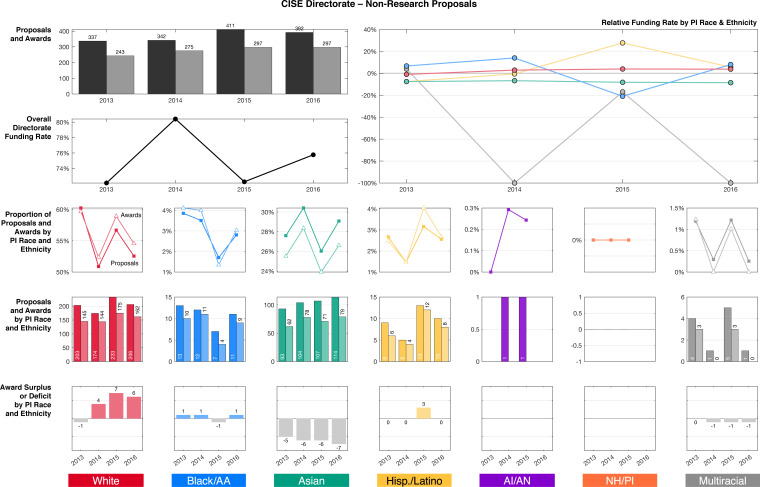
Figure 4—figure supplement 7. Funding outcomes by PI race and ethnicity for Non-Research proposals in the CISE Directorate, 2012–2016. Source data: Data S4 in the accompanying data repository (https://doi.org/10.5061/dryad.2fqz612rt).
Figure 4—figure supplement 7. Funding outcomes by PI race and ethnicity for Non-Research proposals in the CISE Directorate, 2012–2016. Source data: Data S4 in the accompanying data repository (https://doi.org/10.5061/dryad.2fqz612rt).CC0 · PubMed Central
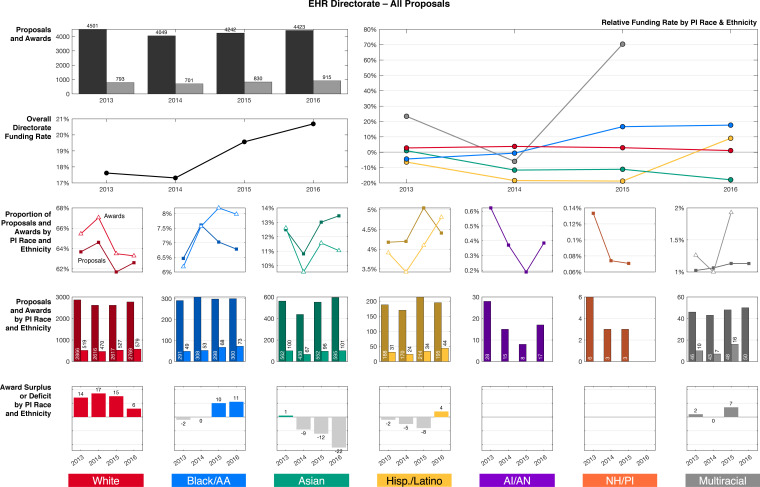
Figure 4—figure supplement 8. Funding outcomes by PI race and ethnicity for all proposals in the EHR Directorate, 2012–2016. Source data: Data S4 in the accompanying data repository (https://doi.org/10.5061/dryad.2fqz612rt).
Figure 4—figure supplement 8. Funding outcomes by PI race and ethnicity for all proposals in the EHR Directorate, 2012–2016. Source data: Data S4 in the accompanying data repository (https://doi.org/10.5061/dryad.2fqz612rt).CC0 · PubMed Central
Figure 4—figure supplement 9. Funding outcomes by PI race and ethnicity for Research proposals in the EHR Directorate, 2012–2016. Source data: Data S4 in the accompanying data repository (https://doi.org/10.5061/dryad.2fqz612rt).
Figure 4—figure supplement 9. Funding outcomes by PI race and ethnicity for Research proposals in the EHR Directorate, 2012–2016. Source data: Data S4 in the accompanying data repository (https://doi.org/10.5061/dryad.2fqz612rt).CC0 · PubMed Central
Figure 4—figure supplement 10. Funding outcomes by PI race and ethnicity for Non-Research proposals in the EHR Directorate, 2012–2016. Source data: Data S4 in the accompanying data repository (https://doi.org/10.5061/dryad.2fqz612rt).
Figure 4—figure supplement 10. Funding outcomes by PI race and ethnicity for Non-Research proposals in the EHR Directorate, 2012–2016. Source data: Data S4 in the accompanying data repository (https://doi.org/10.5061/dryad.2fqz612rt).CC0 · PubMed Central
Figure 4—figure supplement 11. Funding outcomes by PI race and ethnicity for all proposals in the ENG Directorate, 2012–2016. Source data: Data S4 in the accompanying data repository (https://doi.org/10.5061/dryad.2fqz612rt).
Figure 4—figure supplement 11. Funding outcomes by PI race and ethnicity for all proposals in the ENG Directorate, 2012–2016. Source data: Data S4 in the accompanying data repository (https://doi.org/10.5061/dryad.2fqz612rt).CC0 · PubMed Central
Figure 4—figure supplement 12. Funding outcomes by PI race and ethnicity for Research proposals in the ENG Directorate, 2012–2016. Source data: Data S4 in the accompanying data repository (https://doi.org/10.5061/dryad.2fqz612rt).
Figure 4—figure supplement 12. Funding outcomes by PI race and ethnicity for Research proposals in the ENG Directorate, 2012–2016. Source data: Data S4 in the accompanying data repository (https://doi.org/10.5061/dryad.2fqz612rt).CC0 · PubMed Central
Figure 4—figure supplement 13. Funding outcomes by PI race and ethnicity for Non-Research proposals in the ENG Directorate, 2012–2016. Source data: Data S4 in the accompanying data repository (https://doi.org/10.5061/dryad.2fqz612rt).
Figure 4—figure supplement 13. Funding outcomes by PI race and ethnicity for Non-Research proposals in the ENG Directorate, 2012–2016. Source data: Data S4 in the accompanying data repository (https://doi.org/10.5061/dryad.2fqz612rt).CC0 · PubMed Central
Figure 4—figure supplement 14. Funding outcomes by PI race and ethnicity for all proposals in the GEO Directorate, 2012–2016. Source data: Data S4 in the accompanying data repository (https://doi.org/10.5061/dryad.2fqz612rt).
Figure 4—figure supplement 14. Funding outcomes by PI race and ethnicity for all proposals in the GEO Directorate, 2012–2016. Source data: Data S4 in the accompanying data repository (https://doi.org/10.5061/dryad.2fqz612rt).CC0 · PubMed Central
Figure 4—figure supplement 15. Funding outcomes by PI race and ethnicity for Research proposals in the GEO Directorate, 2012–2016. Source data: Data S4 in the accompanying data repository (https://doi.org/10.5061/dryad.2fqz612rt).
Figure 4—figure supplement 15. Funding outcomes by PI race and ethnicity for Research proposals in the GEO Directorate, 2012–2016. Source data: Data S4 in the accompanying data repository (https://doi.org/10.5061/dryad.2fqz612rt).CC0 · PubMed Central
Figure 4—figure supplement 16. Funding outcomes by PI race and ethnicity for Non-Research proposals in the GEO Directorate, 2012–2016. Source data: Data S4 in the accompanying data repository (https://doi.org/10.5061/dryad.2fqz612rt).
Figure 4—figure supplement 16. Funding outcomes by PI race and ethnicity for Non-Research proposals in the GEO Directorate, 2012–2016. Source data: Data S4 in the accompanying data repository (https://doi.org/10.5061/dryad.2fqz612rt).CC0 · PubMed Central
Figure 4—figure supplement 17. Funding outcomes by PI race and ethnicity for all proposals in the MPS Directorate, 2012–2016. Source data: Data S4 in the accompanying data repository (https://doi.org/10.5061/dryad.2fqz612rt).
Figure 4—figure supplement 17. Funding outcomes by PI race and ethnicity for all proposals in the MPS Directorate, 2012–2016. Source data: Data S4 in the accompanying data repository (https://doi.org/10.5061/dryad.2fqz612rt).CC0 · PubMed Central
Figure 4—figure supplement 18. Funding outcomes by PI race and ethnicity for Research proposals in the MPS Directorate, 2012–2016. Source data: Data S4 in the accompanying data repository (https://doi.org/10.5061/dryad.2fqz612rt).
Figure 4—figure supplement 18. Funding outcomes by PI race and ethnicity for Research proposals in the MPS Directorate, 2012–2016. Source data: Data S4 in the accompanying data repository (https://doi.org/10.5061/dryad.2fqz612rt).CC0 · PubMed Central
Figure 4—figure supplement 19. Funding outcomes by PI race and ethnicity for Non-Research proposals in the MPS Directorate, 2012–2016. Source data: Data S4 in the accompanying data repository (https://doi.org/10.5061/dryad.2fqz612rt).
Figure 4—figure supplement 19. Funding outcomes by PI race and ethnicity for Non-Research proposals in the MPS Directorate, 2012–2016. Source data: Data S4 in the accompanying data repository (https://doi.org/10.5061/dryad.2fqz612rt).CC0 · PubMed Central
Figure 4—figure supplement 20. Funding outcomes by PI race and ethnicity for all proposals in the SBE Directorate, 2012–2016. Source data: Data S4 in the accompanying data repository (https://doi.org/10.5061/dryad.2fqz612rt).
Figure 4—figure supplement 20. Funding outcomes by PI race and ethnicity for all proposals in the SBE Directorate, 2012–2016. Source data: Data S4 in the accompanying data repository (https://doi.org/10.5061/dryad.2fqz612rt).CC0 · PubMed Central
Figure 4—figure supplement 21. Funding outcomes by PI race and ethnicity for Research proposals in the SBE Directorate, 2012–2016. Source data: Data S4 in the accompanying data repository (https://doi.org/10.5061/dryad.2fqz612rt).
Figure 4—figure supplement 21. Funding outcomes by PI race and ethnicity for Research proposals in the SBE Directorate, 2012–2016. Source data: Data S4 in the accompanying data repository (https://doi.org/10.5061/dryad.2fqz612rt).CC0 · PubMed Central
Figure 4—figure supplement 22. Funding outcomes by PI race and ethnicity for Non-Research proposals in the SBE Directorate, 2012–2016. Source data: Data S4 in the accompanying data repository (https://doi.org/10.5061/dryad.2fqz612rt).
Figure 4—figure supplement 22. Funding outcomes by PI race and ethnicity for Non-Research proposals in the SBE Directorate, 2012–2016. Source data: Data S4 in the accompanying data repository (https://doi.org/10.5061/dryad.2fqz612rt).CC0 · PubMed Central
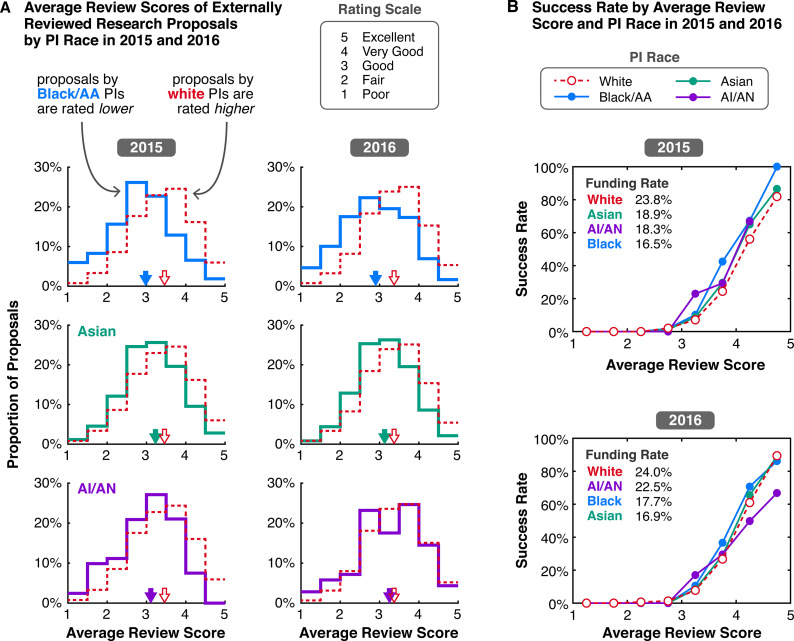
Figure 5. In 2015 and 2016, the distributions of average external review scores of externally reviewed Research proposals were systematically offset and skewed based on PI race. (A) White (red dashed), Black/AA (blue), Asian (green), and AI/AN (purple) PIs, for 2015 (left column) and 2016 (right column). Proposals are rated on a scale from 1 (Poor) to 5 (Excellent). The grand average of all average review scores for proposals by white PIs (red-outlined arrows) is higher than the grand averages of review scores for proposals by Black/AA, Asian, and AI/AN PIs (solid-colored arrows). (B) Funding rates of externally reviewed Research proposals by average review score and PI race. For context, the funding rate of all Research proposals by group is listed from highest to lowest in the top left corner. Data on review scores and funding rates by average score are only available for 2015 and 2016. Source data: Data S5 in the accompanying data repository (https://doi.org/10.5061/dryad.2fqz612rt).
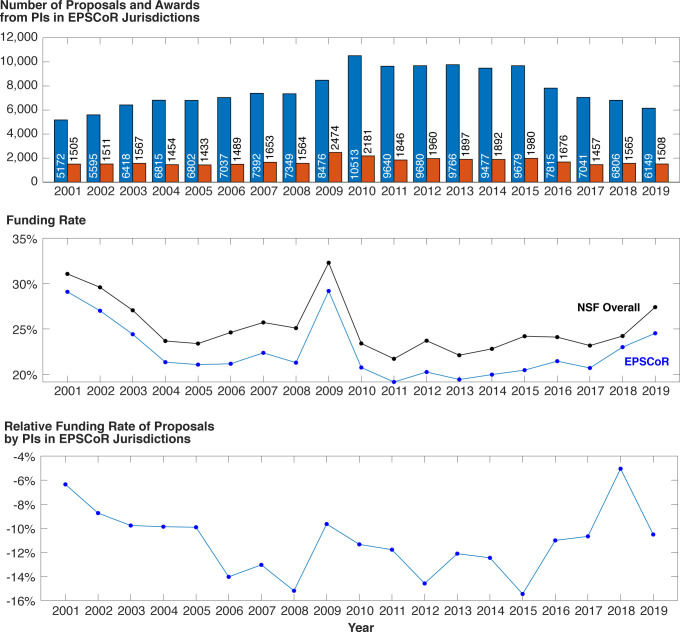
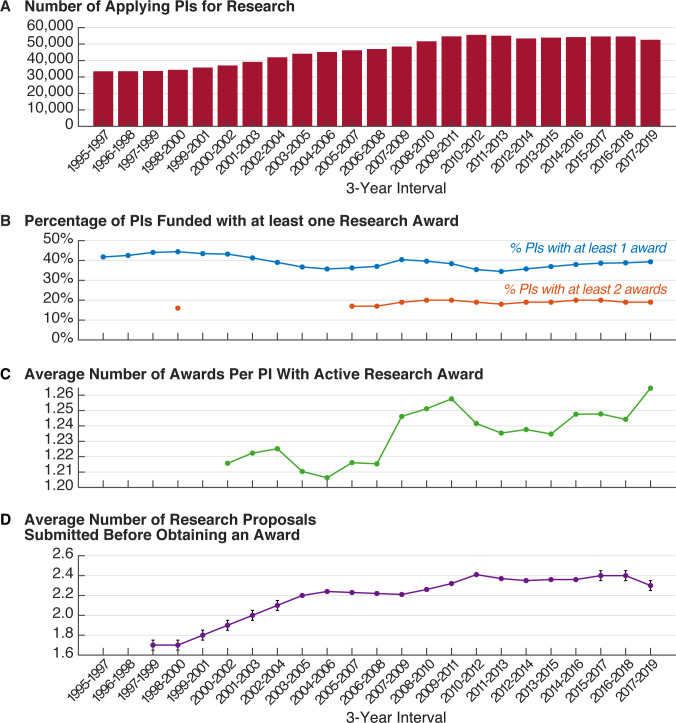
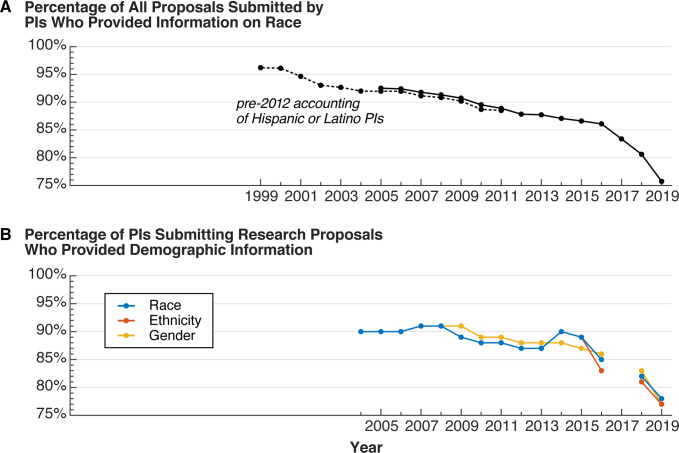
Figure 5. In 2015 and 2016, the distributions of average external review scores of externally reviewed Research proposals were systematically offset and skewed based on PI race. (A) White (red dashed), Black/AA (blue), Asian (green), and AI/AN (purple) PIs, for 2015 (left column) and 2016 (right column). Proposals are rated on a scale from 1 (Poor) to 5 (Excellent). The grand average of all average review scores for proposals by white PIs (red-outlined arrows) is higher than the grand averages of review scores for proposals by Black/AA, Asian, and AI/AN PIs (solid-colored arrows). (B) Funding rates of externally reviewed Research proposals by average review score and PI race. For context, the funding rate of all Research proposals by group is listed from highest to lowest in the top left corner. Data on review scores and funding rates by average score are only available for 2015 and 2016. Source data: Data S5 in the accompanying data repository (https://doi.org/10.5061/dryad.2fqz612rt).CC0 · PubMed Central
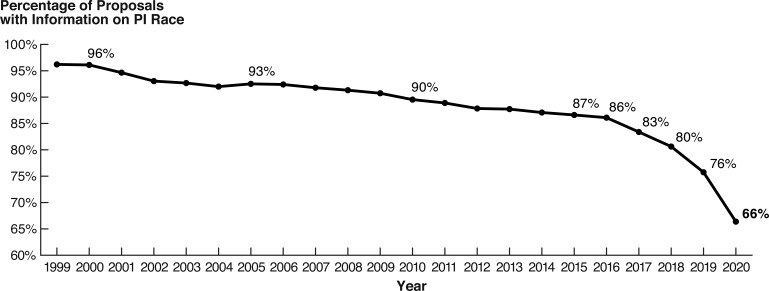
Figure 6. The decline in the proportion of proposals by PIs who identified their race has accelerated in recent years. Source data: Data for 1999–2019 are collated in Data S1 in the accompanying data repository (https://doi.org/10.5061/dryad.2fqz612rt); data for the year 2020 are available from the 2020 NSF report on the Merit Review Process (National Science Board, 2021a).
Figure 6. The decline in the proportion of proposals by PIs who identified their race has accelerated in recent years. Source data: Data for 1999–2019 are collated in Data S1 in the accompanying data repository (https://doi.org/10.5061/dryad.2fqz612rt); data for the year 2020 are available from the 2020 NSF report on the Merit Review Process (National Science Board, 2021a).CC0 · PubMed Central
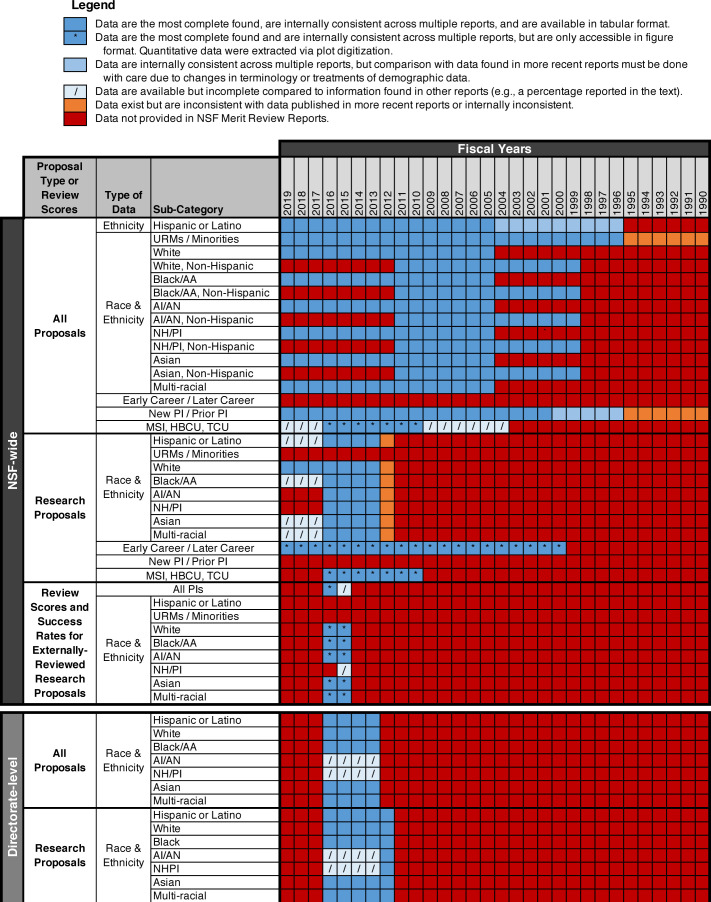
Figure 6—figure supplement 1. Availability of data on funding outcomes by PI race and ethnicity and other demographic characteristics in NSF merit review reports, 1990–2019. Data are organized by organizational level (NSF-wide or directorate-level) and then by proposal and activity type (all proposals, Research proposals, and external review scores and success rates). Information reported within the datasets available from NSF include Ethnicity (exclusive of race), Race and Ethnicity, Early Career and Later Career PIs, New and Prior PIs, and PIs from minority serving institutions, historically black colleges and universities, and tribal colleges and universities (MSIs, HBCUs, TCUs). Data collated from merit review reports are available in the accompanying data repository (https://doi.org/10.5061/dryad.2fqz612rt).
Figure 6—figure supplement 1. Availability of data on funding outcomes by PI race and ethnicity and other demographic characteristics in NSF merit review reports, 1990–2019. Data are organized by organizational level (NSF-wide or directorate-level) and then by proposal and activity type (all proposals, Research proposals, and external review scores and success rates). Information reported within the datasets available from NSF include Ethnicity (exclusive of race), Race and Ethnicity, Early Career and Later Career PIs, New and Prior PIs, and PIs from minority serving institutions, historically black colleges and universities, and tribal colleges and universities (MSIs, HBCUs, TCUs). Data collated from merit review reports are available in the accompanying data repository (https://doi.org/10.5061/dryad.2fqz612rt).CC0 · PubMed Central
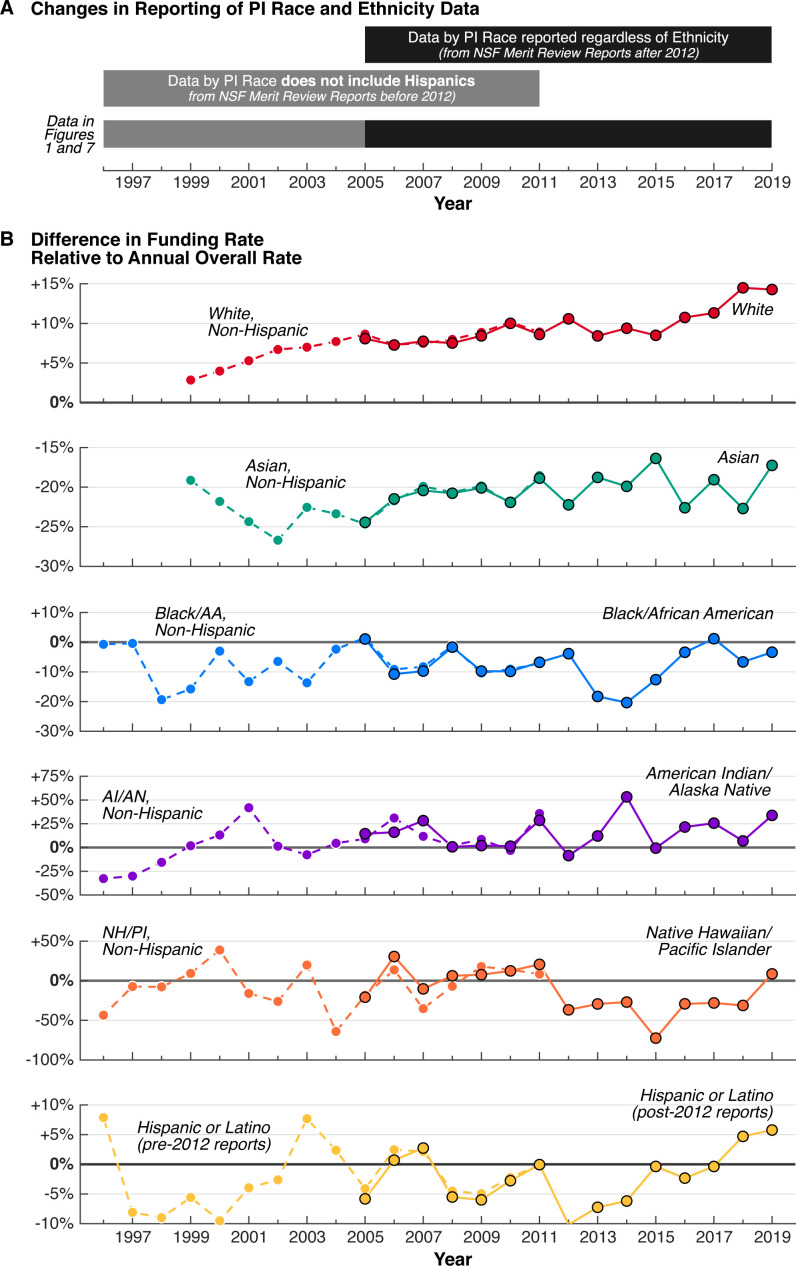
Figure 6—figure supplement 2. The impact of changes in the tabulation of PI race and ethnicity data on relative funding rates, 1996–2019. (A) Graphical representation of the time spans pertaining to the two ways NSF reported race and ethnicity data in the NSF Merit Review Reports, before and after 2012. (B) Comparison of the two datasets in terms of relative funding rates by PI race and ethnicity. The solid line with markers outlined in black represents data from 2005–2019 (Merit Review Reports after and including 2012) where individuals self-identifying as a particular race are included regardless of their ethnicity (Non-Hispanic, Hispanic, or Unknown). The dashed line with solid colored markers represents data from 1996–2011 where individuals are only included in a particular race category if they are Non-Hispanic. Source data: Data S1 in the accompanying data repository (https://doi.org/10.5061/dryad.2fqz612rt).
Figure 6—figure supplement 2. The impact of changes in the tabulation of PI race and ethnicity data on relative funding rates, 1996–2019. (A) Graphical representation of the time spans pertaining to the two ways NSF reported race and ethnicity data in the NSF Merit Review Reports, before and after 2012. (B) Comparison of the two datasets in terms of relative funding rates by PI race and ethnicity. The solid line with markers outlined in black represents data from 2005–2019 (Merit Review Reports after and including 2012) where individuals self-identifying as a particular race are included regardless of their ethnicity (Non-Hispanic, Hispanic, or Unknown). The dashed line with solid colored markers represents data from 1996–2011 where individuals are only included in a particular race category if they are Non-Hispanic. Source data: Data S1 in the accompanying data repository (https://doi.org/10.5061/dryad.2fqz612rt).CC0 · PubMed Central
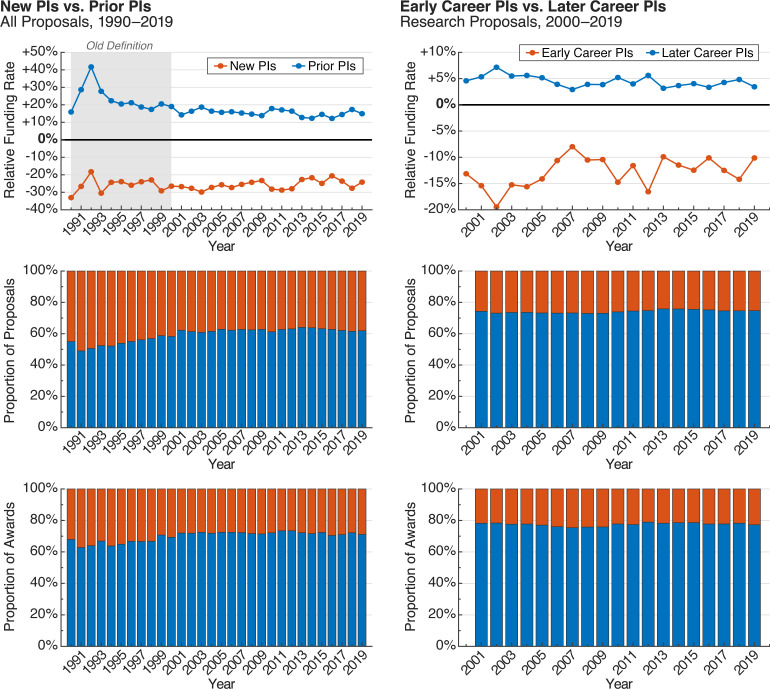
Figure 6—figure supplement 3. Proposals, awards, and relative funding rates for New PIs versus Prior PIs (1990–2019) and Early Career PIs versus Later Career PIs (2000–2019). (Left column) NSF currently defines a New PI is an individual who has not served as the PI or Co-PI on any award from NSF (with the exception of doctoral dissertation awards, graduate or post-doctoral fellowships, research planning grants, or conferences, symposia and workshop grants). The old definition for a New PI, which is applicable to data shown for 1990–2000,, is any individual who had not previously been a PI on any NSF award. (Right column) NSF defines an Early Career PI as an individual within seven years of receiving their last degree at the time of the award. Source data: Data S9 in the accompanying data repository (https://doi.org/10.5061/dryad.2fqz612rt).
Figure 6—figure supplement 3. Proposals, awards, and relative funding rates for New PIs versus Prior PIs (1990–2019) and Early Career PIs versus Later Career PIs (2000–2019). (Left column) NSF currently defines a New PI is an individual who has not served as the PI or Co-PI on any award from NSF (with the exception of doctoral dissertation awards, graduate or post-doctoral fellowships, research planning grants, or conferences, symposia and workshop grants). The old definition for a New PI, which is applicable to data shown for 1990–2000,, is any individual who had not previously been a PI on any NSF award. (Right column) NSF defines an Early Career PI as an individual within seven years of receiving their last degree at the time of the award. Source data: Data S9 in the accompanying data repository (https://doi.org/10.5061/dryad.2fqz612rt).CC0 · PubMed Central
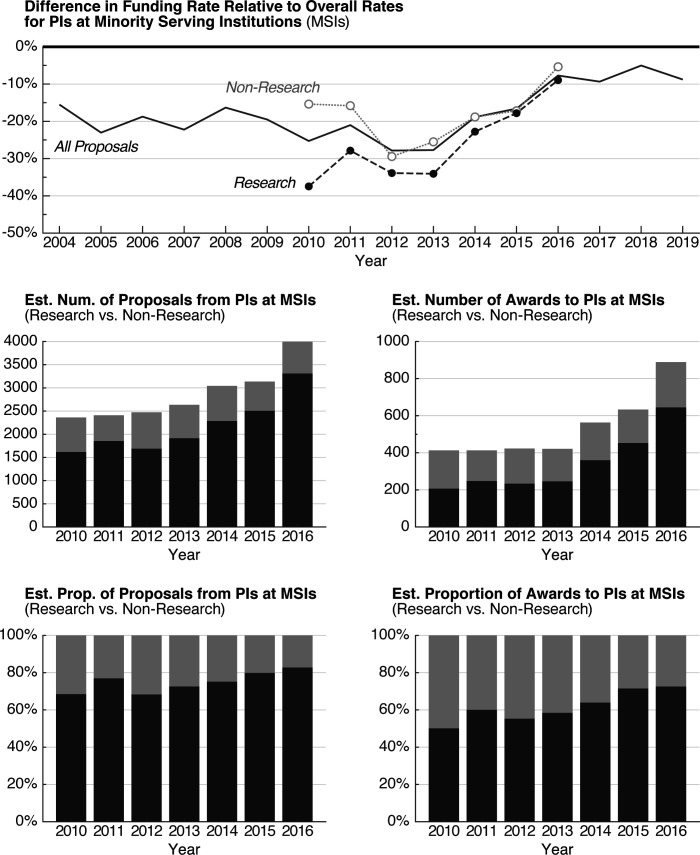
Figure 6—figure supplement 4. Proposals, awards, and relative funding rates for PIs at Minority Serving Institutions. (Top) Relative funding rate for proposals by PIs at minority serving institutions (MSIs). Solid line with no markers is the relative funding rate for all proposals; dark dashed line for Research proposals; and light dotted line for Non-Research proposals. (Middle) Estimated number of Research (dark) and Non-Research (light) proposals from and awards to PIs at MSIs. (Bottom) Estimated proportion of Research vs. Non-Research proposals from and awards to PIs at MSIs. These data should be treated as estimates as they are calculated from values extracted via plot digitization of charts in NSF merit review reports, rather than calculations made from numerical data reported in tabular format. Source data: Data S10 in the accompanying data repository (https://doi.org/10.5061/dryad.2fqz612rt).
Figure 6—figure supplement 4. Proposals, awards, and relative funding rates for PIs at Minority Serving Institutions. (Top) Relative funding rate for proposals by PIs at minority serving institutions (MSIs). Solid line with no markers is the relative funding rate for all proposals; dark dashed line for Research proposals; and light dotted line for Non-Research proposals. (Middle) Estimated number of Research (dark) and Non-Research (light) proposals from and awards to PIs at MSIs. (Bottom) Estimated proportion of Research vs. Non-Research proposals from and awards to PIs at MSIs. These data should be treated as estimates as they are calculated from values extracted via plot digitization of charts in NSF merit review reports, rather than calculations made from numerical data reported in tabular format. Source data: Data S10 in the accompanying data repository (https://doi.org/10.5061/dryad.2fqz612rt).CC0 · PubMed Central
Figure 6—figure supplement 5. Proposals, awards, funding rates, and relative funding rates for PIs in Established Program to Stimulate Competitive Research Jurisdictions, 2001–2019. Top: proposals (blue) and awards (orange) for PIs at EPSCoR jurisdictions. Middle: funding rate for all proposals at NSF (black) and for all proposals by PIs in EPSCoR jurisdictions (blue). Bottom: relative funding rate for all proposals by PIs in EPSCoR jurisdictions. Source data: Data S11 in the accompanying data repository (https://doi.org/10.5061/dryad.2fqz612rt).
Figure 6—figure supplement 5. Proposals, awards, funding rates, and relative funding rates for PIs in Established Program to Stimulate Competitive Research Jurisdictions, 2001–2019. Top: proposals (blue) and awards (orange) for PIs at EPSCoR jurisdictions. Middle: funding rate for all proposals at NSF (black) and for all proposals by PIs in EPSCoR jurisdictions (blue). Bottom: relative funding rate for all proposals by PIs in EPSCoR jurisdictions. Source data: Data S11 in the accompanying data repository (https://doi.org/10.5061/dryad.2fqz612rt).CC0 · PubMed Central
Figure 6—figure supplement 6. Available statistics on a per-PI basis for Research proposals and awards in three-year windows, 1995–2019. (A) Total number of unique PIs applying for Research funding in 3 year windows, 1995–2019. (B) Percentage of PIs awarded funding for Research in each 3 year window. Blue line represents the percentage of PIs with at least one award; orange line represents the percentage of PIs with at least two awards. (C) For PIs with an active Research award, the green line represents trends in average number of awards per PI. (D) The average number of proposals submitted before a PI is successfully awarded funding for a Research proposal. Source data: Data S12 in the accompanying data repository (https://doi.org/10.5061/dryad.2fqz612rt).
Figure 6—figure supplement 6. Available statistics on a per-PI basis for Research proposals and awards in three-year windows, 1995–2019. (A) Total number of unique PIs applying for Research funding in 3 year windows, 1995–2019. (B) Percentage of PIs awarded funding for Research in each 3 year window. Blue line represents the percentage of PIs with at least one award; orange line represents the percentage of PIs with at least two awards. (C) For PIs with an active Research award, the green line represents trends in average number of awards per PI. (D) The average number of proposals submitted before a PI is successfully awarded funding for a Research proposal. Source data: Data S12 in the accompanying data repository (https://doi.org/10.5061/dryad.2fqz612rt).CC0 · PubMed Central
Figure 6—figure supplement 7. Additional trends in the non-reporting of demographic information by PIs, 1999–2019. (A) Percentage of proposals submitted by PIs who provided information about their race, 1999–2019. (B) Percentage of PIs for Research proposals who provided demographic information about their race (blue), ethnicity (orange), and gender (yellow), 2004–2019. This panel differs from A in that the percentages are reported on a per PI-basis, rather than by proposals. No data is available for 2017. Source data: Data S13 in the accompanying data repository (https://doi.org/10.5061/dryad.2fqz612rt).
Figure 6—figure supplement 7. Additional trends in the non-reporting of demographic information by PIs, 1999–2019. (A) Percentage of proposals submitted by PIs who provided information about their race, 1999–2019. (B) Percentage of PIs for Research proposals who provided demographic information about their race (blue), ethnicity (orange), and gender (yellow), 2004–2019. This panel differs from A in that the percentages are reported on a per PI-basis, rather than by proposals. No data is available for 2017. Source data: Data S13 in the accompanying data repository (https://doi.org/10.5061/dryad.2fqz612rt).CC0 · PubMed Central
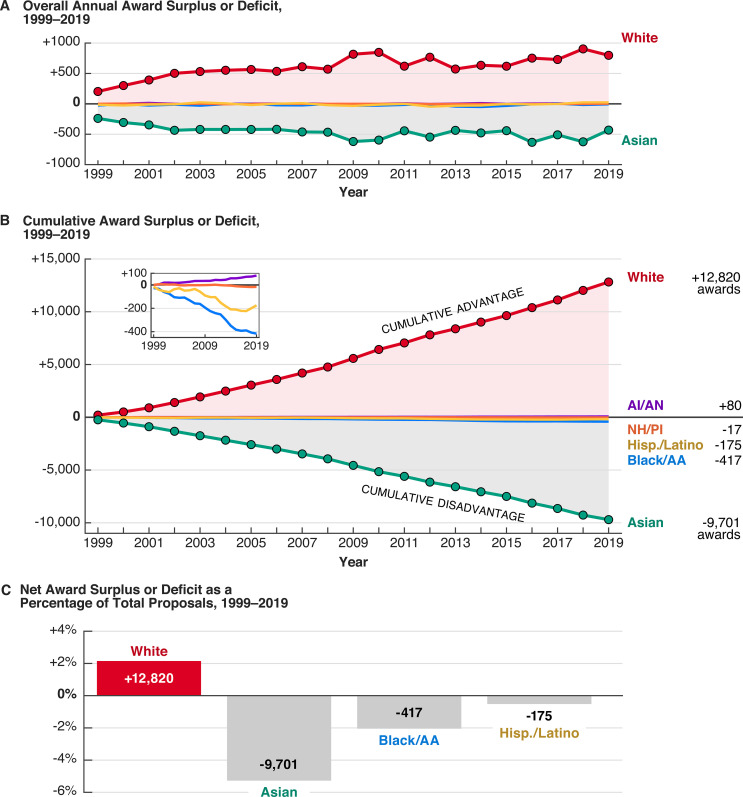
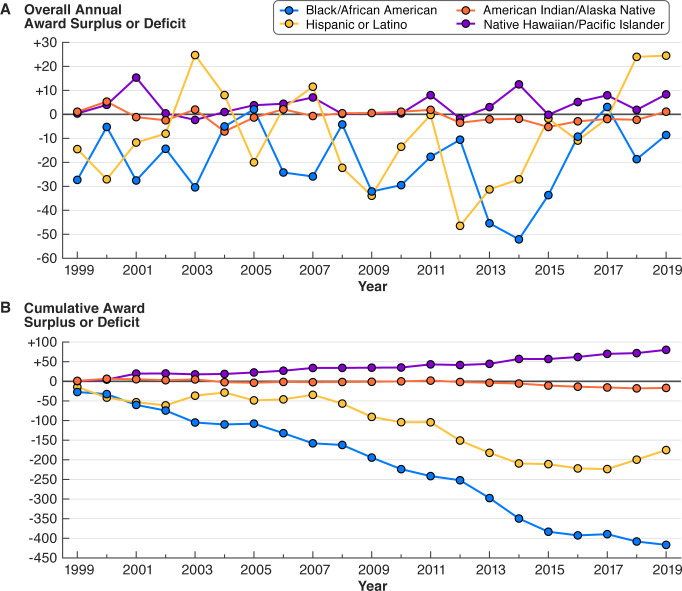
Figure 7. Over 20 years of racially disparate funding outcomes confer a cumulative advantage on white PIs and a cumulative disadvantage on most other groups. (A) Both the annual award surplus to white PIs and the annual award deficit to Asian PIs has increased over time. All other groups have annual award surpluses or deficits between –60 and +30 (Figure 7—figure supplement 1). (B) The cumulative award surplus or deficit to various groups represents thousands of awards received or not given. The small inset shows cumulative numbers for AI/AN, NH/PI, Hispanic or Latino, and Black/AA PIs. (C) Relative to the total number of proposals submitted by each group from 1999 to 2019, the net award surplus or deficit for white, Asian, Black/AA, and Hispanic or Latino PIs.
Figure 7. Over 20 years of racially disparate funding outcomes confer a cumulative advantage on white PIs and a cumulative disadvantage on most other groups. (A) Both the annual award surplus to white PIs and the annual award deficit to Asian PIs has increased over time. All other groups have annual award surpluses or deficits between –60 and +30 (Figure 7—figure supplement 1). (B) The cumulative award surplus or deficit to various groups represents thousands of awards received or not given. The small inset shows cumulative numbers for AI/AN, NH/PI, Hispanic or Latino, and Black/AA PIs. (C) Relative to the total number of proposals submitted by each group from 1999 to 2019, the net award surplus or deficit for white, Asian, Black/AA, and Hispanic or Latino PIs.CC0 · PubMed Central
Figure 7—figure supplement 1. Overall annual and cumulative award surplus and deficit for Black/AA, AI/AN, NH/PI, and Hispanic or Latino PIs, 1999–2019. (A) These trends appear in Figure 7 but are shown here with an adjusted y-axis. (B) This panel is a larger version of the small inset of cumulative trends for AI/AN, NH/PI, Hispanic or Latino, and Black/AA PIs in Figure 7. Source data: Data S1 in the accompanying data repository (https://doi.org/10.5061/dryad.2fqz612rt).
Figure 7—figure supplement 1. Overall annual and cumulative award surplus and deficit for Black/AA, AI/AN, NH/PI, and Hispanic or Latino PIs, 1999–2019. (A) These trends appear in Figure 7 but are shown here with an adjusted y-axis. (B) This panel is a larger version of the small inset of cumulative trends for AI/AN, NH/PI, Hispanic or Latino, and Black/AA PIs in Figure 7. Source data: Data S1 in the accompanying data repository (https://doi.org/10.5061/dryad.2fqz612rt).CC0 · PubMed Central
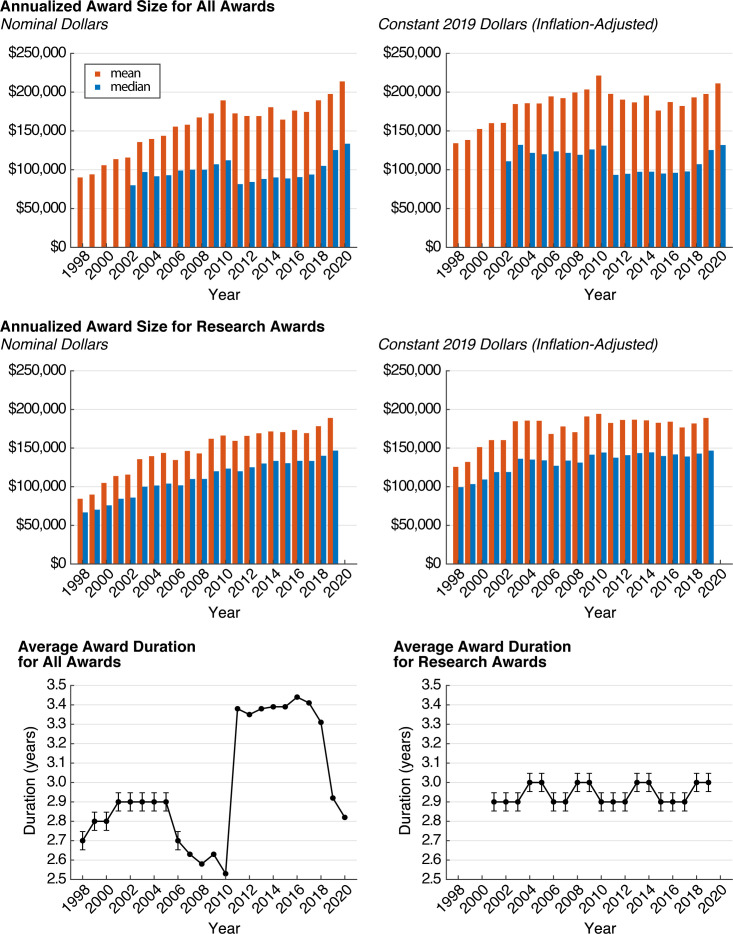
Figure 7—figure supplement 2. Median and average annualized award size and average award duration for all awards and Research awards, 1998–2020. Top: the average (orange) and median (blue) annualized award size for all awards in nominal dollars (left) and constant, inflation-adjusted 2019 dollars (right). Middle: annualized award size for Research awards. Bottom: average award duration for all awards (left) and Research awards (right). Error bars are present for years for which the average award duration was reported only to the tenth decimal place, and thus accounts for uncertainty due to rounding. Source data: Data S7 in the accompanying data repository (https://doi.org/10.5061/dryad.2fqz612rt).
Figure 7—figure supplement 2. Median and average annualized award size and average award duration for all awards and Research awards, 1998–2020. Top: the average (orange) and median (blue) annualized award size for all awards in nominal dollars (left) and constant, inflation-adjusted 2019 dollars (right). Middle: annualized award size for Research awards. Bottom: average award duration for all awards (left) and Research awards (right). Error bars are present for years for which the average award duration was reported only to the tenth decimal place, and thus accounts for uncertainty due to rounding. Source data: Data S7 in the accompanying data repository (https://doi.org/10.5061/dryad.2fqz612rt).CC0 · PubMed Central

Verification

Claims the paper makes

The claims and statistics of this paper haven’t been checked yet.

Run the check — free, no account needed. It reads the open-access text and checks the sources it cites.

A few free checks a day · papers already verified open instantly · results are public

Claims other papers make about this one

Each is checked against this paper’s own text: does it say what the citing paper says it does?

Self-check

Percentages, sums and reported differences re-computed from the paper’s own numbers.

The self-check needs the paper’s full text.

Citations

Cites

Research works printed but not linked: 120

  1. Angwin J, Larson J, Mattu S. 2016. Machine Bias. ProPublica. https://www.propublica.org/article/machine-bias-risk-assessments-in-criminal-sentencing [Accessed November 15, 2022].
  2. Apfelbaum, 2012, Racial color blindness: emergence, practice, and implications, Current Directions in Psychological Science, 21, 205, 10.1177/0963721411434980 · DOI
  3. Awad, 2021, Identity and ethnic/racial self-labeling among Americans of Arab or middle Eastern and North African descent, Identity, 21, 115, 10.1080/15283488.2021.1883277 · DOI
  4. Begeny, 2020, In some professions, women have become well represented, yet gender bias persists—perpetuated by those who think it is not happening, Science Advances, 6, 10.1126/sciadv.aba7814 · DOI
  5. Benjamin, 2019, Race After Technology: Abolitionist Tools for the New Jim Code
  6. Berhe, 2022, Scientists from historically excluded groups face a hostile obstacle course, Nature Geoscience, 15, 2, 10.1038/s41561-021-00868-0 · DOI
  7. Bernard, 2018, No progress on diversity in 40 years, Nature Geoscience, 11, 292, 10.1038/s41561-018-0116-6 · DOI
  8. Bertolero, 2020, Racial and Ethnic Imbalance in Neuroscience Reference Lists and Intersections with Gender, 10.1101/2020.10.12.336230 · DOI
  9. Bol, 2018, The Matthew effect in science funding, PNAS, 115, 4887, 10.1073/pnas.1719557115 · DOI · Paper page
  10. Bol, 2022, Gender-equal funding rates conceal unequal evaluations, Research Policy, 51, 10.1016/j.respol.2021.104399 · DOI
  11. Bonilla-Silva, 2006, Racism without Racists: Color-Blind Racism and the Persistence of Racial Inequality in the United States
  12. Bonilla‐Silva, 2021, What makes systemic racism systemic?, Sociological Inquiry, 91, 513, 10.1111/soin.12420 · DOI · Paper page
  13. Bratter, 2018, Multiracial identification and racial gaps: A work in progress, The ANNALS of the American Academy of Political and Social Science, 677, 69, 10.1177/0002716218758622 · DOI
  14. Broder, 1993, Review of NSF economics proposals: Gender and institutional patterns, The American Economic Review, 83, 964
  15. Buolamwini, 2018, Gender shades: Intersectional accuracy disparities in commercial gender classification, Proceedings of Machine Learning Research, 81, 77
  16. Byrd, 2011, Conflating apples and oranges: Understanding modern forms of racism, Sociology Compass, 5, 1005, 10.1111/j.1751-9020.2011.00420.x · DOI
  17. Carter, 2020, Developing & delivering effective anti-bias training: Challenges & recommendations, Behavioral Science & Policy, 6, 57, 10.1353/bsp.2020.0005 · DOI
  18. Castilla, 2010, The paradox of meritocracy in organizations, Administrative Science Quarterly, 55, 543, 10.2189/asqu.2010.55.4.543 · DOI
  19. Cech, 2013, In Engineering Education for Social Justice, 67, 10.1007/978-94-007-6350-0_4 · DOI
  20. Clair, 2015, International Encyclopedia of the Social & Behavioral Sciences, 857, 10.1016/B978-0-08-097086-8.32122-5 · DOI
  21. Clauset, 2015, Systematic inequality and hierarchy in faculty hiring networks, Science Advances, 1, 10.1126/sciadv.1400005 · DOI · Paper page
  22. Day, 2015, The big consequences of small biases: A simulation of peer review, Research Policy, 44, 1266, 10.1016/j.respol.2015.01.006 · DOI
  23. Dean-Coffey, 2018, What’s race got to do with it? Equity and philanthropic evaluation practice, American Journal of Evaluation, 39, 527, 10.1177/1098214018778533 · DOI
  24. de Souza Briggs X, Hamilton D, McGahey R, Perry A. 2022. To keep promises of achieving racial equity, let’s start keeping score. The Boston Globe. https://www.bostonglobe.com/2022/10/11/opinion/keep-promises-achieving-racial-equity-lets-start-1038 [Accessed November 15, 2022].
  25. Dzirasa, 2020, Revising the a priori hypothesis: Systemic racism has penetrated scientific funding, Cell, 183, 576, 10.1016/j.cell.2020.09.026 · DOI
  26. Eagan, 2015, Stressing out: connecting race, gender, and stress with faculty productivity, The Journal of Higher Education, 86, 923, 10.1353/jhe.2015.0034 · DOI
  27. Gilpin, 2021, Toward an anti-racist approach to biomedical and neuroscience research, The Journal of Neuroscience, 41, 8669, 10.1523/JNEUROSCI.1319-21.2021 · DOI
  28. Ginther, 2011, Race, ethnicity, and NIH research awards, Science, 333, 1015, 10.1126/science.1196783 · DOI
  29. Ginther, 2012, Are race, ethnicity, and medical school affiliation associated with NIH R01 Type 1 award probability for physician investigators?, Academic Medicine, 87, 1516, 10.1097/ACM.0b013e31826d726b · DOI
  30. Ginther, 2016, Gender, race/ethnicity, and national institutes of health R01 research awards: Is there evidence of a double bind for women of color?, Academic Medicine, 91, 1098, 10.1097/ACM.0000000000001278 · DOI
  31. Ginther, 2018, Publications as predictors of racial and ethnic differences in NIH research awards, PLOS ONE, 13, 10.1371/journal.pone.0205929 · DOI
  32. Graves, 2022, Inequality in science and the case for a new agenda, PNAS, 119, 10.1073/pnas.2117831119 · DOI
  33. Gullickson, 2011, Choosing race: multiracial ancestry and identification, Social Science Research, 40, 498, 10.1016/j.ssresearch.2010.12.010 · DOI
  34. Hand, 2016, No pressure: NSF test finds eliminating deadlines halves number of grant proposals, Science, 1, 10.1126/science.aaf9925 · DOI
  35. Handley, 2015, Quality of evidence revealing subtle gender biases in science is in the eye of the beholder, PNAS, 112, 13201, 10.1073/pnas.1510649112 · DOI
  36. Harris, 2002, Who is multiracial? Assessing the complexity of lived race, American Sociological Review, 67, 10.2307/3088948 · DOI · Paper page
  37. Hofstra, 2020, The diversity-innovation paradox in science, PNAS, 117, 9284, 10.1073/pnas.1915378117 · DOI
  38. Hoppe, 2019, Topic choice contributes to the lower rate of NIH awards to African-American/Black scientists, Science Advances, 5, 10.1126/sciadv.aaw7238 · DOI
  39. Hsiang Liao, 2017, Exploring the social effect of outstanding scholars on future research accomplishments, Journal of the Association for Information Science and Technology, 68, 2449, 10.1002/asi.23887 · DOI
  40. Huang, 2020, Historical comparison of gender inequality in scientific careers across countries and disciplines, PNAS, 117, 4609, 10.1073/pnas.1914221117 · DOI
  41. Hur, 2017, Recent trends in the US behavioral and social sciences research (BSSR) workforce, PLOS ONE, 12, 10.1371/journal.pone.0170887 · DOI
  42. Institute of Medicine. 2013. Washington, DC: The National Academies Press. The Experimental Program to Stimulate Competitive Research. https://doi.org/10.17226/18384. · DOI
  43. Intemann, 2009, Why diversity matters: Understanding and applying the diversity component of the National Science Foundation’s broader impacts criterion, Social Epistemology, 23, 249, 10.1080/02691720903364134 · DOI · Paper page
  44. Jimenez, 2019, Underrepresented faculty play a disproportionate role in advancing diversity and inclusion, Nature Ecology & Evolution, 3, 1030, 10.1038/s41559-019-0911-5 · DOI
  45. Kaiser, 2021, NIH director apologizes for ‘structural racism,’ pledges actions, Science, 1, 10.1126/science.abh3223 · DOI
  46. Katz, 2020, Metrics of inequality: The concentration of resources in the US biomedical elite, Science as Culture, 29, 475, 10.1080/09505431.2019.1694882 · DOI
  47. Kevles, 1977, The National Science Foundation and the debate over postwar research policy, 1942–1945: A political interpretation of Science—The Endless Frontier, Isis, 68, 4, 10.1086/351711 · DOI
  48. Kim, 1999, The racial triangulation of Asian Americans, Politics & Society, 27, 105, 10.1177/0032329299027001005 · DOI
  49. Kolluri, 2022, The counter-deficit lens in educational research: Interrogating conceptions of structural oppression, Review of Educational Research, 01, 10.3102/00346543221125225 · DOI
  50. Koning, 2021, Who do we invent for? Patents by women focus more on women’s health, but few women get to invent, Science, 372, 1345, 10.1126/science.aba6990 · DOI
  51. Kozlowski, 2022, Intersectional inequalities in science, PNAS, 119, 10.1073/pnas.2113067119 · DOI
  52. Kraus, 2019, The misperception of racial economic inequality, Perspectives on Psychological Science, 14, 899, 10.1177/1745691619863049 · DOI
  53. Larivière, 2013, Bibliometrics: Global gender disparities in science, Nature, 504, 211, 10.1038/504211a · DOI
  54. Lauer, 2021, Associations of topic-specific peer review outcomes and Institute and Center award rates with funding disparities at the National Institutes of Health, eLife, 10, 10.7554/eLife.67173 · DOI
  55. Lauer, 2021, Inequalities in the distribution of National Institutes of Health research project grant funding, eLife, 10, 10.7554/eLife.71712 · DOI
  56. Leggon, 2006, Women in science: Racial and ethnic differences and the differences they make, Journal of Technology Transfer, 31, 325, 10.1007/s10961-006-7204-2 · DOI
  57. Levitt, 2017, Future of fundamental discovery in US biomedical research, PNAS, 114, 6498, 10.1073/pnas.1609996114 · DOI
  58. Liboiron, 2021, Decolonizing geoscience requires more than equity and inclusion, Nature Geoscience, 14, 876, 10.1038/s41561-021-00861-7 · DOI
  59. Liebler, 2017, America’s churning races: Race and ethnicity response changes between census 2000 and the 2010 census, Demography, 54, 259, 10.1007/s13524-016-0544-0 · DOI
  60. Matias JN, Lewis NA, Hope E. 2021. Universities say they want more diverse faculties. So why is academia still so white?. FiveThirtyEight. https://fivethirtyeight.com/features/universities-say-they-want-more-diverse-faculties-so-why-is-academia-still-so-white [Accessed November 15, 2022].
  61. McCloskey, 2008, The Cult of Statistical Significance, 10.3998/mpub.186351 · DOI
  62. McGee, 2020, Interrogating structural racism in STEM higher education, Educational Researcher, 49, 633, 10.3102/0013189X20972718 · DOI
  63. McGee, 2021, Black, Brown, and Bruised: How Racialized STEM Education Stifles Innovation
  64. Mendoza-Denton, 2017, Differences in STEM doctoral publication by ethnicity, gender and academic field at a large public research university, PLOS ONE, 12, 10.1371/journal.pone.0174296 · DOI
  65. Metcalf, 2018, Broadening the science of broadening participation in STEM through critical mixed methodologies and intersectionality frameworks, American Behavioral Scientist, 62, 580, 10.1177/0002764218768872 · DOI
  66. Mihoko Doyle, 2007, Are racial identities of multiracials stable? Changing self-identification among single and multiple race individuals, Social Psychology Quarterly, 70, 405, 10.1177/019027250707000409 · DOI
  67. Moss-Racusin, 2012, Science faculty’s subtle gender biases favor male students, PNAS, 109, 16474, 10.1073/pnas.1211286109 · DOI · Paper page
  68. Mukherji, 2017, Making the case for real diversity: Redefining underrepresented minority students in public universities, SAGE Open, 7, 10.1177/2158244017707796 · DOI
  69. Murray, 2019, Author-Reviewer Homophily in Peer Review, 10.1101/400515 · DOI
  70. National Academics of Sciences, Engineering, and Medicine. 2019. Washington, DC: The National Academies Press. Minority Serving Institutions: America’s Underutilized Resource for Strengthening the STEM Workforce. https://doi.org/10.17226/25257. · DOI
  71. National Academies of Sciences, Engineering, and Medicine. 2022. Washington, DC: The National Academies Press. Origins, Worlds, and Life: A Decadal Strategy for Planetary Science and Astrobiology 2023-2032. https://doi.org/10.17226/26522. · DOI
  72. Nguyen, 2022, Who are we? Highlighting Nuances in Asian American Experiences in Ecology and Evolutionary Biology, The Bulletin of the Ecological Society of America, 103, 10.1002/bes2.1939 · DOI
  73. Nielsen, 2017, One and a half million medical papers reveal a link between author gender and attention to gender and sex analysis, Nature Human Behaviour, 1, 791, 10.1038/s41562-017-0235-x · DOI
  74. Nikaj, 2018, Examining trends in the diversity of the US National Institutes of Health participating and funded workforce, FASEB Journal, 32, 10.1096/fj.201800639 · DOI
  75. Norton, 2004, Casuistry and social category bias, Journal of Personality and Social Psychology, 87, 817, 10.1037/0022-3514.87.6.817 · DOI
  76. Oliveira, 2019, Comparison of National Institutes of Health grant amounts to first-time male and female principal investigators, JAMA, 321, 898, 10.1001/jama.2018.21944 · DOI
  77. Onyeador, 2021, Moving beyond implicit bias training: policy insights for increasing organizational diversity, Policy Insights from the Behavioral and Brain Sciences, 8, 19, 10.1177/2372732220983840 · DOI
  78. Peters, 2011, Still invisible: enumeration of Indigenous peoples in census questionnaires internationally, Aboriginal Policy Studies, 1, 68, 10.5663/aps.v1i2.11685 · DOI
  79. Poon, 2016, A critical review of the model minority myth in selected literature on Asian Americans and Pacific Islanders in higher education, Review of Educational Research, 86, 469, 10.3102/0034654315612205 · DOI
  80. Posselt, 2014, Toward inclusive excellence in graduate education: constructing merit and diversity in PhD admissions, American Journal of Education, 120, 481, 10.1086/676910 · DOI
  81. Prescod-Weinstein, 2020, Making black women scientists under white empiricism: The racialization of epistemology in physics, Signs, 45, 421, 10.1086/704991 · DOI
  82. Raja, 2022, Colonial history and global economics distort our understanding of deep-time biodiversity, Nature Ecology & Evolution, 6, 145, 10.1038/s41559-021-01608-8 · DOI
  83. Ray, 2019, A theory of racialized organizations, American Sociological Review, 84, 26, 10.1177/0003122418822335 · DOI
  84. Rissler, 2020, Gender differences in grant submissions across science and engineering fields at the NSF, Bioscience, 70, 814, 10.1093/biosci/biaa072 · DOI
  85. Roberts, 2009, Realizing societal benefit from academic research: Analysis of the National Science Foundation’s broader impacts criterion, Social Epistemology, 23, 199, 10.1080/02691720903364035 · DOI
  86. Rockquemore, 2009, Racing to theory or retheorizing race? Understanding the struggle to build a multiracial identity theory, Journal of Social Issues, 65, 13, 10.1111/j.1540-4560.2008.01585.x · DOI
  87. Roksa, 2022, Who is publishing journal articles during graduate school? Racial and gender inequalities in biological sciences over time, Journal of Diversity in Higher Education, 15, 47, 10.1037/dhe0000336 · DOI
  88. Rubin, 2018, Discrimination and collaboration in science, Philosophy of Science, 85, 380, 10.1086/697744 · DOI
  89. Rucker, 2021, Toward an understanding of structural racism: Implications for criminal justice, Science, 374, 286, 10.1126/science.abj7779 · DOI
  90. Schell, 2020, The ecological and evolutionary consequences of systemic racism in urban environments, Science, 369, 10.1126/science.aay4497 · DOI
  91. Seamster, 2018, Against teleology in the study of race: Toward the abolition of the progress paradigm, Sociological Theory, 36, 315, 10.1177/0735275118813614 · DOI
  92. Sege, 2015, Sex differences in institutional support for junior biomedical researchers, JAMA, 314, 1175, 10.1001/jama.2015.8517 · DOI
  93. Settles, 2019, Scrutinized but not recognized: (In)visibility and hypervisibility experiences of faculty of color, Journal of Vocational Behavior, 113, 62, 10.1016/j.jvb.2018.06.003 · DOI
  94. Settles, 2021, Epistemic exclusion: Scholar(ly) devaluation that marginalizes faculty of color, Journal of Diversity in Higher Education, 14, 493, 10.1037/dhe0000174 · DOI
  95. Settles, 2022, Epistemic exclusion of women faculty and faculty of color: Understanding scholar(ly) devaluation as a predictor of turnover intentions, Journal of Higher Education, 93, 31, 10.1080/00221546.2021.1914494 · DOI
  96. Sheltzer, 2014, Elite male faculty in the life sciences employ fewer women, PNAS, 111, 10107, 10.1073/pnas.1403334111 · DOI · Paper page
  97. Stevens, 2021, Fund Black scientists, Cell, 184, 561, 10.1016/j.cell.2021.01.011 · DOI
  98. Sugimoto, 2019, Factors affecting sex-related reporting in medical research: A cross-disciplinary bibliometric analysis, The Lancet, 393, 550, 10.1016/S0140-6736(18)32995-7 · DOI
  99. Taffe, 2021, Racial inequity in grant funding from the US National Institutes of Health, eLife, 10, 10.7554/eLife.65697 · DOI
  100. Thomson, 2021, The very ivory tower: Pathways reproducing racial-ethnic stratification in US academic science, Ethnic and Racial Studies, 44, 1250, 10.1080/01419870.2020.1786144 · DOI
  101. Tilghman, 2021, Concrete steps to diversify the scientific workforce, Science, 372, 133, 10.1126/science.abf9679 · DOI
  102. Tuck, 2013, In Challenging Status Quo Retrenchment: New Directions in Critical Qualitative Research, 3
  103. Uhlmann, 2005, Constructed criteria: redefining merit to justify discrimination, Psychological Science, 16, 474, 10.1111/j.0956-7976.2005.01559.x · DOI
  104. Uhlmann, 2007, “I think it, therefore it’s true”: Effects of self-perceived objectivity on hiring discrimination, Organizational Behavior and Human Decision Processes, 104, 207, 10.1016/j.obhdp.2007.07.001 · DOI · Paper page
  105. UK Research and Innovation. 2020. UKRI. Diversity results for UKRI funding data, 2014–2015 to 2018–2019. https://www.ukri.org/wp-content/uploads/2020/10/UKRI-020920-DiversityResultsForUKRIFundingData2014-19.pdf.
  106. US Office of Management and Budget, 1997, Revisions to the standards for the classification of federal data on race and ethnicity, Federal Register, 62, 58781
  107. Valencia, 1997, The Evolution of Deficit Thinking: Educational Thought and Practice, 10.4324/9780203046586 · DOI
  108. van de Besselaar, 2020, Gender Differences in Research Grant Allocation – a Mixed Picture, 10.48550/arXiv.2205.13641 · DOI
  109. van der Lee, 2015, Gender contributes to personal research funding success in The Netherlands, PNAS, 112, 12349, 10.1073/pnas.1510159112 · DOI
  110. Wahls, 2019, Opinion: The National Institutes of Health needs to better balance funding distributions among US institutions, PNAS, 116, 13150, 10.1073/pnas.1909217116 · DOI
  111. Wang, 1995, Liberals, the progressive left, and the political economy of postwar American science: The National Science Foundation debate revisited, Historical Studies in the Physical and Biological Sciences, 26, 139, 10.2307/27757758 · DOI
  112. Warner, 2016, Faculty promotion and attrition: The importance of coauthor network reach at an academic medical center, Journal of General Internal Medicine, 31, 60, 10.1007/s11606-015-3463-7 · DOI
  113. Way, 2019, Productivity, prominence, and the effects of academic environment, PNAS, 116, 10729, 10.1073/pnas.1817431116 · DOI
  114. Wellcome Trust. 2021. Grant Funding Report. Grant funding data report, 2019/20. https://cms.wellcome.org/sites/default/files/2021-03/Report_Wellcome_Grant_Funding_data_2019-20.pdf.
  115. West, 2013, The role of gender in scholarly authorship, PLOS ONE, 8, 10.1371/journal.pone.0066212 · DOI
  116. White-Lewis, 2020, The facade of fit in faculty search processes, Journal of Higher Education, 91, 833, 10.1080/00221546.2020.1775058 · DOI
  117. Wild, 2022, Wellcome says it has perpetuated “systemic racism” in science, Nature, 609, 10.1038/d41586-022-02299-2 · DOI
  118. Williams JC, Phillips KW, Hall EV. 2015. Work Life Law. Double Jeopardy? Gender Bias Against Women in Science. https://worklifelaw.org/publications/Double-Jeopardy-Report_v6_full_web-sm.pdf.
  119. Zambrana, 2018, Toxic Ivory Towers: The Consequences of Work Stress on Underrepresented Minority Faculty
  120. Zimmermann, 2022, Award rate inequities in biomedical research, PLOS ONE, 17, 10.1371/journal.pone.0270612 · DOI

Cited by

Sorted by citations

See all 127

Metadata

Authors
Chen, C. Y., Kahanamoku, S. S., Tripati, A., Alegado, R. A., Morris, V. R., Andrade, K., & Hosbey, J.
Venue
eLife
Published
2022-11-29
Volume
11
ISSN
2050-084X
Cited by
127
References
19
Language
en
Funders
  • National Science Foundation (DGE 2146752)
  • David and Lucile Packard Foundation
  • Alfred P. Sloan Foundation
  • Lawrence Livermore National Laboratory (DE-AC52-07NA27344)

About these checks

Registry, retraction, Cites and statistics results are computed, not judged, with one exception: a printed reference that no index lists is read once by a model before it counts as a citation error. Claims are extracted by a model and kept only when their quote appears verbatim in the text; each cited source is then checked, with a model’s help, for whether it says what the claim relies on. Those verdicts can be wrong — read the claim’s quote and the cited source before relying on one.

Statistics and arithmetic are recomputed, not judged.

Confidence bands are shown only for fields calibrated on our annotated test set. None is calibrated yet, so no band is shown.

What counts as a claim ›How we measure confidence ›How we check this ›

Are you an author, or do you see a problem with this page? Request a review