Cited by 10Lysosomal Storage Disorders ResearchGlycogen Storage Diseases and MyoclonusProteoglycans and glycosaminoglycans research

The DOI matches its Crossref record; 2 of the 2 references it cites were found in a registry or an index.

Structure of the human heparan-α-glucosaminide N-acetyltransferase (HGSNAT)

Open access

Published version of a preprint

Abstract

Degradation of heparan sulfate (HS), a glycosaminoglycan (GAG) comprised of repeating units of N -acetylglucosamine and glucuronic acid, begins in the cytosol and is completed in the lysosomes. Acetylation of the terminal non-reducing amino group of α-D-glucosamine of HS is essential for its complete breakdown into monosaccharides and free sulfate. Heparan-α-glucosaminide N -acetyltransferase (HGSNAT), a resident of the lysosomal membrane, catalyzes this essential acetylation reaction by accepting and transferring the acetyl group from cytosolic acetyl-CoA to terminal α-D-glucosamine of HS in the lysosomal lumen. Mutation-induced dysfunction in HGSNAT causes abnormal accumulation of HS within the lysosomes and leads to an autosomal recessive neurodegenerative lysosomal storage disorder called mucopolysaccharidosis IIIC (MPS IIIC). There are no approved drugs or treatment strategies to cure or manage the symptoms of, MPS IIIC. Here, we use cryo-electron microscopy (cryo-EM) to determine a high-resolution structure of the HGSNAT-acetyl-CoA complex, the first step in the HGSNAT-catalyzed acetyltransferase reaction. In addition, we map the known MPS IIIC mutations onto the structure and elucidate the molecular basis for mutation-induced HGSNAT dysfunction.

Overview

The claims and statistics of this paper haven’t been checked yet.

Run the check — free, no account needed. It reads the open-access text and checks the sources it cites.

A few free checks a day · papers already verified open instantly · results are public

Integrity signals

Registry

Crossref · 10.7554/elife.93510

Cites

2 of 2 references verified0 citation errors · 0 not checkable

Statistics

Figures

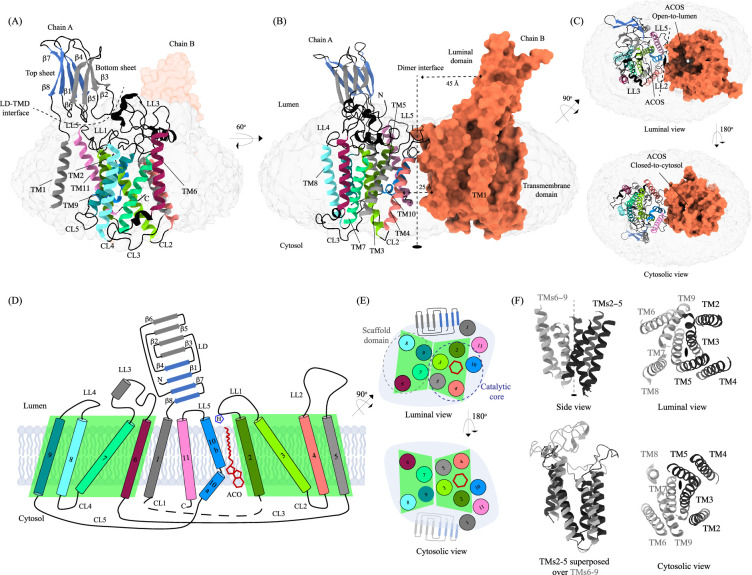
Figure 1. Structure of heparan-α-glucosaminide N-acetyltransferase (HGSNAT). Panels (A) and (B) show two different orientations of the HGSNAT dimer that highlight (dashed lines) the LD-TMD interface and dimer interface, respectively. Micelle is displayed in gray. Chain A is displayed as a cartoon and chain B as an orange surface. All the luminal loops (LLs), cytosolic loops (CLs), and the loops that connect β-sheets are shown in black. The top and bottom sheets in the luminal domain (LD) are colored blue and gray, respectively. The twofold rotation axis is displayed as a dashed line with an ellipsoid. (C) Luminal (top) and cytosolic (bottom) views of the protein. The surface representation of chain B suggests that the acetyl-CoA binding site (ACOS) is more accessible from the luminal side (top) than the cytosolic side (bottom). (D) 2D topology of HGSNAT and YeiB family. The helices and strands in the topology are colored similarly to the 3D structure. Transmembrane helices (TMs) 2–5 and 6–9 form two bundles (4+4), highlighted by green parallelograms, that are related to each other by a twofold rotation parallel to the plane of the membrane. TMs 1, 10, and 11 do not seem involved in this internal symmetry, with TM10 being bent in the plane of the membrane into two halves TM10a and TM10b. The relative position of bound ACO and active site H269 of LL1 are indicated. (E) Luminal (top) and cytosolic (bottom) views of the protein topology. TMs 2–5 and TM10 enclose ACOS (red hexagon) and are referred to as catalytic core (blue dashed oval). TMs 6–9 will be referred to as scaffold domain (gray dashed oval). (F) 4+4 bundle formed by TMs 2–5 (black) and TMs 6–9 (gray) are related by a twofold rotation. The last sub-panel (bottom left) shows a superposition of TMs 2–5 on TMs 6–9.
Figure 1. Structure of heparan-α-glucosaminide N-acetyltransferase (HGSNAT). Panels (A) and (B) show two different orientations of the HGSNAT dimer that highlight (dashed lines) the LD-TMD interface and dimer interface, respectively. Micelle is displayed in gray. Chain A is displayed as a cartoon and chain B as an orange surface. All the luminal loops (LLs), cytosolic loops (CLs), and the loops that connect β-sheets are shown in black. The top and bottom sheets in the luminal domain (LD) are colored blue and gray, respectively. The twofold rotation axis is displayed as a dashed line with an ellipsoid. (C) Luminal (top) and cytosolic (bottom) views of the protein. The surface representation of chain B suggests that the acetyl-CoA binding site (ACOS) is more accessible from the luminal side (top) than the cytosolic side (bottom). (D) 2D topology of HGSNAT and YeiB family. The helices and strands in the topology are colored similarly to the 3D structure. Transmembrane helices (TMs) 2–5 and 6–9 form two bundles (4+4), highlighted by green parallelograms, that are related to each other by a twofold rotation parallel to the plane of the membrane. TMs 1, 10, and 11 do not seem involved in this internal symmetry, with TM10 being bent in the plane of the membrane into two halves TM10a and TM10b. The relative position of bound ACO and active site H269 of LL1 are indicated. (E) Luminal (top) and cytosolic (bottom) views of the protein topology. TMs 2–5 and TM10 enclose ACOS (red hexagon) and are referred to as catalytic core (blue dashed oval). TMs 6–9 will be referred to as scaffold domain (gray dashed oval). (F) 4+4 bundle formed by TMs 2–5 (black) and TMs 6–9 (gray) are related by a twofold rotation. The last sub-panel (bottom left) shows a superposition of TMs 2–5 on TMs 6–9.CC BY · PubMed Central
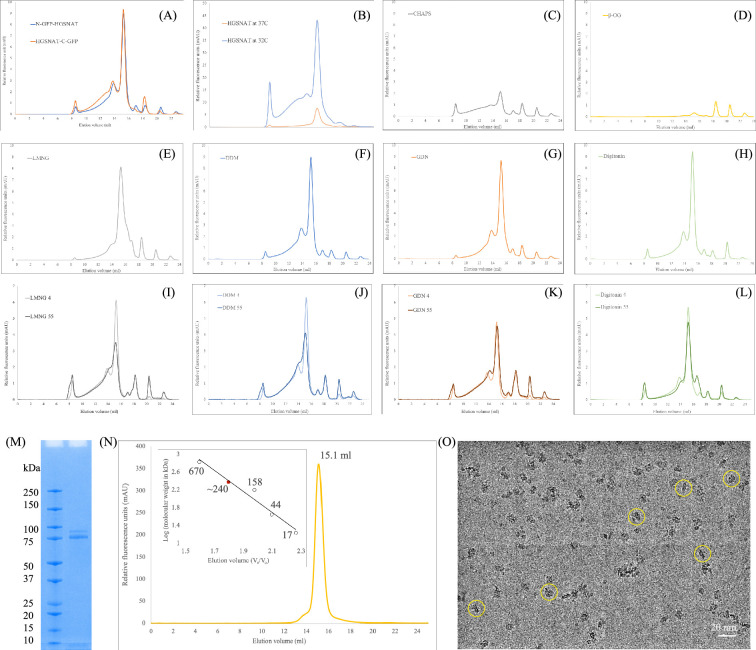
Figure 1—figure supplement 1. Purification of heparan-α-glucosaminide N-acetyltransferase (HGSNAT). (A) Comparison of expression of N- and C-terminal GFP fusions of Heparan-α-glucosaminide N-acetyltransferase (HGSNAT) in HEK293S GnTI- cell lysates, solubilized in 1% DDM. (B) Comparison of relative overexpression of N-GFP-HGSNAT in cultures grown at 37°C and 32°C, post-transduction. (C–H) Relative solubility and homogeneity comparison in 1% of CHAPS, β-OG, LMNG, DDM, GDN, and digitonin, respectively, prepared in 25 mM Tris-HCl, pH 7.5, 200 mM NaCl, 1 mM PMSF, 0.8 μM aprotinin, 2 μg/mL leupeptin, and 2 μM pepstatin A. (I–L) Comparison of relative thermal stability of detergent solubilized HGSNAT in 1% of LMNG, DDM, GDN, and digitonin, respectively. Samples analyzed after heat treatment at 55 °C for 15 min have been marked with a suffix 55, and samples stored in cold room are marked with a suffix 4. (M) SDS-PAGE (12%) showing purity and monomeric molecular weight of HGSNAT. Although, monomeric molecular weight is ~100 kDa, the full-length GFP fusion of HGSNAT, like most eukaryotic membrane proteins, displays anomalous electrophoretic mobility and runs around 75 kDa. (N) Intrinsic tryptophan fluorescence size-exclusion chromatogram of purified HGSNAT analyzed on Superose 6 Increase 10/300 GL column at 0.5 ml/min flowrate in LMNG-based FSEC running buffer. Red dot on the standard plot (log of protein molecular weight kDa) vs. ratio of the elution volume to the void volume (Ve/Vo) indicates that recombinant N-GFP-HGSNAT elutes at 15.1 ml corresponding to a dimer of ~240 kDa. (O) Representative micrograph imaged on Titan Krios using UltrAuFoil holey-gold 300 mesh 1.2/1.3 μm grid of vitrified N-GFP-HGSNAT at 0.9 mg/ml. The protein (yellow circles) distribution on grids, along with SDS-PAGE and size-exclusion chromatogram shows a monodisperse sample preparation.
Figure 1—figure supplement 1. Purification of heparan-α-glucosaminide N-acetyltransferase (HGSNAT). (A) Comparison of expression of N- and C-terminal GFP fusions of Heparan-α-glucosaminide N-acetyltransferase (HGSNAT) in HEK293S GnTI- cell lysates, solubilized in 1% DDM. (B) Comparison of relative overexpression of N-GFP-HGSNAT in cultures grown at 37°C and 32°C, post-transduction. (C–H) Relative solubility and homogeneity comparison in 1% of CHAPS, β-OG, LMNG, DDM, GDN, and digitonin, respectively, prepared in 25 mM Tris-HCl, pH 7.5, 200 mM NaCl, 1 mM PMSF, 0.8 μM aprotinin, 2 μg/mL leupeptin, and 2 μM pepstatin A. (I–L) Comparison of relative thermal stability of detergent solubilized HGSNAT in 1% of LMNG, DDM, GDN, and digitonin, respectively. Samples analyzed after heat treatment at 55 °C for 15 min have been marked with a suffix 55, and samples stored in cold room are marked with a suffix 4. (M) SDS-PAGE (12%) showing purity and monomeric molecular weight of HGSNAT. Although, monomeric molecular weight is ~100 kDa, the full-length GFP fusion of HGSNAT, like most eukaryotic membrane proteins, displays anomalous electrophoretic mobility and runs around 75 kDa. (N) Intrinsic tryptophan fluorescence size-exclusion chromatogram of purified HGSNAT analyzed on Superose 6 Increase 10/300 GL column at 0.5 ml/min flowrate in LMNG-based FSEC running buffer. Red dot on the standard plot (log of protein molecular weight kDa) vs. ratio of the elution volume to the void volume (Ve/Vo) indicates that recombinant N-GFP-HGSNAT elutes at 15.1 ml corresponding to a dimer of ~240 kDa. (O) Representative micrograph imaged on Titan Krios using UltrAuFoil holey-gold 300 mesh 1.2/1.3 μm grid of vitrified N-GFP-HGSNAT at 0.9 mg/ml. The protein (yellow circles) distribution on grids, along with SDS-PAGE and size-exclusion chromatogram shows a monodisperse sample preparation.CC BY · PubMed Central
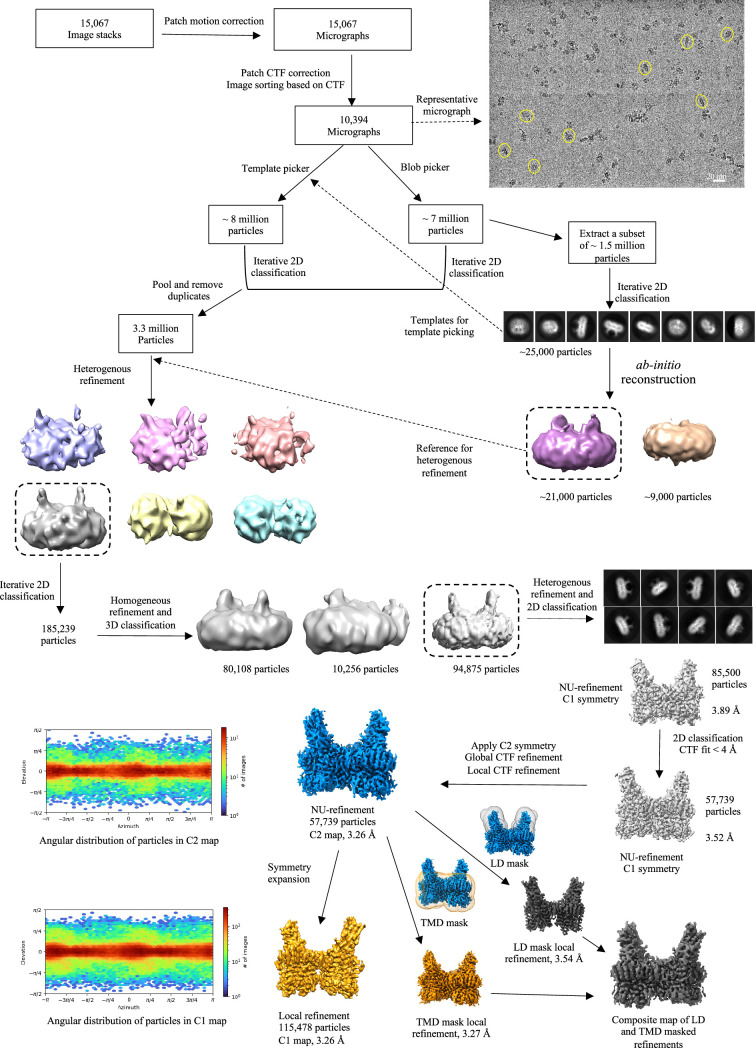
Figure 1—figure supplement 2. Cryo-electron microscopy (Cryo-EM) data processing workflow. The data was entirely processed in cryoSPARC. A representative motion-corrected micrograph with single heparan-α-glucosaminide N-acetyltransferase (HGSNAT) particles (yellow circles) is highlighted. A subset of (1.5 million) particles picked by blob picker were extracted and cleaned by 2D classification to generate 2D templates for template-based picking and an ab-initio volume to be used as reference input for subsequent heterogenous refinement jobs (dashed arrows). Particles picked using template picker and blob picker were individually cleaned by 2D classification to remove obvious junk particles and then were pooled and duplicates were removed for sorting by heterogenous refinement, and iterative 2D and 3D classification. Throughout the processing workflow classes with most well-resolved luminal domain was used as input references for the subsequent steps of processing (highlighted by a dashed boxes). A resultant stack of 85,500 particles (representative 2D classes highlighted) was further cleaned up based on CTF fit (<4 Å) to end up with a final particle stack of about 57000 particles. C2 symmetry was applied at this stage and non-uniform and contrast transfer function (CTF) refinements were performed to yield a C2 map at 3.26 Å. This map was used for model building and analyzing the structure of HGSNAT. A C1 map was generated by symmetry expansion of the final particle stack followed by local refinement to compare the quality of data with and without C2 symmetry application. Local refinements with masks focused on luminal domain (LD) and transmembrane domain (TMD) domain were performed separately, and a composite map was generated by combining these local refined maps to improve the density in these regions. The composite map was only used to finalize the fit of LBD side chains in the final model.
Figure 1—figure supplement 2. Cryo-electron microscopy (Cryo-EM) data processing workflow. The data was entirely processed in cryoSPARC. A representative motion-corrected micrograph with single heparan-α-glucosaminide N-acetyltransferase (HGSNAT) particles (yellow circles) is highlighted. A subset of (1.5 million) particles picked by blob picker were extracted and cleaned by 2D classification to generate 2D templates for template-based picking and an ab-initio volume to be used as reference input for subsequent heterogenous refinement jobs (dashed arrows). Particles picked using template picker and blob picker were individually cleaned by 2D classification to remove obvious junk particles and then were pooled and duplicates were removed for sorting by heterogenous refinement, and iterative 2D and 3D classification. Throughout the processing workflow classes with most well-resolved luminal domain was used as input references for the subsequent steps of processing (highlighted by a dashed boxes). A resultant stack of 85,500 particles (representative 2D classes highlighted) was further cleaned up based on CTF fit (<4 Å) to end up with a final particle stack of about 57000 particles. C2 symmetry was applied at this stage and non-uniform and contrast transfer function (CTF) refinements were performed to yield a C2 map at 3.26 Å. This map was used for model building and analyzing the structure of HGSNAT. A C1 map was generated by symmetry expansion of the final particle stack followed by local refinement to compare the quality of data with and without C2 symmetry application. Local refinements with masks focused on luminal domain (LD) and transmembrane domain (TMD) domain were performed separately, and a composite map was generated by combining these local refined maps to improve the density in these regions. The composite map was only used to finalize the fit of LBD side chains in the final model.CC BY · PubMed Central
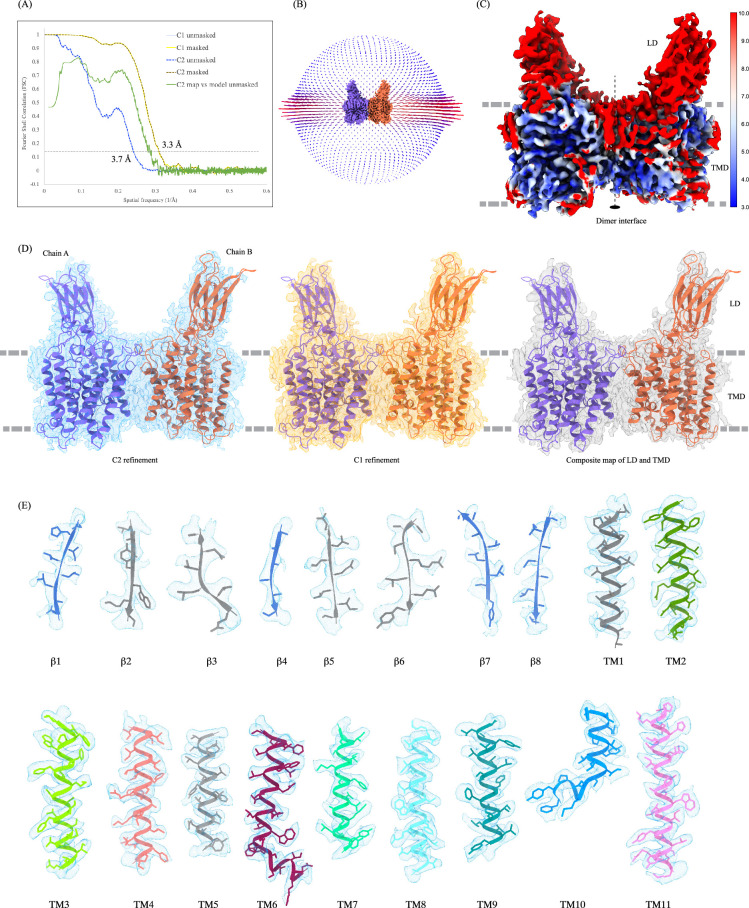
Figure 1—figure supplement 3. Cryo-electron microscopy (Cryo-EM) data quality, reconstruction, and model building. (A) Fourier shell coefficient (FSC) curves for cross-validation. The final masked heparan-α-glucosaminide N-acetyltransferase (HSGNAT) (C1: light yellow; C2: dark yellow dashed) and unmasked (C1: light blue; C2: dark blue dashed) refinement maps. Model vs. final C2 map unmasked (green). Gray and black dashed lines indicate FSC = 0.143 and FSC = 0.5 thresholds, respectively. FSC curves were calculated using Mtriage in Phenix. (B) Angular distribution of particles used in the final reconstruction. (C) C2 map colored by estimated local resolution. (D) HGSNAT modeled by ModelAngelo into the C2 map (blue). The fit of the same model in C1 (orange) and composite map (gray) of LD and TMD created in ChimeraX. All maps are displayed at level 0.21 in ChimeraX. (E) Cryo-EM density of all the secondary structure elements, β1-β8 and TMs 1–11, shown in light blue (display level between 0.18–0.25 in ChimeraX). Side chains for almost all the elements could be modeled unambiguously into the density. At places with missing density, the side chains were trimmed to Cβ.
Figure 1—figure supplement 3. Cryo-electron microscopy (Cryo-EM) data quality, reconstruction, and model building. (A) Fourier shell coefficient (FSC) curves for cross-validation. The final masked heparan-α-glucosaminide N-acetyltransferase (HSGNAT) (C1: light yellow; C2: dark yellow dashed) and unmasked (C1: light blue; C2: dark blue dashed) refinement maps. Model vs. final C2 map unmasked (green). Gray and black dashed lines indicate FSC = 0.143 and FSC = 0.5 thresholds, respectively. FSC curves were calculated using Mtriage in Phenix. (B) Angular distribution of particles used in the final reconstruction. (C) C2 map colored by estimated local resolution. (D) HGSNAT modeled by ModelAngelo into the C2 map (blue). The fit of the same model in C1 (orange) and composite map (gray) of LD and TMD created in ChimeraX. All maps are displayed at level 0.21 in ChimeraX. (E) Cryo-EM density of all the secondary structure elements, β1-β8 and TMs 1–11, shown in light blue (display level between 0.18–0.25 in ChimeraX). Side chains for almost all the elements could be modeled unambiguously into the density. At places with missing density, the side chains were trimmed to Cβ.CC BY · PubMed Central
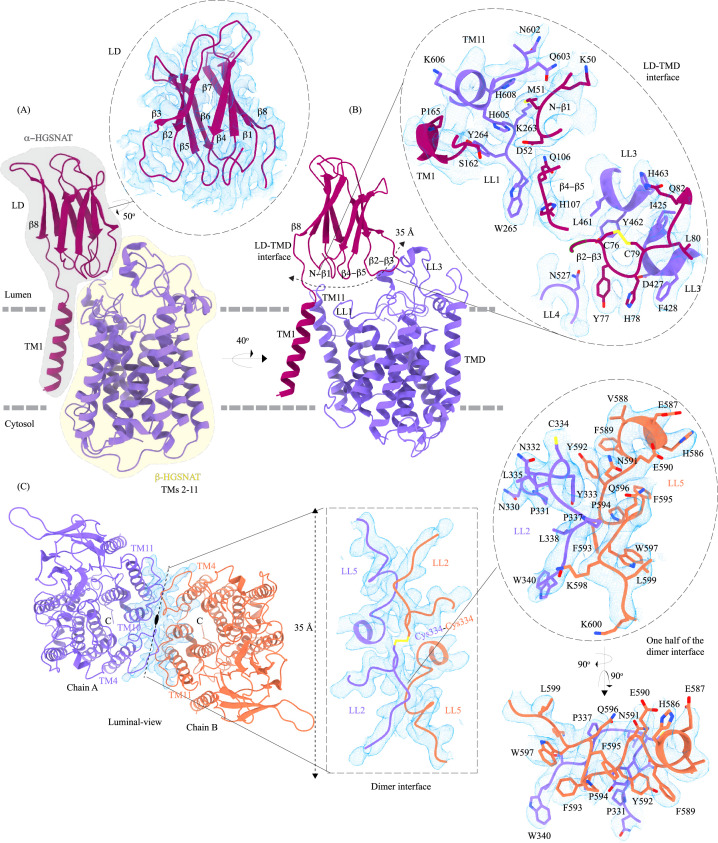
Figure 2. Domain organization, and LD-TMD and dimer interfaces of heparan-α-glucosaminide N-acetyltransferase (HGSNAT). (A) HGSNAT is predicted to be proteolyzed into two chains of unequal size - α-HGSNAT (dark magenta cartoon, gray shaded area) and β-HGSNAT (purple cartoon, yellow shaded area). The site for proteolysis remains debated. Based on our structure and prediction of HGSNAT structures from other kingdoms (Figure 2—figure supplement 1), we have represented α- and β-HGSNAT fragments as shown in panel A. The inset (dashed oval) shows the luminal domain (dark magenta) fit to cryo-electron microscopy (cryo-EM) density (blue; display level 0.21 of the composite map in ChimeraX) (Figure 1—figure supplement 3). The lysosomal membrane is shown as a dashed gray line. (B) LD-TMD interface is highlighted (dashed line). Inset highlights the residues that interact at the LD-TMD interface, and cryo-EM density for the same (blue; display level 0.25 of the 3.26 Å C2 refined map in ChimeraX). C76-C79 disulfide of β2-β3 turns is shown as yellow sticks, while the residue sidechains are colored the same as their secondary structure elements, with heteroatoms highlighted. (C) Luminal view of the protein with dimer interface highlighted (dashed line). Inset (dashed rectangle) highlights LL2 and LL5 that line the dimer interface, and the C334-C334 inter-chain disulfide (yellow) between the chains A (purple) and B (orange). The dashed oval inset shows one-half of the dimer interface with LL2 and LL5 of chains A and B, respectively, contributing other hydrophobic interactions that stabilize the dimer interface. The cryo-EM density in panel C is displayed as blue mesh (display level 0.22 of the C2 refine map in ChimeraX).
Figure 2. Domain organization, and LD-TMD and dimer interfaces of heparan-α-glucosaminide N-acetyltransferase (HGSNAT). (A) HGSNAT is predicted to be proteolyzed into two chains of unequal size - α-HGSNAT (dark magenta cartoon, gray shaded area) and β-HGSNAT (purple cartoon, yellow shaded area). The site for proteolysis remains debated. Based on our structure and prediction of HGSNAT structures from other kingdoms (Figure 2—figure supplement 1), we have represented α- and β-HGSNAT fragments as shown in panel A. The inset (dashed oval) shows the luminal domain (dark magenta) fit to cryo-electron microscopy (cryo-EM) density (blue; display level 0.21 of the composite map in ChimeraX) (Figure 1—figure supplement 3). The lysosomal membrane is shown as a dashed gray line. (B) LD-TMD interface is highlighted (dashed line). Inset highlights the residues that interact at the LD-TMD interface, and cryo-EM density for the same (blue; display level 0.25 of the 3.26 Å C2 refined map in ChimeraX). C76-C79 disulfide of β2-β3 turns is shown as yellow sticks, while the residue sidechains are colored the same as their secondary structure elements, with heteroatoms highlighted. (C) Luminal view of the protein with dimer interface highlighted (dashed line). Inset (dashed rectangle) highlights LL2 and LL5 that line the dimer interface, and the C334-C334 inter-chain disulfide (yellow) between the chains A (purple) and B (orange). The dashed oval inset shows one-half of the dimer interface with LL2 and LL5 of chains A and B, respectively, contributing other hydrophobic interactions that stabilize the dimer interface. The cryo-EM density in panel C is displayed as blue mesh (display level 0.22 of the C2 refine map in ChimeraX).CC BY · PubMed Central
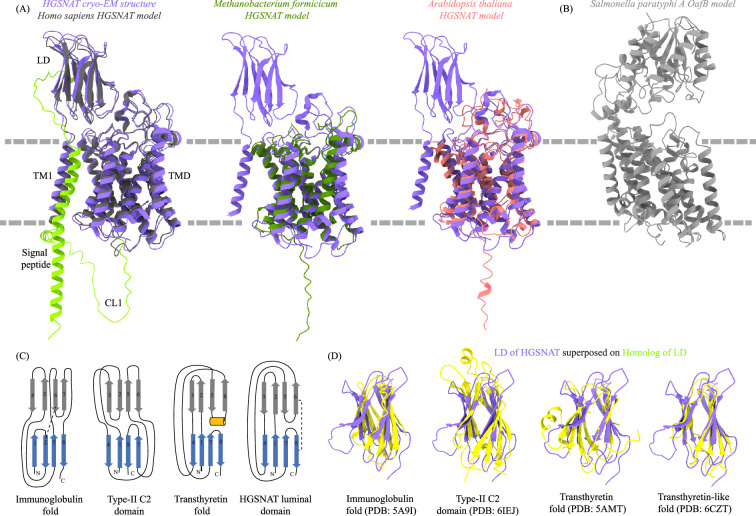
Figure 2—figure supplement 1. Homologs of heparan-α-glucosaminide N-acetyltransferase (HGSNAT). (A) Superposition of HGSNAT cryo-electron microscopy (cryo-EM) structure (purple) with the AlphaFold models of human (Uniprot: Q68CP4, dark gray), Methanobacterium formicicum (Uniprot: K2QAW2, green), and Arabidopsis thaliana (Uniprot: A0A5S9Y8V3, pink) HGSNATs. Cα RMSDs of the superpositions are 1.34 Å, 1.17 Å, and 1.13 Å respectively, suggesting a conserved HGSNAT fold across different kingdoms. AlphaFold model of HGSNAT shown here is of isoform 1, that has extra 28 residues on the N-term as compared to isoform 2. The structure is of isoform 2. The cryo-EM density did not allow modeling of residues upstream of β1 on the N-terminus and CL1, which have been highlighted yellow in the AlphaFold model. (B) AlphaFold model of acetyltransferase model of Salmonella paratyphi A OafB, an O-antigen modifying transmembrane acetyltransferase of the acyltransferase-3/acetyl-CoA transporter (ATAT) family within the TmAT superfamily (Uniprot: A0A0H2WM30). Despite predicted to be in the same superfamily as HGSNAT, a meaningful alignment and similarity to HGSNAT was not observed, highlighting the diversity of membrane bound acetyltransferases. (C) Comparison of topologies of immunoglobulin (Ig) fold, type-II C2 domain, and transthyretin fold with luminal domain (LD) of HGSNAT. Strands in two sheets are colored blue and gray and conserved helical turn in transthyretin fold is shown in orange. Conserved disulfides are shown as dashed lines. (D) Superposition of structures of Ig fold (PDB: 5A9I), type-II C2 domain (PDB: 6IEJ), transthyretin fold (PDB: 5AMT), and transthyretin-like domain (PDB: 6CZT) onto LD of HGSNAT. Based on the topology and structure superposition, it appears that LD is transthyretin-like domain.
Figure 2—figure supplement 1. Homologs of heparan-α-glucosaminide N-acetyltransferase (HGSNAT). (A) Superposition of HGSNAT cryo-electron microscopy (cryo-EM) structure (purple) with the AlphaFold models of human (Uniprot: Q68CP4, dark gray), Methanobacterium formicicum (Uniprot: K2QAW2, green), and Arabidopsis thaliana (Uniprot: A0A5S9Y8V3, pink) HGSNATs. Cα RMSDs of the superpositions are 1.34 Å, 1.17 Å, and 1.13 Å respectively, suggesting a conserved HGSNAT fold across different kingdoms. AlphaFold model of HGSNAT shown here is of isoform 1, that has extra 28 residues on the N-term as compared to isoform 2. The structure is of isoform 2. The cryo-EM density did not allow modeling of residues upstream of β1 on the N-terminus and CL1, which have been highlighted yellow in the AlphaFold model. (B) AlphaFold model of acetyltransferase model of Salmonella paratyphi A OafB, an O-antigen modifying transmembrane acetyltransferase of the acyltransferase-3/acetyl-CoA transporter (ATAT) family within the TmAT superfamily (Uniprot: A0A0H2WM30). Despite predicted to be in the same superfamily as HGSNAT, a meaningful alignment and similarity to HGSNAT was not observed, highlighting the diversity of membrane bound acetyltransferases. (C) Comparison of topologies of immunoglobulin (Ig) fold, type-II C2 domain, and transthyretin fold with luminal domain (LD) of HGSNAT. Strands in two sheets are colored blue and gray and conserved helical turn in transthyretin fold is shown in orange. Conserved disulfides are shown as dashed lines. (D) Superposition of structures of Ig fold (PDB: 5A9I), type-II C2 domain (PDB: 6IEJ), transthyretin fold (PDB: 5AMT), and transthyretin-like domain (PDB: 6CZT) onto LD of HGSNAT. Based on the topology and structure superposition, it appears that LD is transthyretin-like domain.CC BY · PubMed Central
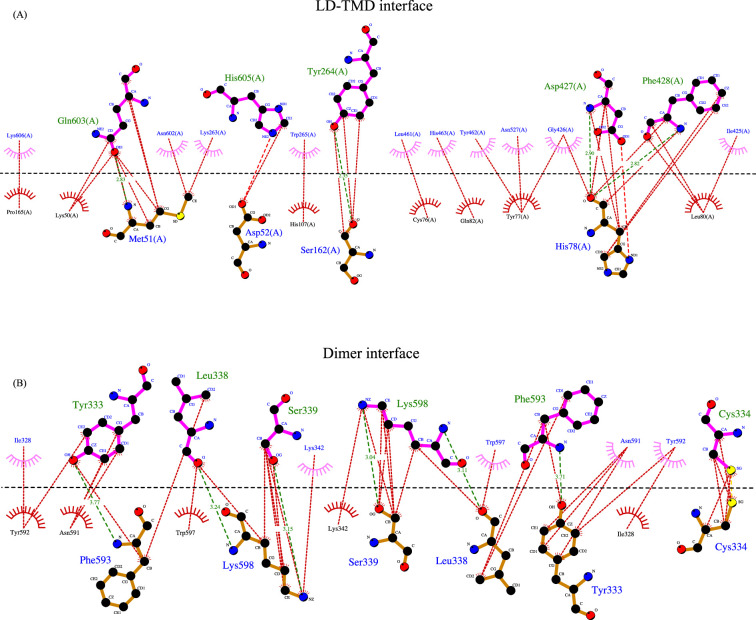
Figure 2—figure supplement 2. Interactions at LD-TMD and dimer interface. A 2D depiction of network of interactions (<4.5 Å) between residues at the LD-TMD interface (top, A) and at the dimer interface (bottom, B) generated in LigPlot+. Hydrogen bonds are shown as dashed lines with bond distance. Nonbonded and hydrophobic interactions are shown as dotted lines. Residues involved in nonbonded interactions are displayed as eye lashes. Chain A and chain B residues are shown in blue and orange. Dashed black line indicates the interface. The sulfurs of involved in disulfide bond at the dimer interface are highlighted in yellow.
Figure 2—figure supplement 2. Interactions at LD-TMD and dimer interface. A 2D depiction of network of interactions (<4.5 Å) between residues at the LD-TMD interface (top, A) and at the dimer interface (bottom, B) generated in LigPlot+. Hydrogen bonds are shown as dashed lines with bond distance. Nonbonded and hydrophobic interactions are shown as dotted lines. Residues involved in nonbonded interactions are displayed as eye lashes. Chain A and chain B residues are shown in blue and orange. Dashed black line indicates the interface. The sulfurs of involved in disulfide bond at the dimer interface are highlighted in yellow.CC BY · PubMed Central
Figure 2—figure supplement 3. Lipids and detergent in the structure. Ordered density observed in our final cryo-electron microscopy (cryo-EM) map that did not account for protein and ligand has been displayed as yellow density (display level 0.22 of the C2 refine map in ChimeraX) in side-view (A), luminal-view (B), and cytosolic-view (C). We believe these are ordered lipids and detergent molecules that interact with hydrophobic patches of the protein. Towards the cytosolic side (C) we find lipid/detergent density between the two protomers, forming a partition between two acetyl-CoA binding sites (ACOSs). Chain A and chain B are shown in purple and orange. Dashed line indicates dimer interface.
Figure 2—figure supplement 3. Lipids and detergent in the structure. Ordered density observed in our final cryo-electron microscopy (cryo-EM) map that did not account for protein and ligand has been displayed as yellow density (display level 0.22 of the C2 refine map in ChimeraX) in side-view (A), luminal-view (B), and cytosolic-view (C). We believe these are ordered lipids and detergent molecules that interact with hydrophobic patches of the protein. Towards the cytosolic side (C) we find lipid/detergent density between the two protomers, forming a partition between two acetyl-CoA binding sites (ACOSs). Chain A and chain B are shown in purple and orange. Dashed line indicates dimer interface.CC BY · PubMed Central
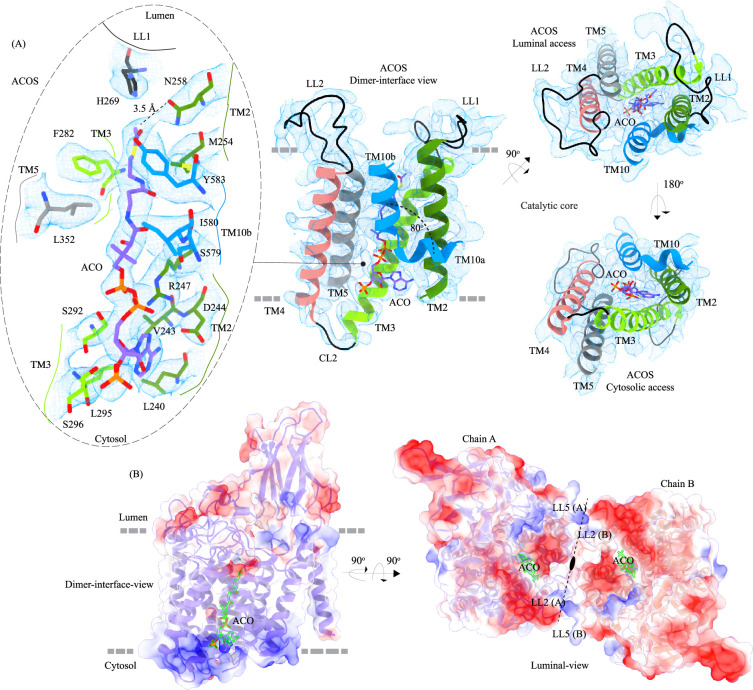
Figure 3. Acetyl-CoA binding site (ACOS). (A) Catalytic core (chain A) of heparan-α-glucosaminide N-acetyltransferase (HGSNAT) comprised of transmembrane helices (TMs) 2–5 and TM 10. Luminal loops (LLs) and cytosolic loops (CLs) are shown in black, and the helices are colored as in Figure 1. Acetyl-CoA (ACO) is colored (purple), the same as chain A in Figure 2 with heteroatoms highlighted. The inset (dashed oval) shows acetyl-CoA binding site (ACOS) and highlights the amino acids of HGSNAT that interact with ACO. The amino acids are colored the same as the corresponding TMs, with heteroatoms highlighted. Cryo-electron microscopy (Cryo-EM) density for ACOS is displayed as blue mesh (display level 0.3 of the 3.26 Å C2 refine map in ChimeraX). ACO could be modeled into the densities at chain A and B ACOSs with a mean correlation coefficient (CC) of 0.77. The nucleoside headgroup of ACO plugs in the cytosolic access of ACOS, and the luminal access seems relatively more accessible. (B) Electrostatic potential and surface charge distribution of HGSNAT, with the surface display colored based on the potential contoured from –10 kT (red) to +10 kT (blue). ACO bound at the ACOS is highlighted in golden yellow. Luminal and cytosolic sides of the protein show a conspicuous polarity. The lysosomal membrane is shown as a dashed gray line in both sub-panels.
Figure 3. Acetyl-CoA binding site (ACOS). (A) Catalytic core (chain A) of heparan-α-glucosaminide N-acetyltransferase (HGSNAT) comprised of transmembrane helices (TMs) 2–5 and TM 10. Luminal loops (LLs) and cytosolic loops (CLs) are shown in black, and the helices are colored as in Figure 1. Acetyl-CoA (ACO) is colored (purple), the same as chain A in Figure 2 with heteroatoms highlighted. The inset (dashed oval) shows acetyl-CoA binding site (ACOS) and highlights the amino acids of HGSNAT that interact with ACO. The amino acids are colored the same as the corresponding TMs, with heteroatoms highlighted. Cryo-electron microscopy (Cryo-EM) density for ACOS is displayed as blue mesh (display level 0.3 of the 3.26 Å C2 refine map in ChimeraX). ACO could be modeled into the densities at chain A and B ACOSs with a mean correlation coefficient (CC) of 0.77. The nucleoside headgroup of ACO plugs in the cytosolic access of ACOS, and the luminal access seems relatively more accessible. (B) Electrostatic potential and surface charge distribution of HGSNAT, with the surface display colored based on the potential contoured from –10 kT (red) to +10 kT (blue). ACO bound at the ACOS is highlighted in golden yellow. Luminal and cytosolic sides of the protein show a conspicuous polarity. The lysosomal membrane is shown as a dashed gray line in both sub-panels.CC BY · PubMed Central
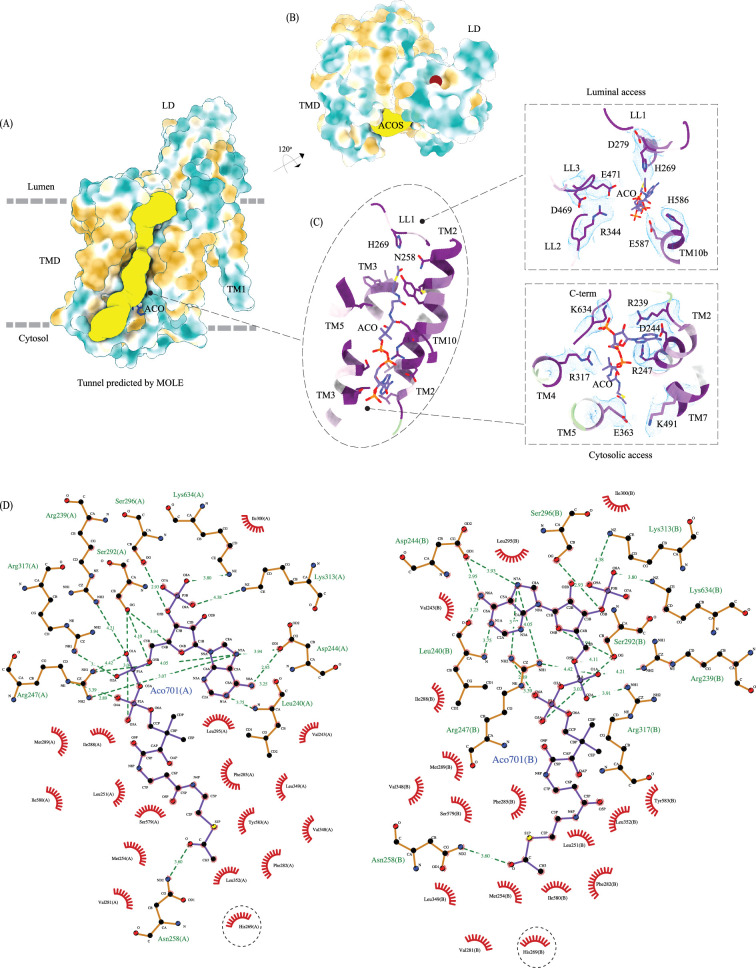
Figure 3—figure supplement 1. Ligand binding sites of heparan-α-glucosaminide N-acetyltransferase (HGSNAT). (A) Surface representation of HGSNAT (chain A), with hydrophobic and hydrophilic amino acids colored in orange and cyan, respectively. Predicted acetyl-CoA access tunnel (yellow) by MOLEonline with a probe radius of ~1.5 Å (Pravda et al., 2018). Acetyl-CoA (ACO) bound at HGSNAT is shown in blue. It is apparent that the nucleoside head group and the acetyl group interact with hydrophilic residues and the pantothenate group is supported by hydrophobic residues. (B) Ligand binding site on luminal domain (LD) (maroon sphere) predicted by DeepSite (Jiménez et al., 2017) (C) acetyl-CoA binding site (ACOS) color coded based on the evolutionary sequence conservation scores obtained from ConSurf server. In the insets are the integral salt-bridges of the luminal (top) and cytosolic (bottom) access of ACOS. The cryo-EM density for the salt-bridges is shown in blue (display level 0.22 of the C2 refine map in ChimeraX). (D) 2D depiction of the network of interactions of ACO modeled at chain A (left) and chain B (right) with HGSNAT residues that lie <4.5 Å away from ACO, generated in LigPlot+. Hydrogen bonds are depicted by dashed lines, and residues that are involved in hydrogen bonds with ACO are shown as ball & stick models. Non-bonded contacts are indicated as eye lashes. The predicted active site H269 is highlighted by dashed circle. In our structure N258 forms weak hydrogen bonds with the acetyl group of ACO. We believe that N258 holds onto ACO until H269 is protonated and ready for catalysis.
Figure 3—figure supplement 1. Ligand binding sites of heparan-α-glucosaminide N-acetyltransferase (HGSNAT). (A) Surface representation of HGSNAT (chain A), with hydrophobic and hydrophilic amino acids colored in orange and cyan, respectively. Predicted acetyl-CoA access tunnel (yellow) by MOLEonline with a probe radius of ~1.5 Å (Pravda et al., 2018). Acetyl-CoA (ACO) bound at HGSNAT is shown in blue. It is apparent that the nucleoside head group and the acetyl group interact with hydrophilic residues and the pantothenate group is supported by hydrophobic residues. (B) Ligand binding site on luminal domain (LD) (maroon sphere) predicted by DeepSite (Jiménez et al., 2017) (C) acetyl-CoA binding site (ACOS) color coded based on the evolutionary sequence conservation scores obtained from ConSurf server. In the insets are the integral salt-bridges of the luminal (top) and cytosolic (bottom) access of ACOS. The cryo-EM density for the salt-bridges is shown in blue (display level 0.22 of the C2 refine map in ChimeraX). (D) 2D depiction of the network of interactions of ACO modeled at chain A (left) and chain B (right) with HGSNAT residues that lie <4.5 Å away from ACO, generated in LigPlot+. Hydrogen bonds are depicted by dashed lines, and residues that are involved in hydrogen bonds with ACO are shown as ball & stick models. Non-bonded contacts are indicated as eye lashes. The predicted active site H269 is highlighted by dashed circle. In our structure N258 forms weak hydrogen bonds with the acetyl group of ACO. We believe that N258 holds onto ACO until H269 is protonated and ready for catalysis.CC BY · PubMed Central
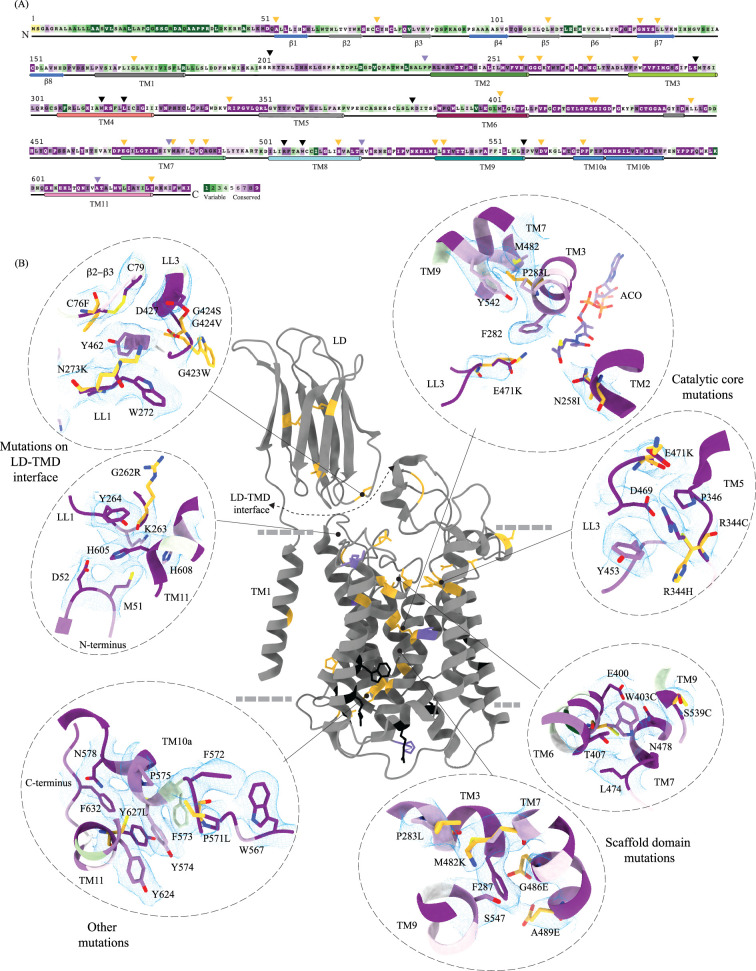
Figure 4. Molecular basis for mucopolysaccharidosis IIIC (MPS) IIIC mutation-induced dysfunction. (A) Evolutionary sequence conservation of heparan-α-glucosaminide N-acetyltransferase (HGSNAT). Amino acids are color-coded according to the conservation scores generated by the ConSurf web server using a Clustal multiple sequence alignment of homologs identified by PSI-BLAST (Ashkenazy et al., 2016). The positions of the mutations - missense (orange), nonsense (black), and polymorphisms (purple) – are indicated on the sequence by triangles. (B) MPS IIIC-causing mutations mapped on the HGSNAT structure. The color coding of the positions is the same as in panel A. Some of the missense mutants are highlighted in the insets (dashed ovals). We grouped them based on their position within the protein – LD-TMD interface, catalytic core, scaffold domain, and other C-terminal mutations. The insets show the 3D environment of the mutant sites on the wild-type HGSNAT color coded as per their evolutionary sequence conservation scores, and the potential disturbance to it caused by the mutation (orange side chains). The coordinates for mutant side chains were generated based on wild-type HGSNAT structure as input in FoldX webserver (Schymkowitz et al., 2005).
Figure 4. Molecular basis for mucopolysaccharidosis IIIC (MPS) IIIC mutation-induced dysfunction. (A) Evolutionary sequence conservation of heparan-α-glucosaminide N-acetyltransferase (HGSNAT). Amino acids are color-coded according to the conservation scores generated by the ConSurf web server using a Clustal multiple sequence alignment of homologs identified by PSI-BLAST (Ashkenazy et al., 2016). The positions of the mutations - missense (orange), nonsense (black), and polymorphisms (purple) – are indicated on the sequence by triangles. (B) MPS IIIC-causing mutations mapped on the HGSNAT structure. The color coding of the positions is the same as in panel A. Some of the missense mutants are highlighted in the insets (dashed ovals). We grouped them based on their position within the protein – LD-TMD interface, catalytic core, scaffold domain, and other C-terminal mutations. The insets show the 3D environment of the mutant sites on the wild-type HGSNAT color coded as per their evolutionary sequence conservation scores, and the potential disturbance to it caused by the mutation (orange side chains). The coordinates for mutant side chains were generated based on wild-type HGSNAT structure as input in FoldX webserver (Schymkowitz et al., 2005).CC BY · PubMed Central
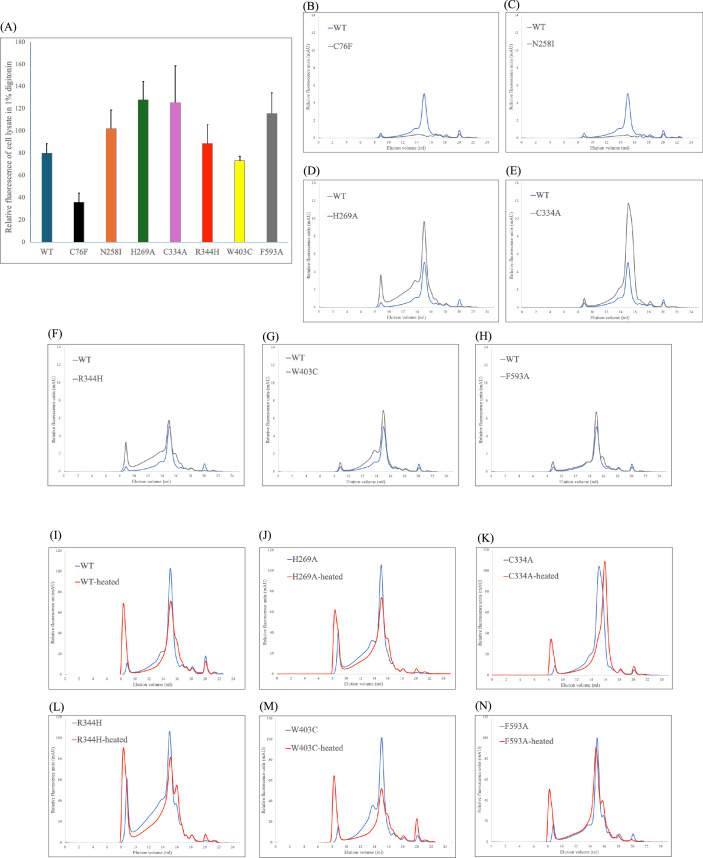
Figure 4—figure supplement 1. Expression and stability of heparan-α-glucosaminide N-acetyltransferase (HGSNAT) mutants. (A) A comparison of relative protein expression indicated by total GFP fluorescence in 100,000 HEK293S GnTI- cells expressing HGSNAT and its mutants. A representative of the experiment (n=2) is shown with error bars denoting standard errors of mean calculated from triplicate measurements. (B–H) A comparison of FSEC chromatograms of the HGSNAT mutants (gray chromatograms) with WT HGSNAT (blue chromatogram). C76F and N258I mutants show no peak at HGSNAT dimer position, and the remaining mutants’ peak position is same as dimeric wild-type (WT) HGSNAT. (I–N) Relative stability of HGSNAT mutants analyzed by fluorescence-detection size-exclusion chromatography (FSEC). To estimate relative stability of mutants, the solubilized mutant cell lysates were heated at 65 °C for 15 min (red chromatograms) and the loss of HGSNAT peak in the resultant chromatograms were compared with non-heated samples (blue chromatograms). C334A, the mutant which breaks the disulfide at the dimer interface, results in a monomeric HGSNAT peak upon heating, while all other mutants retain their dimeric status.
Figure 4—figure supplement 1. Expression and stability of heparan-α-glucosaminide N-acetyltransferase (HGSNAT) mutants. (A) A comparison of relative protein expression indicated by total GFP fluorescence in 100,000 HEK293S GnTI- cells expressing HGSNAT and its mutants. A representative of the experiment (n=2) is shown with error bars denoting standard errors of mean calculated from triplicate measurements. (B–H) A comparison of FSEC chromatograms of the HGSNAT mutants (gray chromatograms) with WT HGSNAT (blue chromatogram). C76F and N258I mutants show no peak at HGSNAT dimer position, and the remaining mutants’ peak position is same as dimeric wild-type (WT) HGSNAT. (I–N) Relative stability of HGSNAT mutants analyzed by fluorescence-detection size-exclusion chromatography (FSEC). To estimate relative stability of mutants, the solubilized mutant cell lysates were heated at 65 °C for 15 min (red chromatograms) and the loss of HGSNAT peak in the resultant chromatograms were compared with non-heated samples (blue chromatograms). C334A, the mutant which breaks the disulfide at the dimer interface, results in a monomeric HGSNAT peak upon heating, while all other mutants retain their dimeric status.CC BY · PubMed Central
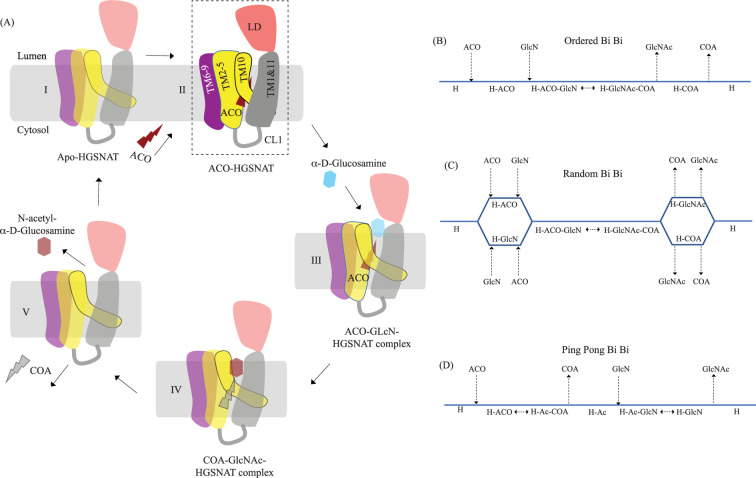
Figure 5. Proposed mechanism of acetyl transfer by heparan-α-glucosaminide N-acetyltransferase (HGSNAT). (A) HGSNAT (I) catalyzes a bisubstrate reaction of transferring acetyl group from cytosolic acetyl-CoA (ACO, red lightning) to terminal non-reducingα-D-Glucosamine (GlcN, blue hexagon) of luminal heparan sulfate (III and IV). After the acetyl group transfer, COA (gray lightning) and acetylated glucosamine (GlcNAc, red hexagon) are believed to be released to cytosol and lumen, respectively (V). Depending on the order of binding and release of substrates and products, enzyme-catalyzed bisubstrate reactions could either be sequential reactions (B and C) or ping pong reactions (D). The mechanism of reaction catalyzed by HGSNAT has been a longstanding debate. We believe that the acetyl-CoA bound HGSNAT structure presented in this work (II, dashed box) is in a cofactor primed conformation which could proceed by any of the bisubstrate reaction mechanisms shown in B–D. The function of luminal domain (LD) is unclear, and we believe it plays essential role in recognition of substrate and its positioning at the active site.
Figure 5. Proposed mechanism of acetyl transfer by heparan-α-glucosaminide N-acetyltransferase (HGSNAT). (A) HGSNAT (I) catalyzes a bisubstrate reaction of transferring acetyl group from cytosolic acetyl-CoA (ACO, red lightning) to terminal non-reducingα-D-Glucosamine (GlcN, blue hexagon) of luminal heparan sulfate (III and IV). After the acetyl group transfer, COA (gray lightning) and acetylated glucosamine (GlcNAc, red hexagon) are believed to be released to cytosol and lumen, respectively (V). Depending on the order of binding and release of substrates and products, enzyme-catalyzed bisubstrate reactions could either be sequential reactions (B and C) or ping pong reactions (D). The mechanism of reaction catalyzed by HGSNAT has been a longstanding debate. We believe that the acetyl-CoA bound HGSNAT structure presented in this work (II, dashed box) is in a cofactor primed conformation which could proceed by any of the bisubstrate reaction mechanisms shown in B–D. The function of luminal domain (LD) is unclear, and we believe it plays essential role in recognition of substrate and its positioning at the active site.CC BY · PubMed Central
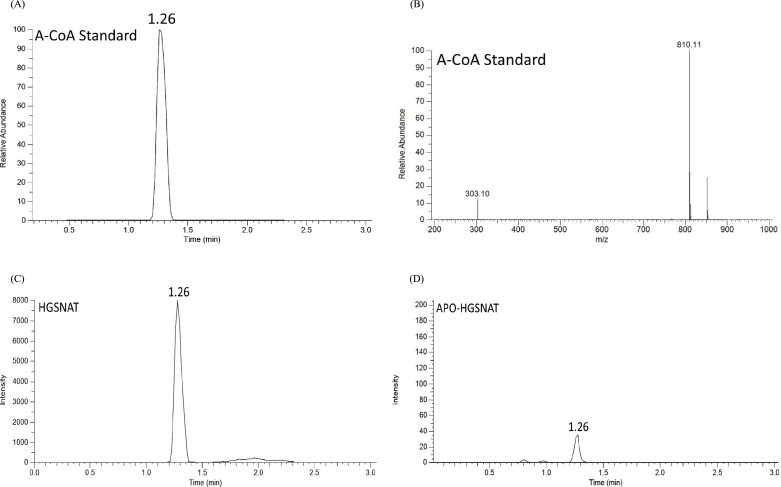
Figure 5—figure supplement 1. LC-MS analysis of purified heparan-α-glucosaminide N-acetyltransferase (HGSNAT). (A) LC profile and (B) MS/MS spectrum of acetyl-CoA (ACO) standard, showing the retention time (1.26 min), and precursor (810.1 m/z) and product (303.1 m/z) peaks in single reaction monitoring mode, respectively. (C) and (D) show relative LC peak intensities of endogenously bound ACO identified in purified HGSNAT before and after dialysis of the membranes, respectively.
Figure 5—figure supplement 1. LC-MS analysis of purified heparan-α-glucosaminide N-acetyltransferase (HGSNAT). (A) LC profile and (B) MS/MS spectrum of acetyl-CoA (ACO) standard, showing the retention time (1.26 min), and precursor (810.1 m/z) and product (303.1 m/z) peaks in single reaction monitoring mode, respectively. (C) and (D) show relative LC peak intensities of endogenously bound ACO identified in purified HGSNAT before and after dialysis of the membranes, respectively.CC BY · PubMed Central
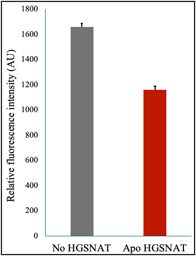
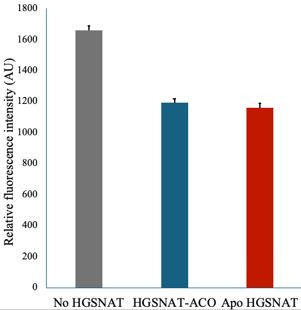
Author response image 1. Acetyl-CoA levels in absence and presence of HGSNAT purified in digitonin. Decrease in the levels of 10 M acetyl-CoA was measured in presence of 10 M D-glucosamine and 30 nM HGSNAT at pH 7.5.
Author response image 1. Acetyl-CoA levels in absence and presence of HGSNAT purified in digitonin. Decrease in the levels of 10 M acetyl-CoA was measured in presence of 10 M D-glucosamine and 30 nM HGSNAT at pH 7.5.CC BY · PubMed Central
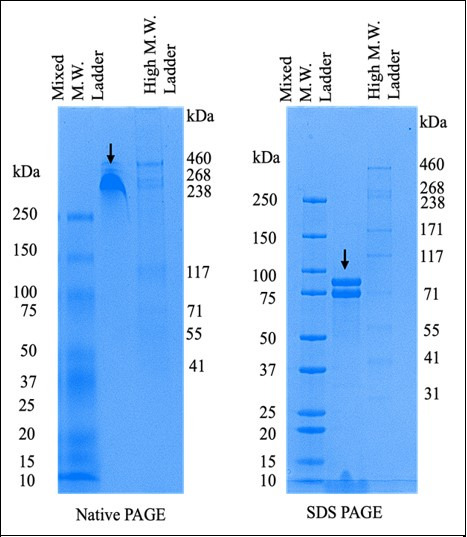
Author response image 2. Comparison of purified HGSNAT on native and reducing SDS-PAGE. The arrows on both the gels indicate N-GFP-HGSNAT. The two bands on the SDS PAGE are, perhaps, two differentially glycosylated forms of HGSNAT.
Author response image 2. Comparison of purified HGSNAT on native and reducing SDS-PAGE. The arrows on both the gels indicate N-GFP-HGSNAT. The two bands on the SDS PAGE are, perhaps, two differentially glycosylated forms of HGSNAT.CC BY · PubMed Central
Author response image 3. Acetyl-CoA levels in absence and presence of HGSNAT purified in digitonin. Decrease in the levels of 10 mM acetyl-CoA was measured in presence of 10 mM D-glucosamine and 30 nM HGSNAT at pH 7.5.
Author response image 3. Acetyl-CoA levels in absence and presence of HGSNAT purified in digitonin. Decrease in the levels of 10 mM acetyl-CoA was measured in presence of 10 mM D-glucosamine and 30 nM HGSNAT at pH 7.5.CC BY · PubMed Central

Verification

Claims the paper makes

The claims and statistics of this paper haven’t been checked yet.

Run the check — free, no account needed. It reads the open-access text and checks the sources it cites.

A few free checks a day · papers already verified open instantly · results are public

Self-check

Percentages, sums and reported differences re-computed from the paper’s own numbers.

The self-check needs the paper’s full text.

Citations

Cites

Show all 2 references

Research works printed but not linked: 67

  1. Ashkenazy, 2016, ConSurf 2016: an improved methodology to estimate and visualize evolutionary conservation in macromolecules, Nucleic Acids Research, 44, W344, 10.1093/nar/gkw408 · DOI · Paper page
  2. Ausseil, 2006, An acetylated 120-kDa lysosomal transmembrane protein is absent from mucopolysaccharidosis IIIC fibroblasts: A candidate molecule for MPS IIIC, Molecular Genetics and Metabolism, 87, 22, 10.1016/j.ymgme.2005.09.021 · DOI
  3. Bame, 1985, Acetyl coenzyme A: alpha-glucosaminide N-acetyltransferase. Evidence for A transmembrane acetylation mechanism, The Journal of Biological Chemistry, 260, 11293, 10.1016/S0021-9258(17)39179-2 · DOI
  4. Bame, 1986, Acetyl-coenzyme A:alpha-glucosaminide N-acetyltransferase. Evidence for an active site histidine residue, The Journal of Biological Chemistry, 261, 10127, 10.1016/S0021-9258(18)67500-3 · DOI
  5. Bame, 1986, Genetic evidence for transmembrane acetylation by lysosomes, Science, 233, 1087, 10.1126/science.3090688 · DOI
  6. Batzios, 2012, Differential expression of matrix metalloproteinases in the serum of patients with mucopolysaccharidoses, JIMD Reports, 3, 59, 10.1007/8904_2011_58 · DOI
  7. Beale, 2015, Crystal structures of the extracellular domain from PepT1 and PepT2 provide novel insights into mammalian peptide transport, Structure, 23, 1889, 10.1016/j.str.2015.07.016 · DOI
  8. Bonifacino, 2003, Signals for sorting of transmembrane proteins to endosomes and lysosomes, Annual Review of Biochemistry, 72, 395, 10.1146/annurev.biochem.72.121801.161800 · DOI · Paper page
  9. Bork, 1994, The immunoglobulin fold. Structural classification, sequence patterns and common core, Journal of Molecular Biology, 242, 309, 10.1006/jmbi.1994.1582 · DOI
  10. Canals, 2011, Molecular analysis of Sanfilippo syndrome type C in Spain: seven novel HGSNAT mutations and characterization of the mutant alleles, Clinical Genetics, 80, 367, 10.1111/j.1399-0004.2010.01525.x · DOI
  11. Chidyausiku, 2022, De novo design of immunoglobulin-like domains, Nature Communications, 13, 10.1038/s41467-022-33004-6 · DOI
  12. Coutinho, 2012, Glycosaminoglycan storage disorders: a review, Biochemistry Research International, 2012, 10.1155/2012/471325 · DOI
  13. Durand, 2010, Analysis of the biogenesis of heparan sulfate acetyl-CoA:alpha-glucosaminide N-acetyltransferase provides insights into the mechanism underlying its complete deficiency in mucopolysaccharidosis IIIC, The Journal of Biological Chemistry, 285, 31233, 10.1074/jbc.M110.141150 · DOI
  14. Emsley, 2010, Features and development of Coot, Acta Crystallographica. Section D, Biological Crystallography, 66, 486, 10.1107/S0907444910007493 · DOI · Paper page
  15. Fan, 2006, Identification of the gene encoding the enzyme deficient in mucopolysaccharidosis IIIC (Sanfilippo disease type C), American Journal of Human Genetics, 79, 738, 10.1086/508068 · DOI
  16. Fan, 2011, Characterization of the biosynthesis, processing and kinetic mechanism of action of the enzyme deficient in mucopolysaccharidosis IIIC, PLOS ONE, 6, 10.1371/journal.pone.0024951 · DOI
  17. Fedele, 2010, Functional analysis of the HGSNAT gene in patients with mucopolysaccharidosis IIIC (Sanfilippo C Syndrome), Human Mutation, 31, E1574, 10.1002/humu.21286 · DOI
  18. Feldhammer, 2009, Sanfilippo syndrome type C: mutation spectrum in the heparan sulfate acetyl-CoA: alpha-glucosaminide N-acetyltransferase (HGSNAT) gene, Human Mutation, 30, 918, 10.1002/humu.20986 · DOI
  19. Feldhammer, 2009, Protein misfolding as an underlying molecular defect in mucopolysaccharidosis III type C, PLOS ONE, 4, 10.1371/journal.pone.0007434 · DOI
  20. Felisberto-Rodrigues, 2011, Towards a structural comprehension of bacterial type VI secretion systems: characterization of the TssJ-TssM complex of an Escherichia coli pathovar, PLOS Pathogens, 7, 10.1371/journal.ppat.1002386 · DOI
  21. Goehring, 2014, Screening and large-scale expression of membrane proteins in mammalian cells for structural studies, Nature Protocols, 9, 2574, 10.1038/nprot.2014.173 · DOI
  22. Hirano, 2019, Structural basis of phosphatidylcholine recognition by the C2-domain of cytosolic phospholipase A2α, eLife, 8, 10.7554/eLife.44760 · DOI
  23. Holm, 2023, DALI shines a light on remote homologs: One hundred discoveries, Protein Science, 32, 10.1002/pro.4519 · DOI
  24. Hörnberg, 2000, A comparative analysis of 23 structures of the amyloidogenic protein transthyretin, Journal of Molecular Biology, 302, 649, 10.1006/jmbi.2000.4078 · DOI
  25. Hrebícek, 2006, Mutations in TMEM76* cause mucopolysaccharidosis IIIC (Sanfilippo C syndrome), American Journal of Human Genetics, 79, 807, 10.1086/508294 · DOI
  26. Huizing, 2020, Inherited disorders of lysosomal membrane transporters, Biochimica et Biophysica Acta. Biomembranes, 1862, 10.1016/j.bbamem.2020.183336 · DOI
  27. Javadpour, 1999, Helix packing in polytopic membrane proteins: role of glycine in transmembrane helix association, Biophysical Journal, 77, 1609, 10.1016/S0006-3495(99)77009-8 · DOI
  28. Jiménez, 2017, DeepSite: protein-binding site predictor using 3D-convolutional neural networks, Bioinformatics, 33, 3036, 10.1093/bioinformatics/btx350 · DOI
  29. Jobin, 2017, New intracellular activities of matrix metalloproteinases shine in the moonlight, Biochimica et Biophysica Acta. Molecular Cell Research, 1864, 2043, 10.1016/j.bbamcr.2017.05.013 · DOI
  30. Kawate, 2006, Fluorescence-detection size-exclusion chromatography for precrystallization screening of integral membrane proteins, Structure, 14, 673, 10.1016/j.str.2006.01.013 · DOI
  31. Klein, 1978, Sanfilippo syndrome type C: deficiency of acetyl-CoA:alpha-glucosaminide N-acetyltransferase in skin fibroblasts, PNAS, 75, 5185, 10.1073/pnas.75.10.5185 · DOI
  32. Koch, 1992, Analysis of protein sheet topologies by graph theoretical methods, Proteins, 12, 314, 10.1002/prot.340120403 · DOI
  33. Kretsinger, 2013, Encyclopedia of Metalloproteins, 10.1007/978-1-4614-1533-6 · DOI
  34. Kucukelbir, 2014, Quantifying the local resolution of cryo-EM density maps, Nature Methods, 11, 63, 10.1038/nmeth.2727 · DOI
  35. Li, 2020, Procleave: Predicting protease-specific substrate cleavage sites by combining sequence and structural information, Genomics, Proteomics & Bioinformatics, 18, 52, 10.1016/j.gpb.2019.08.002 · DOI
  36. Liebschner, 2019, Macromolecular structure determination using X-rays, neutrons and electrons: recent developments in Phenix, Acta Crystallographica. Section D, Structural Biology, 75, 861, 10.1107/S2059798319011471 · DOI · Paper page
  37. McBride, 2021, Update in the Mucopolysaccharidoses, Seminars in Pediatric Neurology, 37, 10.1016/j.spen.2021.100874 · DOI
  38. Meikle, 1995, Human acetyl-coenzyme A:alpha-glucosaminide N-acetyltransferase. Kinetic characterization and mechanistic interpretation, The Biochemical Journal, 308 ( Pt 1), 327, 10.1042/bj3080327 · DOI
  39. Meng, 2023, UCSF ChimeraX: Tools for structure building and analysis, Protein Science, 32, 10.1002/pro.4792 · DOI
  40. Mirdita, 2022, ColabFold: making protein folding accessible to all, Nature Methods, 19, 679, 10.1038/s41592-022-01488-1 · DOI · Paper page
  41. Müller, 2012, Specific functions of lysosomal proteases in endocytic and autophagic pathways, Biochimica et Biophysica Acta, 1824, 34, 10.1016/j.bbapap.2011.07.003 · DOI
  42. Nagel, 2019, HGSNAT enzyme deficiency results in accumulation of heparan sulfate in podocytes and basement membranes, Histology and Histopathology, 34, 1377, 10.14670/HH-18-131 · DOI
  43. Newman, 2023, A novel fold for acyltransferase-3 (AT3) proteins provides A framework for transmembrane acyl-group transfer, eLife, 12, 10.7554/eLife.81547 · DOI · Paper page
  44. Orwick-Rydmark, 2016, The use of detergents to purify membrane proteins, Current Protocols in Protein Science, 84, 10.1002/0471140864.ps0408s84 · DOI
  45. Pan, 2022, Glucosamine amends CNS pathology in mucopolysaccharidosis IIIC mouse expressing misfolded HGSNAT, The Journal of Experimental Medicine, 219, 10.1084/jem.20211860 · DOI
  46. Parker, 2021, Cryo-EM structure of PepT2 reveals structural basis for proton-coupled peptide and prodrug transport in mammals, Science Advances, 7, 10.1126/sciadv.abh3355 · DOI
  47. Platt, 2018, Lysosomal storage diseases, Nature Reviews. Disease Primers, 4, 10.1038/s41572-018-0025-4 · DOI · Paper page
  48. Pravda, 2018, MOLEonline: a web-based tool for analyzing channels, tunnels and pores (2018 update), Nucleic Acids Research, 46, W368, 10.1093/nar/gky309 · DOI
  49. Pshezhetsky, 2018, Sanfilippo type C disease: pathogenic mechanism and potential therapeutic applications, Expert Opinion on Orphan Drugs, 6, 635, 10.1080/21678707.2018.1534585 · DOI
  50. Punjani, 2017, cryoSPARC: algorithms for rapid unsupervised cryo-EM structure determination, Nature Methods, 14, 290, 10.1038/nmeth.4169 · DOI · Paper page
  51. Punjani, 2020, Non-uniform refinement: adaptive regularization improves single-particle cryo-EM reconstruction, Nature Methods, 17, 1214, 10.1038/s41592-020-00990-8 · DOI
  52. Rajasekar, 2019, Structure of SPH (self-incompatibility protein homologue) proteins: a widespread family of small, highly stable, secreted proteins, The Biochemical Journal, 476, 809, 10.1042/BCJ20180828 · DOI
  53. Rome, 1981, Degradation of mucopolysaccharide in intact isolated lysosomes, The Journal of Biological Chemistry, 256, 10763, 10.1016/S0021-9258(19)68506-6 · DOI
  54. Rome, 1983, Utilization of exogenously added acetyl coenzyme A by intact isolated lysosomes, The Journal of Biological Chemistry, 258, 3006, 10.1016/S0021-9258(18)32821-7 · DOI
  55. Rudnik, 2021, The lysosomal membrane-export of metabolites and beyond, The FEBS Journal, 288, 4168, 10.1111/febs.15602 · DOI
  56. Ruivo, 2009, Molecular and cellular basis of lysosomal transmembrane protein dysfunction, Biochimica et Biophysica Acta, 1793, 636, 10.1016/j.bbamcr.2008.12.008 · DOI
  57. Saier, 2021, The transporter classification database (TCDB): 2021 update, Nucleic Acids Research, 49, D461, 10.1093/nar/gkaa1004 · DOI · Paper page
  58. Schröder, 2016, Intramembrane proteolysis within lysosomes, Ageing Research Reviews, 32, 51, 10.1016/j.arr.2016.04.012 · DOI
  59. Schwake, 2013, Lysosomal membrane proteins and their central role in physiology, Traffic, 14, 739, 10.1111/tra.12056 · DOI
  60. Schymkowitz, 2005, The FoldX web server: an online force field, Nucleic Acids Research, 33, W382, 10.1093/nar/gki387 · DOI · Paper page
  61. Song, 2012, PROSPER: An integrated feature-based tool for predicting protease substrate cleavage sites, PLOS ONE, 7, 10.1371/journal.pone.0050300 · DOI
  62. Steenhuis, 2012, Proteolytic cleavage of the disease-related lysosomal membrane glycoprotein CLN7, Biochimica et Biophysica Acta, 1822, 1617, 10.1016/j.bbadis.2012.05.015 · DOI
  63. Turk, 2000, Lysosomal cysteine proteases: more than scavengers, Biochimica et Biophysica Acta, 1477, 98, 10.1016/s0167-4838(99)00263-0 · DOI
  64. Ulmschneider, 2001, Amino acid distributions in integral membrane protein structures, Biochimica et Biophysica Acta, 1512, 1, 10.1016/s0005-2736(01)00299-1 · DOI
  65. Varadi, 2022, AlphaFold Protein Structure Database: massively expanding the structural coverage of protein-sequence space with high-accuracy models, Nucleic Acids Research, 50, D439, 10.1093/nar/gkab1061 · DOI · Paper page
  66. Xu, 2024, Structure and mechanism of lysosome transmembrane acetylation by HGSNAT, Nature Structural & Molecular Biology, 15, 10.1038/s41594-024-01315-5 · DOI
  67. Navratna V, Kumar A, Mosalaganti S. 2023. Cryo-EM structure of HGSNAT-acetyl-CoA complex at pH 7.5. RCSB Protein Data Bank. https://www.rcsb.org/structure/8TU9. PDB-8TU9.

Metadata

Authors
Navratna, V., Kumar, A., Rana, J. K., & Mosalaganti, S.
Affiliations
  • University of Michigan (US)
  • Thermo Fisher Scientific (United States) (US)
Corresponding author
Mosalaganti, Shyamal
Venue
eLife
Published
2024-08-28
Volume
13
ISSN
2050-084X (ISSN-L)
OpenAlex
W4390694021
Cited by
10
References
2
Citations by year
2026: 3 · 2025: 3 · 2024: 4
FWCI
2.58
Type
journal article
Language
en
Open access
Locations
  • eLife (publishedVersion, cc-by)
  • bioRxiv (Cold Spring Harbor Laboratory) (acceptedVersion, cc-by)
  • PubMed Central (publishedVersion, cc-by)
  • PubMed (publishedVersion)
  • PubMed Central (submittedVersion, cc-by)
  • DOAJ (DOAJ: Directory of Open Access Journals) (submittedVersion, cc-by-sa)
Funders
  • University of Michigan (Startup funding)
  • National Institutes of Health (1DP2GM150019-01)
Topics
  • Health Sciences › Medicine › Genetics (clinical) › Lysosomal Storage Disorders Research
  • Life Sciences › Biochemistry, Genetics and Molecular Biology › Biochemistry › Glycogen Storage Diseases and Myoclonus
  • Life Sciences › Biochemistry, Genetics and Molecular Biology › Cell Biology › Proteoglycans and glycosaminoglycans research
Keywords
HGSNAT, heparan sulfate degradation, lysosomal storage disease, acetyl-CoA, enzyme structure, glycosaminoglycan catabolism

About these checks

Registry, retraction, Cites and statistics results are computed, not judged, with one exception: a printed reference that no index lists is read once by a model before it counts as a citation error. Claims are extracted by a model and kept only when their quote appears verbatim in the text; each cited source is then checked, with a model’s help, for whether it says what the claim relies on. Those verdicts can be wrong — read the claim’s quote and the cited source before relying on one.

Statistics and arithmetic are recomputed, not judged.

Confidence bands are shown only for fields calibrated on our annotated test set. None is calibrated yet, so no band is shown.

What counts as a claim ›How we measure confidence ›How we check this ›

Are you an author, or do you see a problem with this page? Request a review

How to cite

Cite CoChat for the checks on this page, and the paper for its own findings.

This page
CoChat. (2026). Citation check: Structure of the human heparan-α-glucosaminide N-acetyltransferase (HGSNAT). https://app.cochat.ai/papers/10.7554/elife.93510
The paper
Navratna, V., Kumar, A., Rana, J. K., & Mosalaganti, S. (2024). Structure of the human heparan-α-glucosaminide N-acetyltransferase (HGSNAT). eLife. https://doi.org/10.7554/elife.93510