Cited by 4Cellular transport and secretionAnimal Virus Infections StudiesVirology and Viral Diseases

The DOI matches its Crossref record; 2 of the 2 references it cites were found in a registry or an index.

On the role of VP3-PI3P interaction in birnavirus endosomal membrane targeting

Open access
Zanetti, Flavia A, Fernandez, Ignacio, Baquero, Eduard, Guardado-Calvo, Pablo, Ferrino-Iriarte, Andres, Dubois, Sarah, Morel, Etienne, Alfonso, Victoria, Aguilera, Milton Osmar, Celayes, María E, Polo, Luis Mariano, Suhaiman, Laila, Galassi, Vanesa V, Chiarpotti, Maria V, Allende-Ballestero, Carolina, Rodriguez, Javier M, Castón, Jose R, Lijavetzky, Diego, Taboga, Oscar, Colombo, María I, Del Pópolo, Mario, Rey, Félix A, Delgui, Laura Ruth·2025·eLife

Published version of a preprint

Abstract

Birnaviruses are a group of double-stranded RNA (dsRNA) viruses infecting birds, fish, and insects. Early endosomes (EE) constitute the platform for viral replication. Here, we study the mechanism of birnaviral targeting of EE membranes. Using the Infectious Bursal Disease Virus (IBDV) as a model, we validate that the viral protein 3 (VP3) binds to phosphatidylinositol-3-phosphate (PI3P) present in EE membranes. We identify the domain of VP3 involved in PI3P-binding, named P2 and localized in the core of VP3, and establish the critical role of the arginine at position 200 (R 200 ), conserved among all known birnaviruses. Mutating R 200 abolishes viral replication. Moreover, we propose a two-stage modular mechanism for VP3 association with EE. Firstly, the carboxy-terminal region of VP3 adsorbs on the membrane, and then the VP3 core reinforces the membrane engagement by specifically binding PI3P through its P2 domain, additionally promoting PI3P accumulation.

Overview

The claims and statistics of this paper haven’t been checked yet.

Run the check — free, no account needed. It reads the open-access text and checks the sources it cites.

A few free checks a day · papers already verified open instantly · results are public

Integrity signals

Registry

Crossref · 10.7554/elife.97261

Cites

2 of 2 references verified0 citation errors · 0 not checkable

Statistics

Figures
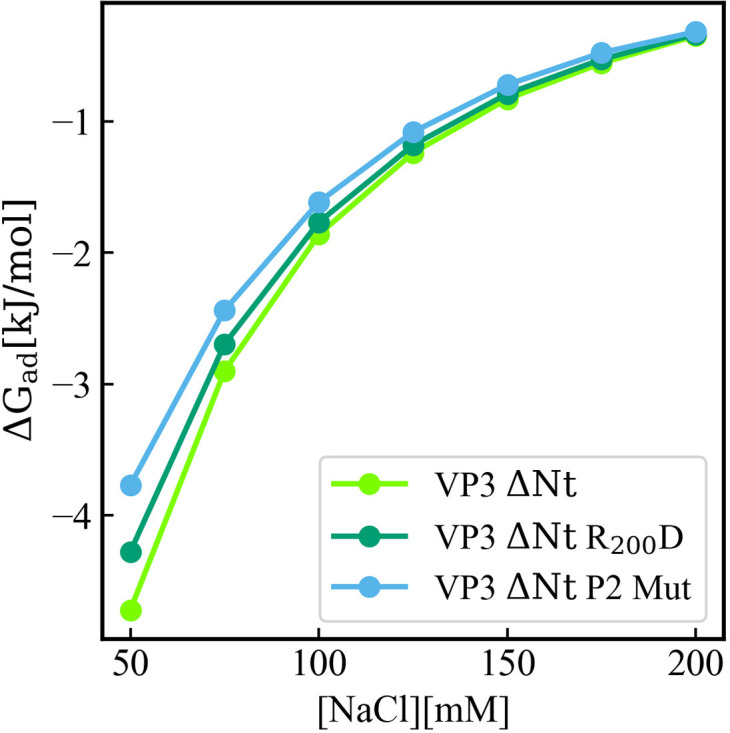
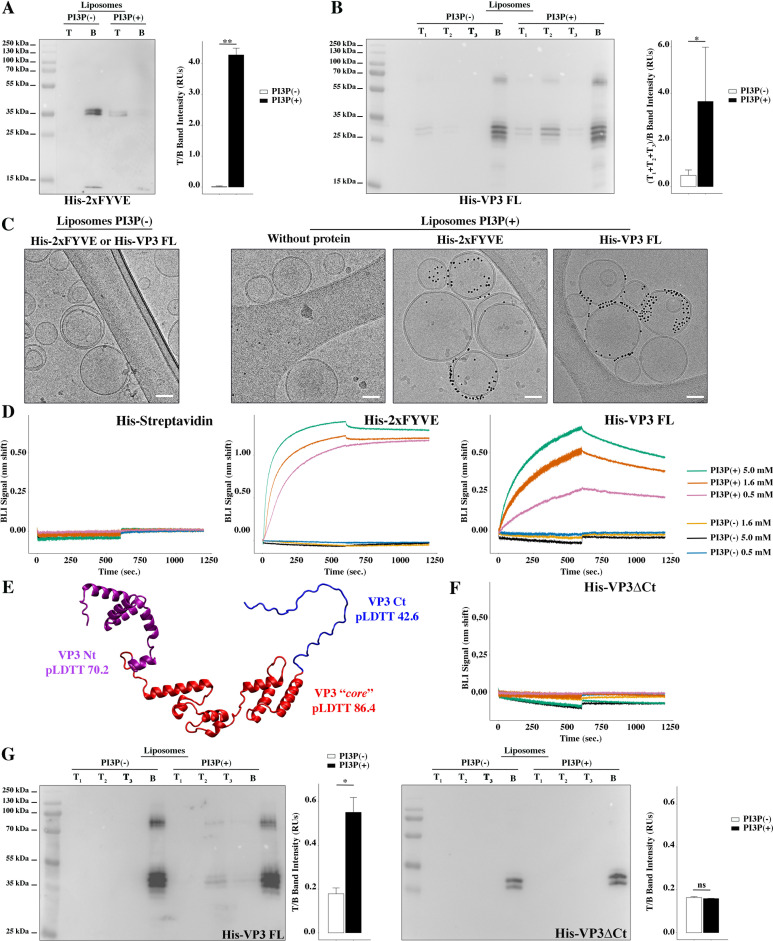
Figure 1. Biophysical characterization of viral protein 3 (VP3) binding to phosphatidylinositol-3-phosphate (PI3P). (A) Immunoblots of the top (T) and bottom (B) fractions from a liposome PI3P(-) or PI3P(+) OptiprepTM co-floatation assay indicating that His-2xFYVE protein (~35 kDa) specifically binds to liposome PI3P(+). Results are representative of three independent experiments. The bar plot represents the intensity of T/B bands for each liposome preparation. Significant differences (**p<0.01) as determined by one-way ANOVA with Tukey’s HSD test.(B) Immunoblots of the three top (T1, T2, and T3) and bottom (B) fractions from a liposome PI3P(-) or PI3P(+) OptiprepTM co-floatation assay indicating that His-VP3 FL protein (~32 kDa) specifically binds to liposome PI3P(+). Results are representative of three independent experiments. The bar plot represents the intensity of (T1+T2+T3)/B bands for each liposome preparation. Significant differences (*p<0.05) as determined by one-way ANOVA with Tukey’s HSD test. (C) Liposomes were vitrified and only representative cryo-electron microscopy images are shown. Left panel: liposomes PI3P(-) incubated even with the Ni-NTA gold particles reagent alone or pre-incubated with His-2xFYVE of His-VP3 FL. Right panel: liposomes PI3P(+) control (without protein), or incubated with His-2xFYVE- or His-VP3 FL-Ni-NTA gold particles showing gold particles decorating the membrane of the liposomes when His-2xFYVE or His-VP3 FL were present. The bar represents 50 nm. (D) Binding of His-Streptavidin (negative control), His-2xFYVE (positive control), or His-VP3 FL to three different concentrations of liposomes PI3P(-) or PI3P(+). Association and dissociation sensorgrams measured by bio-layer interferometry (BLI), showing the specific interaction of His-2xFYVE and His-VP3 FL with liposomes PI3P(+) in a dose-dependent manner, as indicated. (E) Cartoon representation of AlphaFold2 prediction of VP3 FL. Red region corresponds to the ‘core’ region of the protein present in the experimental X-ray crystallographic model obtained by Casañas and coworkers PDB: 2R18 (Casañas et al., 2008). Regions not present within the PDB are colored in violet and blue representing the Nt and the Ct of VP3, respectively. pLDTT values lower than 50 are a strong predictor of disorder. (F) Binding of His-VP3 ΔCt to three different concentrations of liposomes PI3P(-) or PI3P(+). Sensorgrams measured by BLI, showing the absence of binding to either liposomes when the VP3 lacks the Ct region blue in (E). (G) Immunoblots of the three top (T1, T2, and T3) and bottom (B) fractions from a liposome PI3P(-) or PI3P(+) OptiprepTM co-floatation assay of His-VP3 FL protein (~32 kDa) (positive control, left panel) or His-VP3 ΔCt protein (~28 kDa) (right panel) showing the lack of VP3 ΔCt binding to both liposomes. Results are representative of three independent experiments. The bar plot represents the intensity of (T1+T2+T3)/B bands for each liposome preparation. Significant differences (*p<0.05; ns p>0.05) as determined by one-way ANOVA with Tukey’s HSD test.
Figure 1. Biophysical characterization of viral protein 3 (VP3) binding to phosphatidylinositol-3-phosphate (PI3P). (A) Immunoblots of the top (T) and bottom (B) fractions from a liposome PI3P(-) or PI3P(+) OptiprepTM co-floatation assay indicating that His-2xFYVE protein (~35 kDa) specifically binds to liposome PI3P(+). Results are representative of three independent experiments. The bar plot represents the intensity of T/B bands for each liposome preparation. Significant differences (**p<0.01) as determined by one-way ANOVA with Tukey’s HSD test.(B) Immunoblots of the three top (T1, T2, and T3) and bottom (B) fractions from a liposome PI3P(-) or PI3P(+) OptiprepTM co-floatation assay indicating that His-VP3 FL protein (~32 kDa) specifically binds to liposome PI3P(+). Results are representative of three independent experiments. The bar plot represents the intensity of (T1+T2+T3)/B bands for each liposome preparation. Significant differences (*p<0.05) as determined by one-way ANOVA with Tukey’s HSD test. (C) Liposomes were vitrified and only representative cryo-electron microscopy images are shown. Left panel: liposomes PI3P(-) incubated even with the Ni-NTA gold particles reagent alone or pre-incubated with His-2xFYVE of His-VP3 FL. Right panel: liposomes PI3P(+) control (without protein), or incubated with His-2xFYVE- or His-VP3 FL-Ni-NTA gold particles showing gold particles decorating the membrane of the liposomes when His-2xFYVE or His-VP3 FL were present. The bar represents 50 nm. (D) Binding of His-Streptavidin (negative control), His-2xFYVE (positive control), or His-VP3 FL to three different concentrations of liposomes PI3P(-) or PI3P(+). Association and dissociation sensorgrams measured by bio-layer interferometry (BLI), showing the specific interaction of His-2xFYVE and His-VP3 FL with liposomes PI3P(+) in a dose-dependent manner, as indicated. (E) Cartoon representation of AlphaFold2 prediction of VP3 FL. Red region corresponds to the ‘core’ region of the protein present in the experimental X-ray crystallographic model obtained by Casañas and coworkers PDB: 2R18 (Casañas et al., 2008). Regions not present within the PDB are colored in violet and blue representing the Nt and the Ct of VP3, respectively. pLDTT values lower than 50 are a strong predictor of disorder. (F) Binding of His-VP3 ΔCt to three different concentrations of liposomes PI3P(-) or PI3P(+). Sensorgrams measured by BLI, showing the absence of binding to either liposomes when the VP3 lacks the Ct region blue in (E). (G) Immunoblots of the three top (T1, T2, and T3) and bottom (B) fractions from a liposome PI3P(-) or PI3P(+) OptiprepTM co-floatation assay of His-VP3 FL protein (~32 kDa) (positive control, left panel) or His-VP3 ΔCt protein (~28 kDa) (right panel) showing the lack of VP3 ΔCt binding to both liposomes. Results are representative of three independent experiments. The bar plot represents the intensity of (T1+T2+T3)/B bands for each liposome preparation. Significant differences (*p<0.05; ns p>0.05) as determined by one-way ANOVA with Tukey’s HSD test.CC BY · PubMed Central
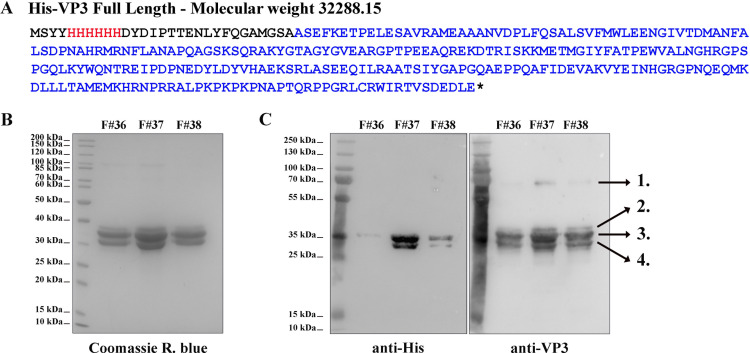
Figure 1—figure supplement 1. His-viral protein 3 (VP3) Full length (FL) purification and characterization. (A) The aminoacidic sequence of His-VP3 FL and its theoretical molecular weight. The His-tag is colored in red and the VP3 sequence in blue. Additional residues are black. (B) Coomassie R. blue-stained polyacrylamide gel showing fractions (F) #36, #37, and #38 from the size exclusion chromatography. (C) Western blot images (left: anti-His; right: anti-VP3) from gels identical to that shown in (B). Numbers 1–4 indicate the identified proteins by mass spectrometry. 1. His-VP3 FL dimer (~70 kDa); 2. Sulfonylated His-VP3 FL (due to the use of phenylmethylsulfonyl fluoride as proteases inhibitor); 3. His-VP3 FL; 4. His-VP3 lacking the last 14 carboxy-terminal (Ct) residues.
Figure 1—figure supplement 1. His-viral protein 3 (VP3) Full length (FL) purification and characterization. (A) The aminoacidic sequence of His-VP3 FL and its theoretical molecular weight. The His-tag is colored in red and the VP3 sequence in blue. Additional residues are black. (B) Coomassie R. blue-stained polyacrylamide gel showing fractions (F) #36, #37, and #38 from the size exclusion chromatography. (C) Western blot images (left: anti-His; right: anti-VP3) from gels identical to that shown in (B). Numbers 1–4 indicate the identified proteins by mass spectrometry. 1. His-VP3 FL dimer (~70 kDa); 2. Sulfonylated His-VP3 FL (due to the use of phenylmethylsulfonyl fluoride as proteases inhibitor); 3. His-VP3 FL; 4. His-VP3 lacking the last 14 carboxy-terminal (Ct) residues.CC BY · PubMed Central
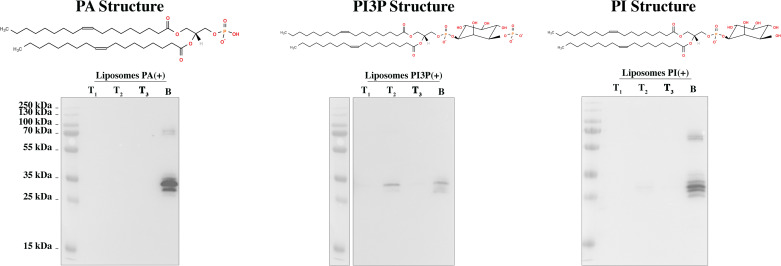
Figure 1—figure supplement 2. His-viral protein 3 (VP3) full length (FL) phosphatidylinositol-3-phosphate (PI3P)-binding specificity. Immunoblots of the three top (T1, T2, and T3) and bottom (B) fractions from co-flotation assays using liposomes where PI3P was replaced by 1,2-dioleoyl-sn-glycero-3-phosphate (PA) or [1,2-dioleoyl-sn-glycero-3-phospho-(1'-myo-inositol)] (PI) in an identical molar ratio, named ‘liposomes PA(+) or PI(+)’. We observed that while His-VP3 FL bound to liposomes PI3P(+) (middle panel), it did not bind to liposomes PA (left panel) or PI (right panel), reinforcing the notion that the interaction of VP3 with PI3P is specific. On top of each panel, the corresponding lipid structure is shown.
Figure 1—figure supplement 2. His-viral protein 3 (VP3) full length (FL) phosphatidylinositol-3-phosphate (PI3P)-binding specificity. Immunoblots of the three top (T1, T2, and T3) and bottom (B) fractions from co-flotation assays using liposomes where PI3P was replaced by 1,2-dioleoyl-sn-glycero-3-phosphate (PA) or [1,2-dioleoyl-sn-glycero-3-phospho-(1'-myo-inositol)] (PI) in an identical molar ratio, named ‘liposomes PA(+) or PI(+)’. We observed that while His-VP3 FL bound to liposomes PI3P(+) (middle panel), it did not bind to liposomes PA (left panel) or PI (right panel), reinforcing the notion that the interaction of VP3 with PI3P is specific. On top of each panel, the corresponding lipid structure is shown.CC BY · PubMed Central
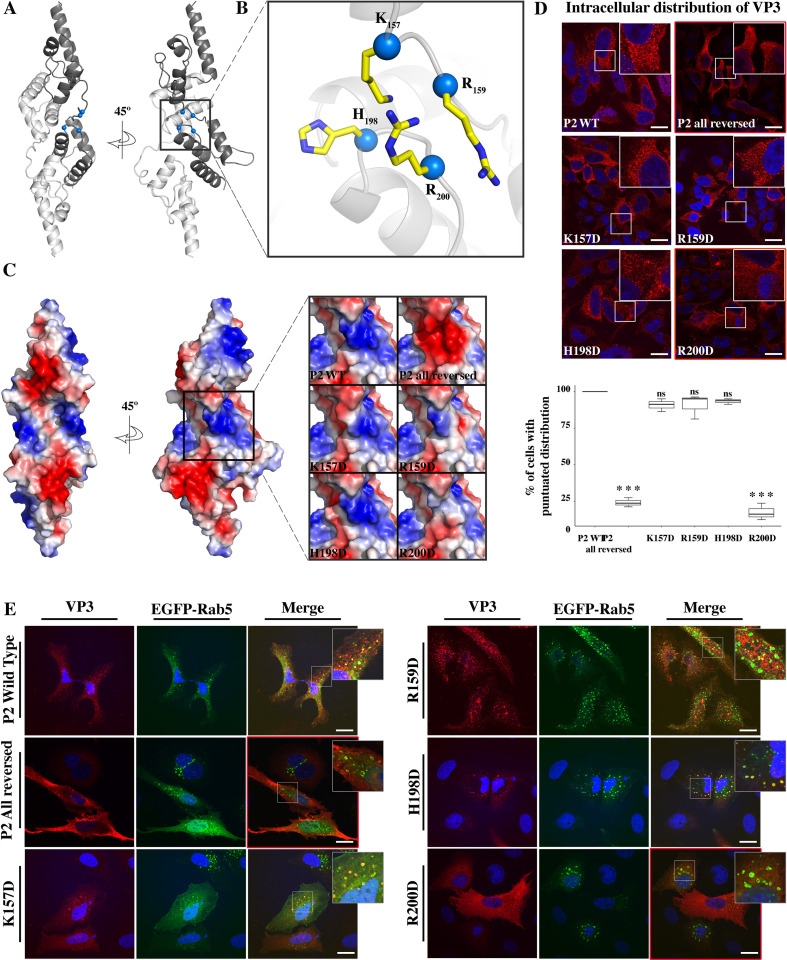
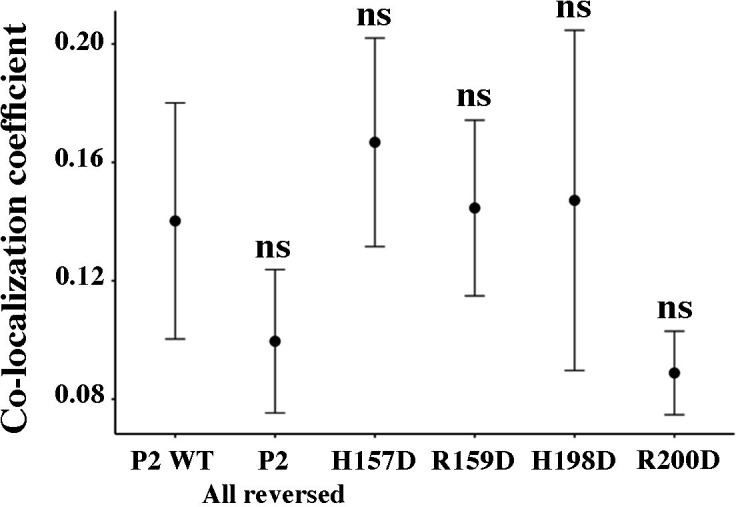
Figure 2. Viral protein 3 (VP3) P2 involvement in the association of VP3 with the early endosomes (EE) membrane. (A) The cartoon representation of the VP3 dimer PDB 2R18 (Casañas et al., 2008) shows each protomer in different shades of gray. The blue balls depict the residues defining the P2 region. (B) The close-up of P2 region showing residues K157, R159, H198,and R200. (C) Electrostatic potential mapped on the surface of the structure of a VP3 dimer in the same orientations as in (A) structures. The close-up shows the impact of P2 residue mutations on the electrostatic potential of the binding site. P2 wild-type (WT) corresponds to the ‘UniProt code’. The color-coded electrostatic surface potential of VP3 was drawn using PyMol (blue positive, red negative). (D) QM7 cells transfected with pcDNA VP3 FL (P2 WT), P2 (all reversed), or the four-point mutants (K157D, R159D, H198D, and R200D) and immunostained with anti-VP3 showing the distribution of each protein (upper panel). Images were captured using a Confocal Laser Scanning Microscopy and then the percentage of cells with punctated fluorescent signal were determined for each protein (lower panel). The red signal shows the VP3 distribution and the blue one shows the nuclei, which were Hoestch-stained. The data were normalized to the P2 WT protein. The box plot represents the percentage of cells with punctuated distribution of VP3. Significant differences (***p<0.001; ns p>0.05.) as determined by one-way ANOVA with Tukey’s HSD test. (E) QM7 cells co-transfected with pEGFP-Rab5 and pcDNA VP3 FL (P2 WT), P2 (all reversed), or the four-point mutants (K157D, R159D, H198D, and R200D) and immunostained with anti-VP3 showing the distribution of each protein. Representative images, captured using a Confocal Laser Scanning Microscopy are shown where green signal represents Rab5 distribution and the red signal that of VP3. Nuclei were Hoestch-stained and are blue. White bar-scales represent 20 mm. VP3 P2 (all reversed) and R200D depict a cytosolic distribution of the proteins. Quantification of the co-localization of the different VP3 proteins and EGFP-Rab5 is shown in Figure 2—figure supplement 1.
Figure 2. Viral protein 3 (VP3) P2 involvement in the association of VP3 with the early endosomes (EE) membrane. (A) The cartoon representation of the VP3 dimer PDB 2R18 (Casañas et al., 2008) shows each protomer in different shades of gray. The blue balls depict the residues defining the P2 region. (B) The close-up of P2 region showing residues K157, R159, H198,and R200. (C) Electrostatic potential mapped on the surface of the structure of a VP3 dimer in the same orientations as in (A) structures. The close-up shows the impact of P2 residue mutations on the electrostatic potential of the binding site. P2 wild-type (WT) corresponds to the ‘UniProt code’. The color-coded electrostatic surface potential of VP3 was drawn using PyMol (blue positive, red negative). (D) QM7 cells transfected with pcDNA VP3 FL (P2 WT), P2 (all reversed), or the four-point mutants (K157D, R159D, H198D, and R200D) and immunostained with anti-VP3 showing the distribution of each protein (upper panel). Images were captured using a Confocal Laser Scanning Microscopy and then the percentage of cells with punctated fluorescent signal were determined for each protein (lower panel). The red signal shows the VP3 distribution and the blue one shows the nuclei, which were Hoestch-stained. The data were normalized to the P2 WT protein. The box plot represents the percentage of cells with punctuated distribution of VP3. Significant differences (***p<0.001; ns p>0.05.) as determined by one-way ANOVA with Tukey’s HSD test. (E) QM7 cells co-transfected with pEGFP-Rab5 and pcDNA VP3 FL (P2 WT), P2 (all reversed), or the four-point mutants (K157D, R159D, H198D, and R200D) and immunostained with anti-VP3 showing the distribution of each protein. Representative images, captured using a Confocal Laser Scanning Microscopy are shown where green signal represents Rab5 distribution and the red signal that of VP3. Nuclei were Hoestch-stained and are blue. White bar-scales represent 20 mm. VP3 P2 (all reversed) and R200D depict a cytosolic distribution of the proteins. Quantification of the co-localization of the different VP3 proteins and EGFP-Rab5 is shown in Figure 2—figure supplement 1.CC BY · PubMed Central
Figure 2—figure supplement 1. VP3-EGFP-Rab5 co-localization quantification. The dot plot depicts the co-localization coefficient for each protein determined as explained in the Materials and methods section. Significant differences (ns p>0.05) as determined by one-way ANOVA with Tukey’s HSD test.
Figure 2—figure supplement 1. VP3-EGFP-Rab5 co-localization quantification. The dot plot depicts the co-localization coefficient for each protein determined as explained in the Materials and methods section. Significant differences (ns p>0.05) as determined by one-way ANOVA with Tukey’s HSD test.CC BY · PubMed Central
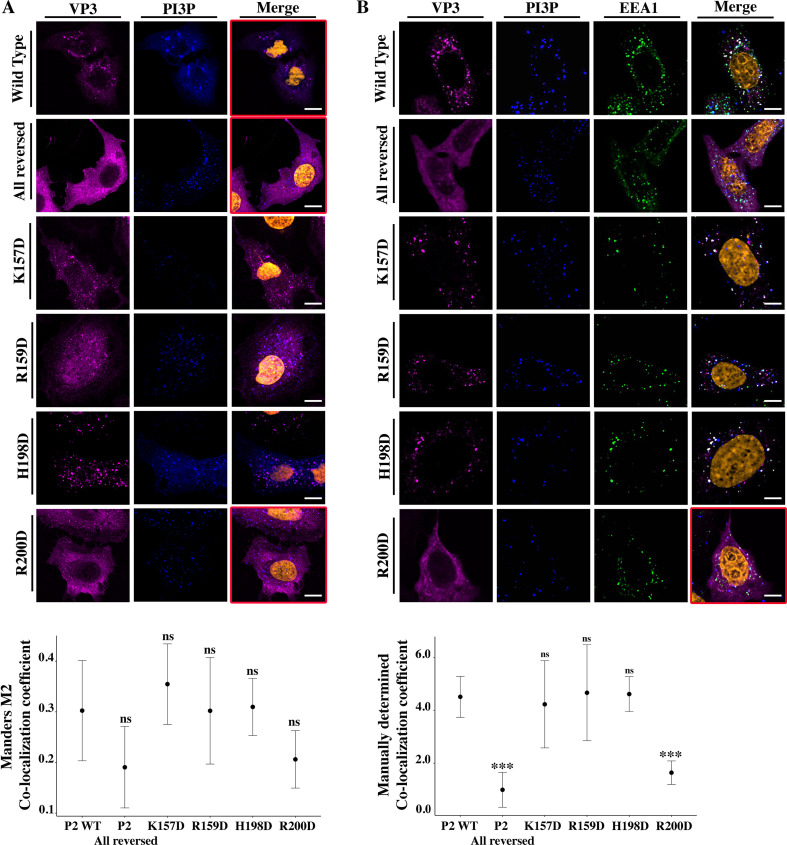
Figure 3. Viral protein 3 (VP3) P2 involvement in the association between VP3 and early endosomes (EE) phosphatidylinositol-3-phosphate (PI3P). (A) QM7 cells co-transfected with the PI3P biosensor pEGFP-2xFYVE and pcDNA VP3 FL (P2 WT), P2 (all reversed), or the four-point mutants (K157D, R159D, H198D, and R200D) and immunostained with anti-VP3 showing the distribution of each protein. Representative images captured using a Confocal Laser Scanning Microscopy are shown where blue signal represents FYVE distribution and the magenta signal that of VP3. Nuclei were Hoestch-stained and are orange (upper panels). White bar-scales represent 20 mm. VP3 P2 (all reversed) and R200D depict a cytosolic distribution of the proteins with a significant lower co-localization coefficient. The dot plot in the lower panel depicts the co-localization coefficient for each protein determined as explained in the Materials and methods section. Significant differences (ns p>0.05) as determined by one-way ANOVA with Tukey’s HSD test. (B) QM7 cells were transfected with the pcDNA VP3 FL (P2 WT), P2 (all reversed), or the four-point mutants (K157D, R159D, H198D, and R200D). The cells were fixed and then the GST-2xFYVE purified peptide and anti-VP3 antibodies were used to recognize endogenous PI3P and VP3, respectively. Additionally, anti-EEA1 antibodies were used to stain the endosomes. GST-2xFYVE was labelled with a fluorescent anti-GST antibody (blue signal), anti-VP3, and anti-EEA1 antibodies with fluorescent secondary antibodies (magenta and green signals, respectively), and Hoestch-stained nuclei in orange. White bar-scales represent 10 mm. VP3 P2 (all reversed) and R200D depict a cytosolic distribution of the proteins with a significant lower co-localization coefficient. The dot plot in the lower panel depicts the co-localization coefficient for each protein determined as explained in the Materials and methods section. Significant differences (***p<0.001; ns p>0.05) as determined by one-way ANOVA with Tukey’s HSD test.
Figure 3. Viral protein 3 (VP3) P2 involvement in the association between VP3 and early endosomes (EE) phosphatidylinositol-3-phosphate (PI3P). (A) QM7 cells co-transfected with the PI3P biosensor pEGFP-2xFYVE and pcDNA VP3 FL (P2 WT), P2 (all reversed), or the four-point mutants (K157D, R159D, H198D, and R200D) and immunostained with anti-VP3 showing the distribution of each protein. Representative images captured using a Confocal Laser Scanning Microscopy are shown where blue signal represents FYVE distribution and the magenta signal that of VP3. Nuclei were Hoestch-stained and are orange (upper panels). White bar-scales represent 20 mm. VP3 P2 (all reversed) and R200D depict a cytosolic distribution of the proteins with a significant lower co-localization coefficient. The dot plot in the lower panel depicts the co-localization coefficient for each protein determined as explained in the Materials and methods section. Significant differences (ns p>0.05) as determined by one-way ANOVA with Tukey’s HSD test. (B) QM7 cells were transfected with the pcDNA VP3 FL (P2 WT), P2 (all reversed), or the four-point mutants (K157D, R159D, H198D, and R200D). The cells were fixed and then the GST-2xFYVE purified peptide and anti-VP3 antibodies were used to recognize endogenous PI3P and VP3, respectively. Additionally, anti-EEA1 antibodies were used to stain the endosomes. GST-2xFYVE was labelled with a fluorescent anti-GST antibody (blue signal), anti-VP3, and anti-EEA1 antibodies with fluorescent secondary antibodies (magenta and green signals, respectively), and Hoestch-stained nuclei in orange. White bar-scales represent 10 mm. VP3 P2 (all reversed) and R200D depict a cytosolic distribution of the proteins with a significant lower co-localization coefficient. The dot plot in the lower panel depicts the co-localization coefficient for each protein determined as explained in the Materials and methods section. Significant differences (***p<0.001; ns p>0.05) as determined by one-way ANOVA with Tukey’s HSD test.CC BY · PubMed Central
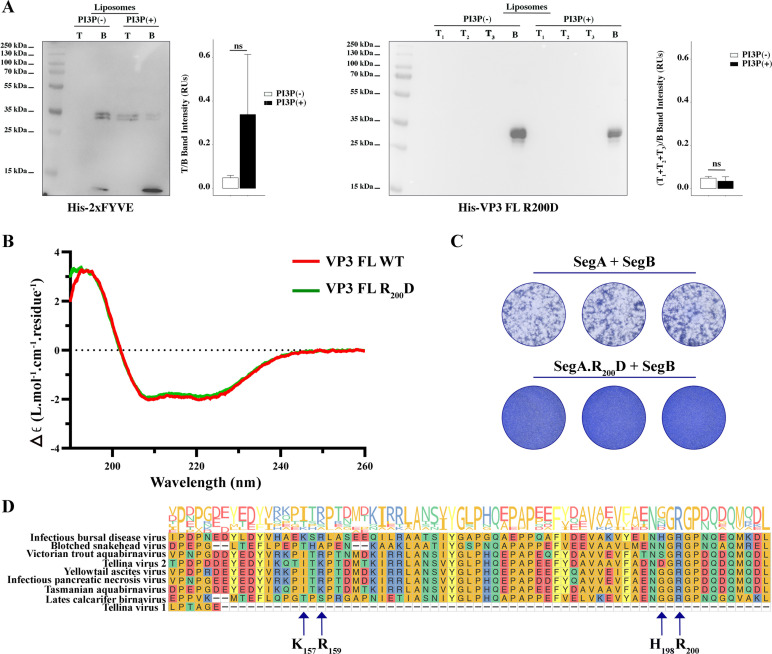
Figure 4. Biophysical characterization of viral protein 3 (VP3) full length (FL) R200D binding to phosphatidylinositol-3-phosphate (PI3P). (A, left panel). Immunoblots of the top (T) and bottom (B) fractions from a liposome PI3P(-) or PI3P(+) OptiprepTM co-floatation assay indicating that His-2xFYVE protein (~35 kDa) specifically binds to liposome PI3P(+). The bar plot represents the intensity of T/B bands for each liposome preparation. Significant differences (ns p>0.05) as determined by one-way ANOVA with Tukey’s HSD test. (A, right panel). Immunoblots of the three top (T1, T2, and T3) and bottom (B) fractions from a liposome PI3P(-) or PI3P(+) OptiprepTM co-floatation assay indicating that His-VP3 FL R200D protein (~35 kDa) does not bind to liposome PI3P(-) nor PI3P(+). The bar plot represents the intensity of (T1+T2+T3)/B bands for each liposome preparation. Significant differences (ns p>0.05) as determined by one-way ANOVA with Tukey’s HSD test. (B) Far-UV CD spectra of His-VP3 FL (red line) or His-VP3 FL R200D (green line). Spectral acquisitions at 50 nm/min with 0.1 nm steps at 1 s integration time, with a bandwidth of 1 nm were performed four times for the samples as well as for the buffer. The measurements were carried out with constant nitrogen gas flux of 10 ml/min. Acquisitions were averaged and buffer baseline was subtracted with Spectra Manager (JASCO). No smoothing was applied. CDtoolX was used to zero between 255–260 nm and to calibrate the signal amplitude from the fresh CSA signal (Miles and Wallace, 2018). Data are presented as delta epsilon (Δε) per residue (L.mol-1.cm-1.residue1) calculated using the molar concentration of protein and number of residues. (C) QM7 cells were grown in M24 multi-well plate for 12 hr to approximately 90–95% confluency and then 800 ng of plasmids were transfected [(SegA +SegB) or (SegA.R200D+SegB)] in triplicate. At 8 hr post-transfection (p.t.) the supernatants were discarded, and the monolayers were recovered for further plating on M6 multi-well plates containing non transfected QM7 cells. Avicel RC-591 (FMC Biopolymer) was added to the M6 multi-well plates. 72 hr p.i., the monolayers were fixated and stained with Coomassie R250 for revealing the foci forming units. (D) Partial view of amino acid alignment of the VP3 protein for nine reference members of Birnaviridae family. Multiple sequence alignment was performed with Clustal OMEGA (v1.2.4) (Sievers et al., 2011) implemented at EMBL’s European Bioinformatics Institute (Thakur et al., 2024) (The complete alignment is shown in Figure 4—figure supplement 1A). Alignment visualization was done with the R ggmsa package (Zhou et al., 2022) in with assistance from the RStudio software (RStudio Team, 2020). Amino acids are colored according to their side-chain chemistry. Protein sequence logos annotation is displayed on top of the amino acid alignment. For facilitating the view IBDV VP3 142–210 portion is shown. The black arrow indicates the K157, R159, H198, and R200.
Figure 4. Biophysical characterization of viral protein 3 (VP3) full length (FL) R200D binding to phosphatidylinositol-3-phosphate (PI3P). (A, left panel). Immunoblots of the top (T) and bottom (B) fractions from a liposome PI3P(-) or PI3P(+) OptiprepTM co-floatation assay indicating that His-2xFYVE protein (~35 kDa) specifically binds to liposome PI3P(+). The bar plot represents the intensity of T/B bands for each liposome preparation. Significant differences (ns p>0.05) as determined by one-way ANOVA with Tukey’s HSD test. (A, right panel). Immunoblots of the three top (T1, T2, and T3) and bottom (B) fractions from a liposome PI3P(-) or PI3P(+) OptiprepTM co-floatation assay indicating that His-VP3 FL R200D protein (~35 kDa) does not bind to liposome PI3P(-) nor PI3P(+). The bar plot represents the intensity of (T1+T2+T3)/B bands for each liposome preparation. Significant differences (ns p>0.05) as determined by one-way ANOVA with Tukey’s HSD test. (B) Far-UV CD spectra of His-VP3 FL (red line) or His-VP3 FL R200D (green line). Spectral acquisitions at 50 nm/min with 0.1 nm steps at 1 s integration time, with a bandwidth of 1 nm were performed four times for the samples as well as for the buffer. The measurements were carried out with constant nitrogen gas flux of 10 ml/min. Acquisitions were averaged and buffer baseline was subtracted with Spectra Manager (JASCO). No smoothing was applied. CDtoolX was used to zero between 255–260 nm and to calibrate the signal amplitude from the fresh CSA signal (Miles and Wallace, 2018). Data are presented as delta epsilon (Δε) per residue (L.mol-1.cm-1.residue1) calculated using the molar concentration of protein and number of residues. (C) QM7 cells were grown in M24 multi-well plate for 12 hr to approximately 90–95% confluency and then 800 ng of plasmids were transfected [(SegA +SegB) or (SegA.R200D+SegB)] in triplicate. At 8 hr post-transfection (p.t.) the supernatants were discarded, and the monolayers were recovered for further plating on M6 multi-well plates containing non transfected QM7 cells. Avicel RC-591 (FMC Biopolymer) was added to the M6 multi-well plates. 72 hr p.i., the monolayers were fixated and stained with Coomassie R250 for revealing the foci forming units. (D) Partial view of amino acid alignment of the VP3 protein for nine reference members of Birnaviridae family. Multiple sequence alignment was performed with Clustal OMEGA (v1.2.4) (Sievers et al., 2011) implemented at EMBL’s European Bioinformatics Institute (Thakur et al., 2024) (The complete alignment is shown in Figure 4—figure supplement 1A). Alignment visualization was done with the R ggmsa package (Zhou et al., 2022) in with assistance from the RStudio software (RStudio Team, 2020). Amino acids are colored according to their side-chain chemistry. Protein sequence logos annotation is displayed on top of the amino acid alignment. For facilitating the view IBDV VP3 142–210 portion is shown. The black arrow indicates the K157, R159, H198, and R200.CC BY · PubMed Central
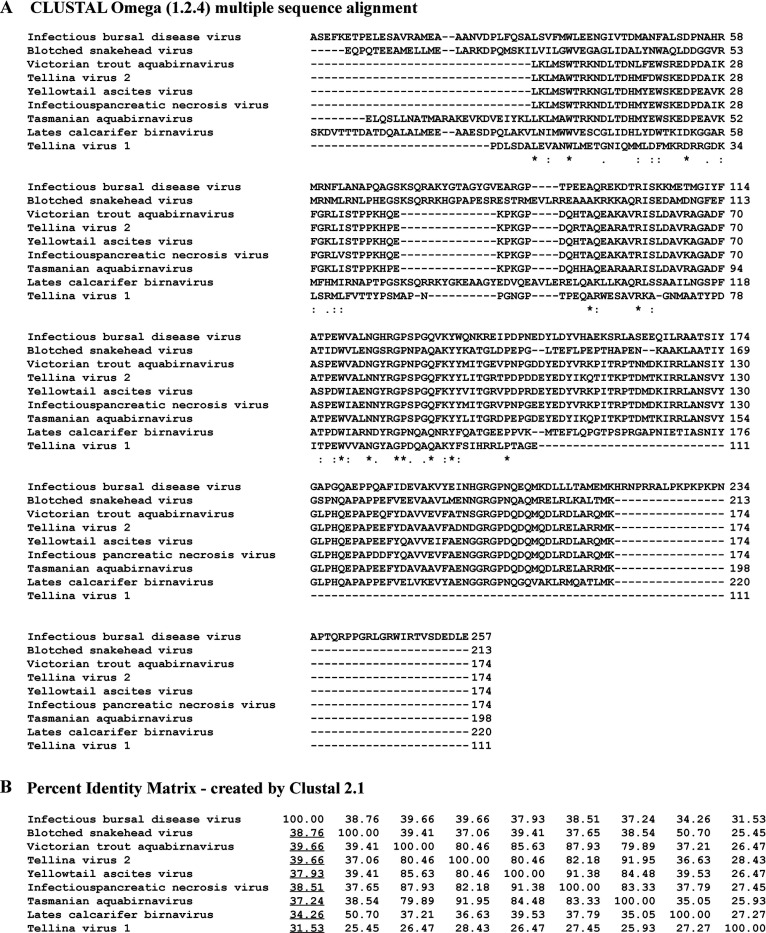
Figure 4—figure supplement 1. Bioinformatic analysis. (A) Viral protein 3 (VP3) multiple sequence alignment analysis performed with CLUSTAL Omega (Sievers et al., 2011) with IBDV VP3 (AF_140705.1) as the reference. Characters ‘*,’ ‘:,’ and ‘.’ below the sequences indicate identity (100% of conservation), homology (strongly similar,>50% of conservation), and homology (<50% of conservation), respectively. (B) Matrix showing the percentages of identity of non-IBDV VP3 related to IBDV VP3 (AF_140705.1) performed with CLUSTAL Omega as well. Underlined are indicated those of non-IBDV VP3 related to IBDV VP3.
Figure 4—figure supplement 1. Bioinformatic analysis. (A) Viral protein 3 (VP3) multiple sequence alignment analysis performed with CLUSTAL Omega (Sievers et al., 2011) with IBDV VP3 (AF_140705.1) as the reference. Characters ‘*,’ ‘:,’ and ‘.’ below the sequences indicate identity (100% of conservation), homology (strongly similar,>50% of conservation), and homology (<50% of conservation), respectively. (B) Matrix showing the percentages of identity of non-IBDV VP3 related to IBDV VP3 (AF_140705.1) performed with CLUSTAL Omega as well. Underlined are indicated those of non-IBDV VP3 related to IBDV VP3.CC BY · PubMed Central
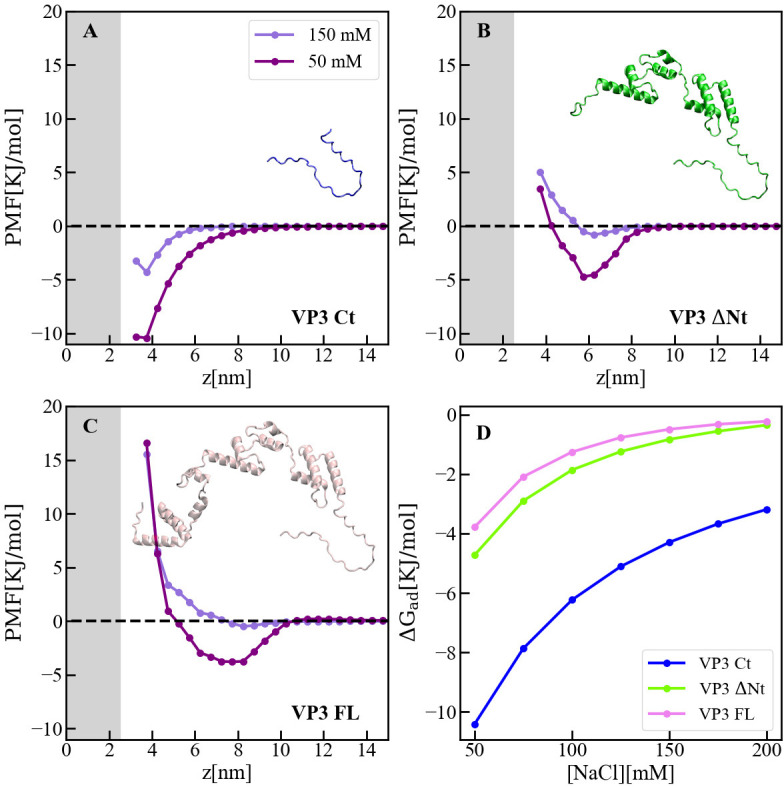
Figure 5. Adsorption of viral protein 3 (VP3) constructs to phosphatidylinositol-3-phosphate (PI3P)(+) model membranes. (A–C). Adsorption free-energy profiles, PMF(z),for VP3 Ct, VP3 ΔNt, and VP3 FL at 50 and 150 mM of NaCl. (D) Adsorption free energy (ΔGad), computed from the minimum of PMF(z), versus concentration of NaCl. In all cases, the solution pH is 8, and the concentration of protein is 1 µM. The gray areas represent the volume excluded by half the membrane (cis hemilayer, z>0). The membrane surface contains 5% titratable groups, representing PI3P. Each group has three acidic moieties, one with a pKa of 2.5 and the others with 6.5. At 150 mM NaCl and pH 8, more than 90% of the acidic groups are deprotonated (Figure 5—figure supplement 2).
Figure 5. Adsorption of viral protein 3 (VP3) constructs to phosphatidylinositol-3-phosphate (PI3P)(+) model membranes. (A–C). Adsorption free-energy profiles, PMF(z),for VP3 Ct, VP3 ΔNt, and VP3 FL at 50 and 150 mM of NaCl. (D) Adsorption free energy (ΔGad), computed from the minimum of PMF(z), versus concentration of NaCl. In all cases, the solution pH is 8, and the concentration of protein is 1 µM. The gray areas represent the volume excluded by half the membrane (cis hemilayer, z>0). The membrane surface contains 5% titratable groups, representing PI3P. Each group has three acidic moieties, one with a pKa of 2.5 and the others with 6.5. At 150 mM NaCl and pH 8, more than 90% of the acidic groups are deprotonated (Figure 5—figure supplement 2).CC BY · PubMed Central
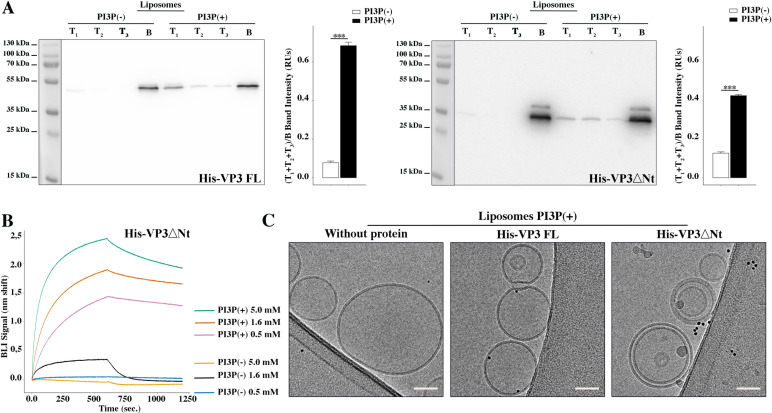
Figure 5—figure supplement 1. Biophysical characterization of His-viral protein 3 (VP3) DNt binding to phosphatidylinositol-3-phosphate (PI3P). (A) Left panel: Immunoblots of the three top (T1, T2, and T3) and the bottom (B) fractions from a liposome PI3P(-) or PI3P(+) OptiprepTM co-floatation assay indicating that His-VP3 full length (FL) protein specifically binds to liposome PI3P(+). Results are representative of three independent experiments. The bar plot represents the intensity of (T1+T2+T3)/B bands for each liposome preparation. Right panel: Immunoblots of the three top (T1, T2, and T3) and bottom (B) fractions from a liposome PI3P(-) or PI3P(+) OptiprepTM co-floatation assay indicating that His-VP3 ΔNt protein specifically binds to liposome PI3P(+). Results are representative of three independent experiments. The bar plot represents the intensity of (T1+T2+T2)/B bands for each liposome preparation. Significant differences (***p<0.001) as determined by one-way ANOVA with Tukey’s HSD test. (B) Binding of His-VP3 ΔNt to three different concentrations of liposomes PI3P(-) or PI3P(+). Association and dissociation sensorgrams measured by bio-layer interferometry (BLI), showing the specific interaction of His-VP3ΔNt with liposomes PI3P(+) in a dose-dependent manner, as indicated. (C) Transmission electron microscope images of cryo-fixated liposomes PI3P(+) control (without protein), or incubated with His-VP3 FL- or His-VP3 ΔNt-Ni-NTA gold particles showing electrodense particles decorating the membrane of the liposomes when His-VP3 FL or His-VP3 ΔNt were present. The scale bar represents 50 nm.
Figure 5—figure supplement 1. Biophysical characterization of His-viral protein 3 (VP3) DNt binding to phosphatidylinositol-3-phosphate (PI3P). (A) Left panel: Immunoblots of the three top (T1, T2, and T3) and the bottom (B) fractions from a liposome PI3P(-) or PI3P(+) OptiprepTM co-floatation assay indicating that His-VP3 full length (FL) protein specifically binds to liposome PI3P(+). Results are representative of three independent experiments. The bar plot represents the intensity of (T1+T2+T3)/B bands for each liposome preparation. Right panel: Immunoblots of the three top (T1, T2, and T3) and bottom (B) fractions from a liposome PI3P(-) or PI3P(+) OptiprepTM co-floatation assay indicating that His-VP3 ΔNt protein specifically binds to liposome PI3P(+). Results are representative of three independent experiments. The bar plot represents the intensity of (T1+T2+T2)/B bands for each liposome preparation. Significant differences (***p<0.001) as determined by one-way ANOVA with Tukey’s HSD test. (B) Binding of His-VP3 ΔNt to three different concentrations of liposomes PI3P(-) or PI3P(+). Association and dissociation sensorgrams measured by bio-layer interferometry (BLI), showing the specific interaction of His-VP3ΔNt with liposomes PI3P(+) in a dose-dependent manner, as indicated. (C) Transmission electron microscope images of cryo-fixated liposomes PI3P(+) control (without protein), or incubated with His-VP3 FL- or His-VP3 ΔNt-Ni-NTA gold particles showing electrodense particles decorating the membrane of the liposomes when His-VP3 FL or His-VP3 ΔNt were present. The scale bar represents 50 nm.CC BY · PubMed Central
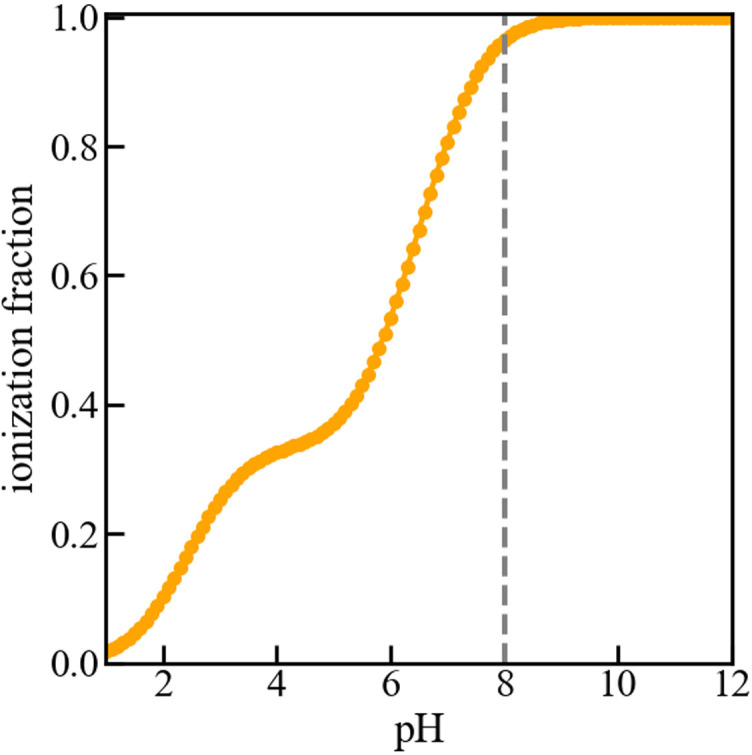
Figure 5—figure supplement 2. Titration curve of the membrane. Fraction of deprotonated (or ionized) acidic groups on the surface of the membrane versus pH of the bulk solution. The dashed vertical line indicates that at pH 8, the acidic groups are nearly fully deprotonated, resulting in a negative surface charge on the membrane. As mentioned in the manuscript, the model membrane consists of a 5 nm wide slab of dielectric material that exposes a mixture of 5% acidic and 95% neutral ‘head groups’ to a 150 mM NaCl solution. The acidic lipids contain three acid moieties with pKa values of 2.5 and 6.5, as determined for phosphatidylinositol-3-phosphate (PI3P). No proteins are present in the solution for the purpose of computing the titration curve. The curve was obtained using the Molecular Theory briefly described in the manuscript and fully detailed in the references (Chiarpotti et al., 2021; Ramírez et al., 2019).
Figure 5—figure supplement 2. Titration curve of the membrane. Fraction of deprotonated (or ionized) acidic groups on the surface of the membrane versus pH of the bulk solution. The dashed vertical line indicates that at pH 8, the acidic groups are nearly fully deprotonated, resulting in a negative surface charge on the membrane. As mentioned in the manuscript, the model membrane consists of a 5 nm wide slab of dielectric material that exposes a mixture of 5% acidic and 95% neutral ‘head groups’ to a 150 mM NaCl solution. The acidic lipids contain three acid moieties with pKa values of 2.5 and 6.5, as determined for phosphatidylinositol-3-phosphate (PI3P). No proteins are present in the solution for the purpose of computing the titration curve. The curve was obtained using the Molecular Theory briefly described in the manuscript and fully detailed in the references (Chiarpotti et al., 2021; Ramírez et al., 2019).CC BY · PubMed Central
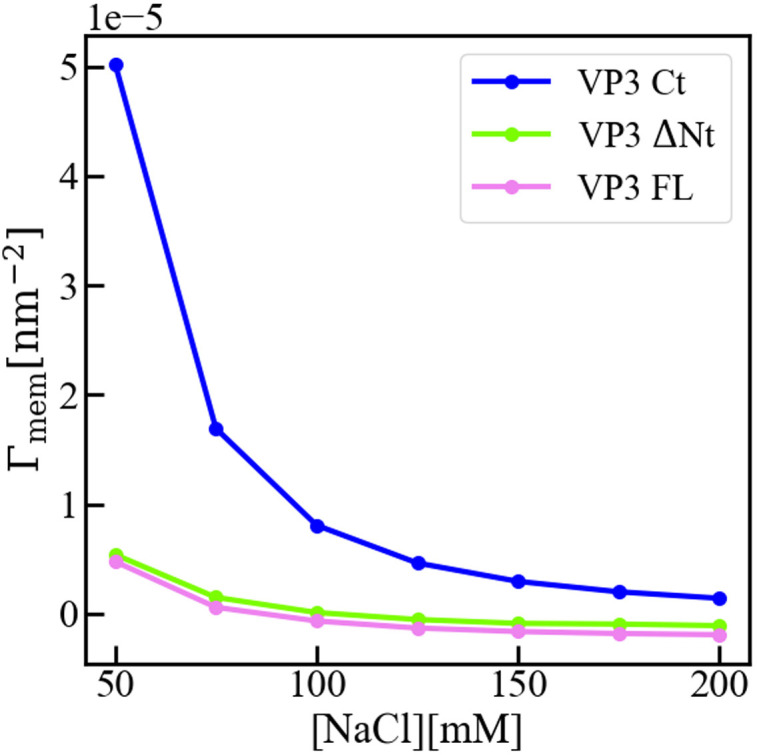
Figure 5—figure supplement 3. Interfacial concentration of viral protein 3 (VP3) constructs. Molecular Theory calculation of the surface concentration, or more precisely the surface excess concentration Γmem of the three protein constructs VP3 carboxy-terminal (Ct), VP3 ΔNt, and VP3 full length (FL), as a function of the concentration of salt in the bulk solution. The overall electrical charge of each construct is +5, 0, and –3, respectively. The pH of the solution is 8, so that the surface of the membrane is negatively charged. The surface concentration of each protein decreases when increasing the concentration of salt, as the salt ions screen the electrostatic interactions between the proteins and the surface of the membrane. Clearly, the effect is stronger for positively charged VP3 Ct. As detailed in reference (Chiarpotti et al., 2021) the surface excess is defined as Γmem=(∫)0^(∞)[⟨ρp(z)⟩−ρp^b]dz where ⟨ρp(z)⟩ is the average protein density at position z, and ρp^b is that in the bulk solution. Γmem gives the total number of proteins per unit area, in excess of the bulk solution, that accumulate (Γmem>0) or deplete (Γmem<0) due to the presence of the membrane.
Figure 5—figure supplement 3. Interfacial concentration of viral protein 3 (VP3) constructs. Molecular Theory calculation of the surface concentration, or more precisely the surface excess concentration Γmem of the three protein constructs VP3 carboxy-terminal (Ct), VP3 ΔNt, and VP3 full length (FL), as a function of the concentration of salt in the bulk solution. The overall electrical charge of each construct is +5, 0, and –3, respectively. The pH of the solution is 8, so that the surface of the membrane is negatively charged. The surface concentration of each protein decreases when increasing the concentration of salt, as the salt ions screen the electrostatic interactions between the proteins and the surface of the membrane. Clearly, the effect is stronger for positively charged VP3 Ct. As detailed in reference (Chiarpotti et al., 2021) the surface excess is defined as Γmem=(∫)0^(∞)[⟨ρp(z)⟩−ρp^b]dz where ⟨ρp(z)⟩ is the average protein density at position z, and ρp^b is that in the bulk solution. Γmem gives the total number of proteins per unit area, in excess of the bulk solution, that accumulate (Γmem>0) or deplete (Γmem<0) due to the presence of the membrane.CC BY · PubMed Central
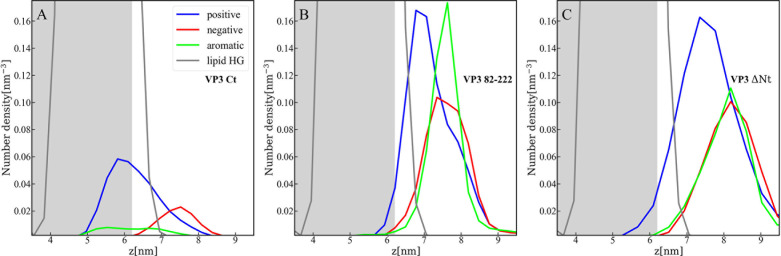
Figure 5—figure supplement 4. Distribution of charged and aromatic residues of viral protein 3 (VP3). Spatial distribution of charged groups obtained from coarse-grained Molecular Dynamics simulations of VP3 carboxy-terminal (Ct) (A), VP3 82-222 (B), and VP3 ΔNt (C) adsorbed on a lipid bilayer composed of 1,2-dioleoyl-sn-glycero-3-phosphoethanolamine (DOPE), 1,2-dioleoyl-sn-glycero-3-phosphocholine (DOPC), and phosphatidylinositol-3-phosphate (PI3P) (with molar ratios of 64:31:5). DOPE and DOPC are electroneutral, while PI3P is anionic. VP3 82-222 represents a portion of the VP3 sequence for which a crystallographic structure is known (Gly82-Asn222). It was included in the plot for comparison with VP3 Ct (Arg223-Glu257) and VP3 ΔNt (Gly82-Glu257). The variable 'z' represents the z-component of the perpendicular distance between the center of mass of the membrane and the center of mass of each protein. The blue curves represent the distribution of positively charged residues in the protein, while the red curves represent the distribution of negatively charged residues. The green curves depict the distribution of aromatic residues, and the gray curves represent the distribution of the lipid’s polar head groups. The gray shaded area schematically represents the region predominantly occupied by the lipids. As observed, in all cases, the positively charged amino-acids are in closer contact with the membrane surface and penetrate into the region of the lipid’s polar head groups. In VP3 ΔNt, negatively charged and aromatic residues are somewhat more exposed towards the solution side of the interface.
Figure 5—figure supplement 4. Distribution of charged and aromatic residues of viral protein 3 (VP3). Spatial distribution of charged groups obtained from coarse-grained Molecular Dynamics simulations of VP3 carboxy-terminal (Ct) (A), VP3 82-222 (B), and VP3 ΔNt (C) adsorbed on a lipid bilayer composed of 1,2-dioleoyl-sn-glycero-3-phosphoethanolamine (DOPE), 1,2-dioleoyl-sn-glycero-3-phosphocholine (DOPC), and phosphatidylinositol-3-phosphate (PI3P) (with molar ratios of 64:31:5). DOPE and DOPC are electroneutral, while PI3P is anionic. VP3 82-222 represents a portion of the VP3 sequence for which a crystallographic structure is known (Gly82-Asn222). It was included in the plot for comparison with VP3 Ct (Arg223-Glu257) and VP3 ΔNt (Gly82-Glu257). The variable 'z' represents the z-component of the perpendicular distance between the center of mass of the membrane and the center of mass of each protein. The blue curves represent the distribution of positively charged residues in the protein, while the red curves represent the distribution of negatively charged residues. The green curves depict the distribution of aromatic residues, and the gray curves represent the distribution of the lipid’s polar head groups. The gray shaded area schematically represents the region predominantly occupied by the lipids. As observed, in all cases, the positively charged amino-acids are in closer contact with the membrane surface and penetrate into the region of the lipid’s polar head groups. In VP3 ΔNt, negatively charged and aromatic residues are somewhat more exposed towards the solution side of the interface.CC BY · PubMed Central
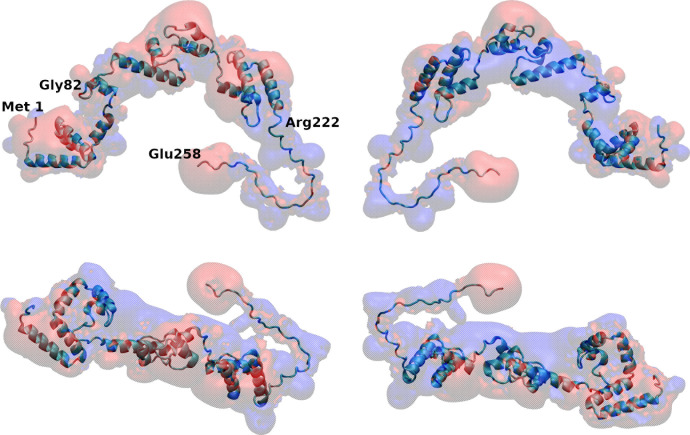
Figure 5—figure supplement 5. Map of electrostatic potential around viral protein 3 (VP3) full length (FL). Four different views of the electrostatic potential map around VP3 FL, as computed with the Adaptive Poisson-Boltzmann Solver (APBS) plugin of VMD (Dolinsky et al., 2004). Electrostatic isopotential surfaces at +1.1 mV in red and at –1.1mV in blue account for negative and positive electrostatic potential, respectively.
Figure 5—figure supplement 5. Map of electrostatic potential around viral protein 3 (VP3) full length (FL). Four different views of the electrostatic potential map around VP3 FL, as computed with the Adaptive Poisson-Boltzmann Solver (APBS) plugin of VMD (Dolinsky et al., 2004). Electrostatic isopotential surfaces at +1.1 mV in red and at –1.1mV in blue account for negative and positive electrostatic potential, respectively.CC BY · PubMed Central
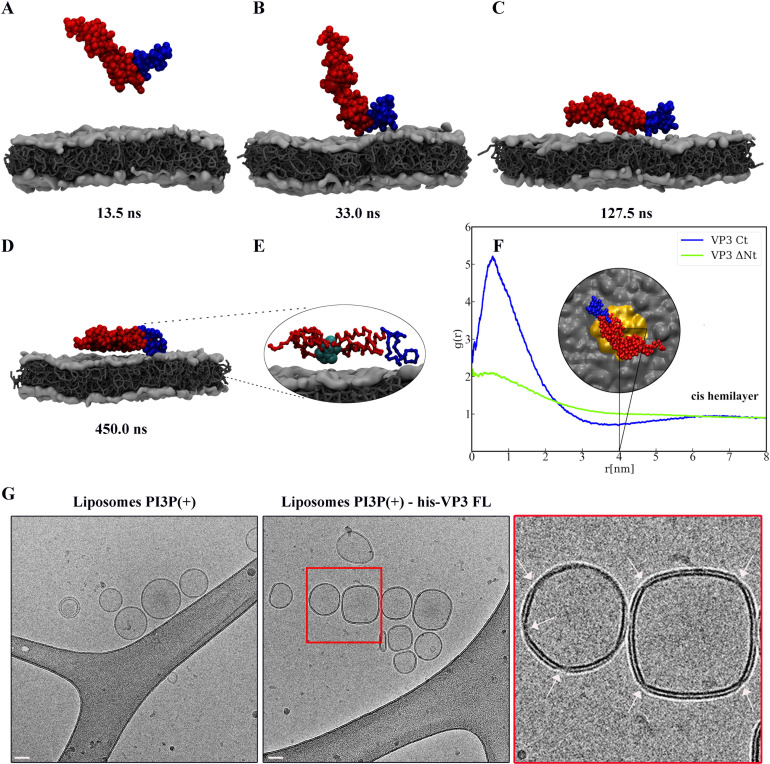
Figure 6. Viral protein 3 (VP3) approaching a lipid bilayer, and distortion of the membrane. (A–D) Temporal sequence of configurations illustrating how VP3 ΔNt approaches the negatively charged membrane during a 500 ns molecular dynamics (MD) simulation. The membrane contains 1,2-dioleoyl-sn-glycero-3-phosphoethanolamine (DOPE),1,2-dioleoyl-sn-glycero-3-phosphocholine (DOPC), and phosphatidylinositol-3-phosphate (PI3P) in 64:31:5 molar ratio. The beads making the carboxy-terminal (Ct) fragment are colored blue. (E) Magnification of the protein configuration bound to the membrane, with P2 residues represented in cyan balls. (F) Radial distribution function, g(r), between the center of mass of VP3 ΔNt and the center of PI3P molecules in the cis hemilayer. g(r) greater than 1 implies local enhancement of PI3P concentration. The inset shows an upper view of VP3 ΔNt bound to the membrane, with the area within r=4 nm colored in orange. (G) Cryo-electron microscopy images of cryo-fixated liposomes PI3P(+) control (without protein, left panel), or incubated with His-VP3 FL showing the small pinches or localized thinnings in the bilayer of the liposomes when His-VP3 FL was present (middle panel). The bar represents 50 nm. The right panel represents an enlarged image of the red square on the middle panel. White arrows point to the small pinches or localized thinnings in the bilayer when His-VP3 FL was present.
Figure 6. Viral protein 3 (VP3) approaching a lipid bilayer, and distortion of the membrane. (A–D) Temporal sequence of configurations illustrating how VP3 ΔNt approaches the negatively charged membrane during a 500 ns molecular dynamics (MD) simulation. The membrane contains 1,2-dioleoyl-sn-glycero-3-phosphoethanolamine (DOPE),1,2-dioleoyl-sn-glycero-3-phosphocholine (DOPC), and phosphatidylinositol-3-phosphate (PI3P) in 64:31:5 molar ratio. The beads making the carboxy-terminal (Ct) fragment are colored blue. (E) Magnification of the protein configuration bound to the membrane, with P2 residues represented in cyan balls. (F) Radial distribution function, g(r), between the center of mass of VP3 ΔNt and the center of PI3P molecules in the cis hemilayer. g(r) greater than 1 implies local enhancement of PI3P concentration. The inset shows an upper view of VP3 ΔNt bound to the membrane, with the area within r=4 nm colored in orange. (G) Cryo-electron microscopy images of cryo-fixated liposomes PI3P(+) control (without protein, left panel), or incubated with His-VP3 FL showing the small pinches or localized thinnings in the bilayer of the liposomes when His-VP3 FL was present (middle panel). The bar represents 50 nm. The right panel represents an enlarged image of the red square on the middle panel. White arrows point to the small pinches or localized thinnings in the bilayer when His-VP3 FL was present.CC BY · PubMed Central
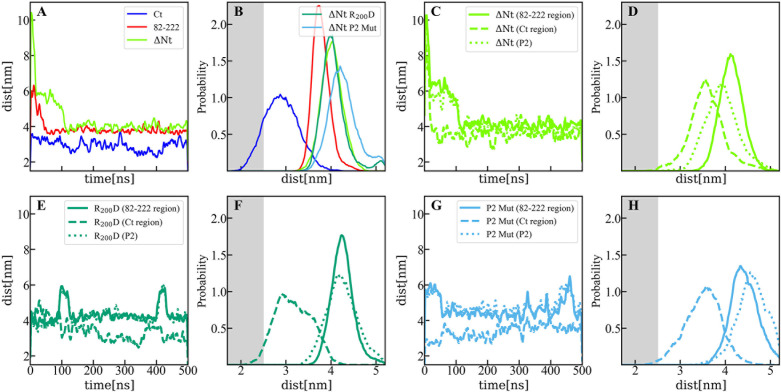
Figure 6—figure supplement 1. Distance between membrane and protein constructs computed by molecular dynamics (MD). (A) Time evolution of the distance (perpendicular to the membrane surface) between the center of mass of viral protein 3 (VP3) carboxy-terminal (Ct) (blue solid line), VP3 82–222 (red solid line), and VP3 DNt (green solid line) and the center of mass of the membrane. (B) Distribution of distances computed from the time-traces of panel A in the time interval [200-500] ns; and also from simulations of two mutants of VP3 ΔNt: the single mutant R200D (VP3 ΔNt R200D) and the one with the four residues of the P2 region mutated K157D, R159D, H198D and R200D (VP3 ΔNt P2 Mut). The VP3 Ct construct gets closer to the membrane than any other construct or protein domain and, more importantly, VP3 ΔNt adsorbs with the Ct region facing the negatively charged membrane. The single mutant exhibits a binding similar to wild-type VP3 ΔNt protein, while the one with the whole P2 mutated is located further away from the negative surface. Results obtained by coarse-grained Molecular Dynamics simulation of VP3 Ct, VP3 82–222, and VP3 ΔNt, in front of a 1,2-dioleoyl-sn-glycero-3-phosphoethanolamine (DOPE), 1,2-dioleoyl-sn-glycero-3-phosphocholine (DOPC), phosphatidylinositol-3-phosphate (PI3P) membrane (molar ratios of 64:31:5). (C, E, G) Time evolution of the distance between the center of mass of different protein regions and the center of mass of the membrane for VP3 ΔNt and the two mutants. The continuous line corresponds to the center of mass of the region 82–222, the dashed lines, to the Ct region, and the dotted lines, to the P2 region.(D, F, H) Distribution of distances computed from the time-traces of panels C, E, and G in the time interval [200- 500] ns.
Figure 6—figure supplement 1. Distance between membrane and protein constructs computed by molecular dynamics (MD). (A) Time evolution of the distance (perpendicular to the membrane surface) between the center of mass of viral protein 3 (VP3) carboxy-terminal (Ct) (blue solid line), VP3 82–222 (red solid line), and VP3 DNt (green solid line) and the center of mass of the membrane. (B) Distribution of distances computed from the time-traces of panel A in the time interval [200-500] ns; and also from simulations of two mutants of VP3 ΔNt: the single mutant R200D (VP3 ΔNt R200D) and the one with the four residues of the P2 region mutated K157D, R159D, H198D and R200D (VP3 ΔNt P2 Mut). The VP3 Ct construct gets closer to the membrane than any other construct or protein domain and, more importantly, VP3 ΔNt adsorbs with the Ct region facing the negatively charged membrane. The single mutant exhibits a binding similar to wild-type VP3 ΔNt protein, while the one with the whole P2 mutated is located further away from the negative surface. Results obtained by coarse-grained Molecular Dynamics simulation of VP3 Ct, VP3 82–222, and VP3 ΔNt, in front of a 1,2-dioleoyl-sn-glycero-3-phosphoethanolamine (DOPE), 1,2-dioleoyl-sn-glycero-3-phosphocholine (DOPC), phosphatidylinositol-3-phosphate (PI3P) membrane (molar ratios of 64:31:5). (C, E, G) Time evolution of the distance between the center of mass of different protein regions and the center of mass of the membrane for VP3 ΔNt and the two mutants. The continuous line corresponds to the center of mass of the region 82–222, the dashed lines, to the Ct region, and the dotted lines, to the P2 region.(D, F, H) Distribution of distances computed from the time-traces of panels C, E, and G in the time interval [200- 500] ns.CC BY · PubMed Central
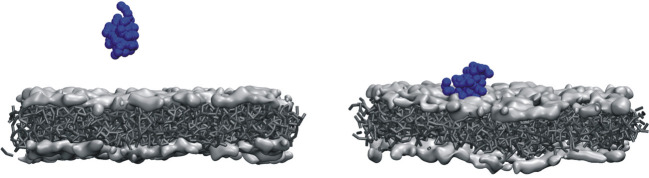
Figure 6—figure supplement 2. Initial and final configurations of viral protein 3 (VP3) carboxy-terminal (Ct) on a lipid membrane. Initial (left panel) and final (right panel) configurations from a 500 ns coarse-grained Molecular Dynamics simulation of VP3 Ct in front of a 1,2-dioleoyl-sn-glycero-3-phosphoethanolamine (DOPE), 1,2-dioleoyl-sn-glycero-3-phosphocholine (DOPC), phosphatidylinositol-3-phosphate (PI3P) membrane (molar ratios of 64:31:5).
Figure 6—figure supplement 2. Initial and final configurations of viral protein 3 (VP3) carboxy-terminal (Ct) on a lipid membrane. Initial (left panel) and final (right panel) configurations from a 500 ns coarse-grained Molecular Dynamics simulation of VP3 Ct in front of a 1,2-dioleoyl-sn-glycero-3-phosphoethanolamine (DOPE), 1,2-dioleoyl-sn-glycero-3-phosphocholine (DOPC), phosphatidylinositol-3-phosphate (PI3P) membrane (molar ratios of 64:31:5).CC BY · PubMed Central
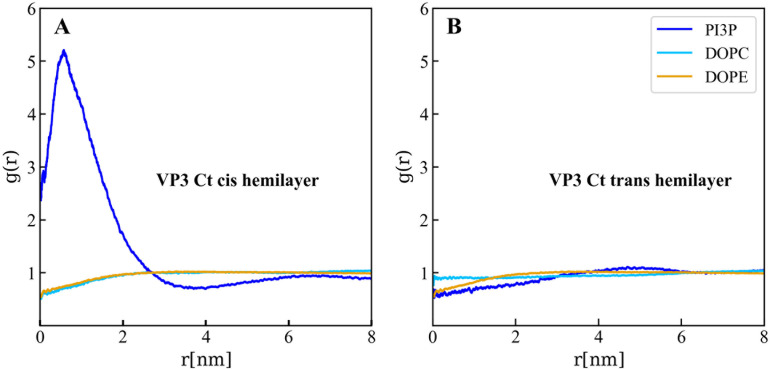
Figure 6—figure supplement 3. Lipids accumulation/depletion around viral protein 3 (VP3) carboxy-terminal (Ct). In plane (X–Y) radial distribution functions, g(r). These functions were computed during the 200–500 ns time interval of the Molecular Dynamics simulations described in the text and in the previous supporting figures. The panels display the g(r) between the lipids in the cis- (left) and trans- (right) membrane hemilayers, and the center of mass of the VP3 Ct construct. Once again, this positively charged construct attracts the PI3P molecules from the cis-hemilayer to its proximity, as evident from the values of g(r)>1 for r<2 nm. Moreover, for VP3 Ct this effect is strong enough to deplete the PI3P molecules in the trans-hemilayer due to inter-hemilayer phosphatidylinositol-3-phosphate (PI3P)-PI3P electrostatic repulsions.
Figure 6—figure supplement 3. Lipids accumulation/depletion around viral protein 3 (VP3) carboxy-terminal (Ct). In plane (X–Y) radial distribution functions, g(r). These functions were computed during the 200–500 ns time interval of the Molecular Dynamics simulations described in the text and in the previous supporting figures. The panels display the g(r) between the lipids in the cis- (left) and trans- (right) membrane hemilayers, and the center of mass of the VP3 Ct construct. Once again, this positively charged construct attracts the PI3P molecules from the cis-hemilayer to its proximity, as evident from the values of g(r)>1 for r<2 nm. Moreover, for VP3 Ct this effect is strong enough to deplete the PI3P molecules in the trans-hemilayer due to inter-hemilayer phosphatidylinositol-3-phosphate (PI3P)-PI3P electrostatic repulsions.CC BY · PubMed Central
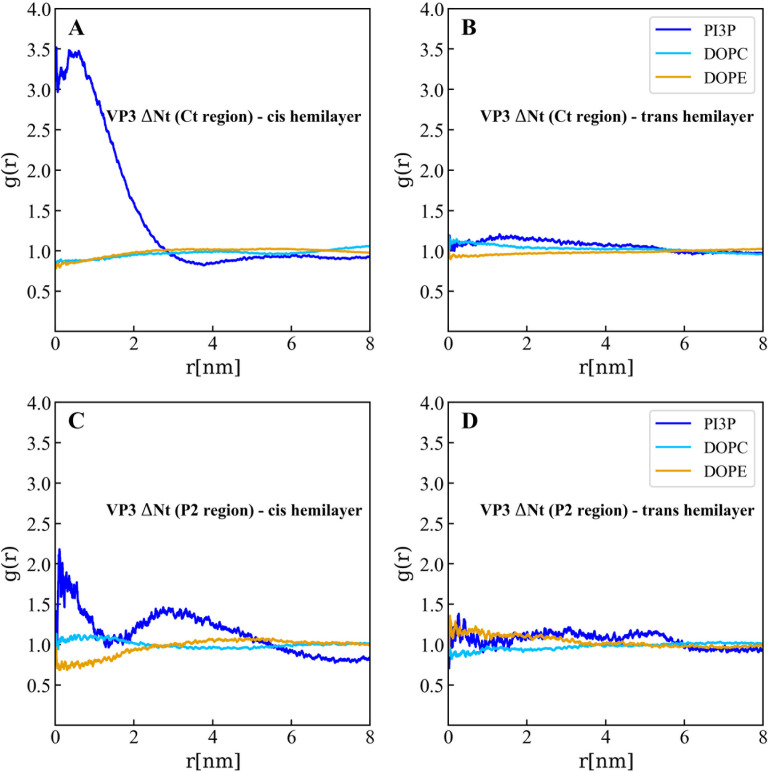
Figure 6—figure supplement 4. Lipids accumulation/depletion around the carboxy-terminal (Ct) fragment of viral protein 3 (VP3) DNt. In plane (X–Y) radial distribution functions, g(r). These functions were computed during the 200-500 ns time interval of the Molecular Dynamics simulations described in the text and in the previous supporting figures. The upper panels display the g(r) between the lipids in the cis- (left) and trans- (right) membrane hemilayers, and the center of the Ct domain of VP3 ΔNt. As observed, the Ct domain attracts phosphatidylinositol-3-phosphate (PI3P) to its proximity, within a radius of approximately 4 nm where g(r)>1 (blue line), in the hemilayer that is in contact with the protein (cis-). The lower panels depict the radial distribution functions between the lipids in the cis- (left) and trans- (right) hemilayers, and the P2 domain of VP3 ΔNt. Once again, P2 attracts PI3P to its proximity in the cis-hemilayer, within a radius of about 5 nm.
Figure 6—figure supplement 4. Lipids accumulation/depletion around the carboxy-terminal (Ct) fragment of viral protein 3 (VP3) DNt. In plane (X–Y) radial distribution functions, g(r). These functions were computed during the 200-500 ns time interval of the Molecular Dynamics simulations described in the text and in the previous supporting figures. The upper panels display the g(r) between the lipids in the cis- (left) and trans- (right) membrane hemilayers, and the center of the Ct domain of VP3 ΔNt. As observed, the Ct domain attracts phosphatidylinositol-3-phosphate (PI3P) to its proximity, within a radius of approximately 4 nm where g(r)>1 (blue line), in the hemilayer that is in contact with the protein (cis-). The lower panels depict the radial distribution functions between the lipids in the cis- (left) and trans- (right) hemilayers, and the P2 domain of VP3 ΔNt. Once again, P2 attracts PI3P to its proximity in the cis-hemilayer, within a radius of about 5 nm.CC BY · PubMed Central
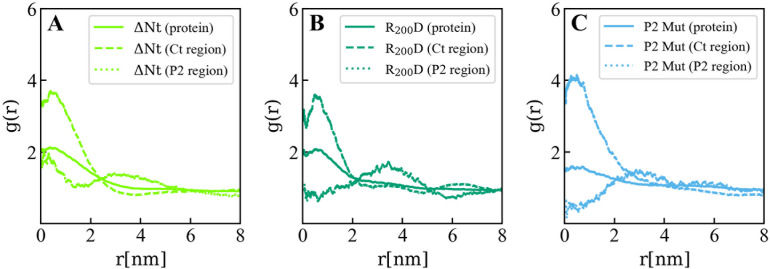
Figure 6—figure supplement 5. Lipids accumulation/depletion around viral protein 3 (VP3) ΔNt and its mutants. In plane (X–Y) radial distribution functions, g(r) computed in the 200-500 ns time interval of the Molecular Dynamics simulations of the VP3 ΔNt protein (A) and two mutants: VP3 ΔNt R200D (B) and VP3 ΔNt P2 Mut (C). The panels display the g(r) between phosphatidylinositol-3-phosphate (PI3P) lipids in the cis membrane hemilayer, and the center of mass of the whole protein (continuous line), the Ct region (dashed line), and the P2 region (dotted line). The concentration effects on PI3P, induced by VP3 ΔNt, is exerted by the positively charged Ct and the P2 regions. When the P2 region is mutated, the P2 contribution to PI3P recruitment is diminished gradually from the single mutant to the wholly mutated P2.
Figure 6—figure supplement 5. Lipids accumulation/depletion around viral protein 3 (VP3) ΔNt and its mutants. In plane (X–Y) radial distribution functions, g(r) computed in the 200-500 ns time interval of the Molecular Dynamics simulations of the VP3 ΔNt protein (A) and two mutants: VP3 ΔNt R200D (B) and VP3 ΔNt P2 Mut (C). The panels display the g(r) between phosphatidylinositol-3-phosphate (PI3P) lipids in the cis membrane hemilayer, and the center of mass of the whole protein (continuous line), the Ct region (dashed line), and the P2 region (dotted line). The concentration effects on PI3P, induced by VP3 ΔNt, is exerted by the positively charged Ct and the P2 regions. When the P2 region is mutated, the P2 contribution to PI3P recruitment is diminished gradually from the single mutant to the wholly mutated P2.CC BY · PubMed Central
Figure 6—figure supplement 6. Adsorption free energy of viral protein 3 (VP3) ΔNt and VP3 ΔNt mutants on PI3P(+) model membranes. Adsorption free energy (ΔGad), computed from the minimum of PMF(z), versus concentration of NaCl, for VP3 ΔNt and the mutants VP3 ΔNt R200D and VP3 ΔNt P2 Mut. In all cases, the solution pH is 8, and the concentration of protein is 1 µM. The membrane surface contains 5% titratable groups, representing phosphatidylinositol-3-phosphate (PI3P). Each group has three acidic moieties, one with a pKa of 2.5 and the others with 6.5. At 150 mM NaCl and pH 8, more than 90% of the acidic groups are deprotonated. As the number of positively charged residues in VP3 is systematically reduced from VP3 ΔNt to VP3 ΔNt P2 Mut, the binding of the protein to the membrane becomes weaker. The effect is more pronounced at lower salt concentrations, which highlights the weight of electrostatic forces on the adsorption of VP3 on negatively charged membranes.
Figure 6—figure supplement 6. Adsorption free energy of viral protein 3 (VP3) ΔNt and VP3 ΔNt mutants on PI3P(+) model membranes. Adsorption free energy (ΔGad), computed from the minimum of PMF(z), versus concentration of NaCl, for VP3 ΔNt and the mutants VP3 ΔNt R200D and VP3 ΔNt P2 Mut. In all cases, the solution pH is 8, and the concentration of protein is 1 µM. The membrane surface contains 5% titratable groups, representing phosphatidylinositol-3-phosphate (PI3P). Each group has three acidic moieties, one with a pKa of 2.5 and the others with 6.5. At 150 mM NaCl and pH 8, more than 90% of the acidic groups are deprotonated. As the number of positively charged residues in VP3 is systematically reduced from VP3 ΔNt to VP3 ΔNt P2 Mut, the binding of the protein to the membrane becomes weaker. The effect is more pronounced at lower salt concentrations, which highlights the weight of electrostatic forces on the adsorption of VP3 on negatively charged membranes.CC BY · PubMed Central
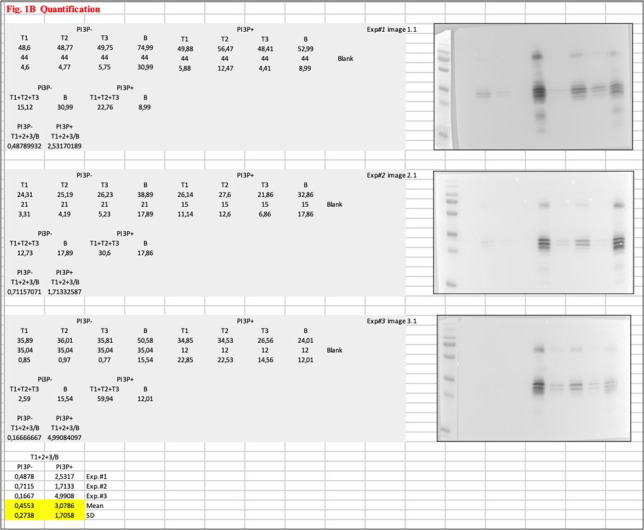
Author response image 1.
Author response image 1. CC BY · PubMed Central

Verification

Claims the paper makes

The claims and statistics of this paper haven’t been checked yet.

Run the check — free, no account needed. It reads the open-access text and checks the sources it cites.

A few free checks a day · papers already verified open instantly · results are public

Self-check

Percentages, sums and reported differences re-computed from the paper’s own numbers.

The self-check needs the paper’s full text.

Citations

Cites

Show all 2 references

Research works printed but not linked: 74

  1. Baltimore, 1971, Expression of animal virus genomes, Bacteriological Reviews, 35, 235, 10.1128/br.35.3.235-241.1971 · DOI
  2. Banani, 2017, Biomolecular condensates: organizers of cellular biochemistry, Nature Reviews. Molecular Cell Biology, 18, 285, 10.1038/nrm.2017.7 · DOI
  3. Bolte, 2006, A guided tour into subcellular colocalization analysis in light microscopy, Journal of Microscopy, 224, 213, 10.1111/j.1365-2818.2006.01706.x · DOI
  4. Brodrick, 2023, The formation and function of Birnaviridae virus factories, International Journal of Molecular Sciences, 24, 10.3390/ijms24108471 · DOI
  5. Burd, 1998, Phosphatidylinositol(3)-phosphate signaling mediated by specific binding to RING FYVE domains, Molecular Cell, 2, 157, 10.1016/s1097-2765(00)80125-2 · DOI
  6. Casañas, 2008, Structural insights into the multifunctional protein VP3 of birnaviruses, Structure, 16, 29, 10.1016/j.str.2007.10.023 · DOI
  7. Chiarpotti, 2021, Nanoparticles modified with cell penetrating peptides: assessing adsorption on membranes containing acidic lipids, Colloids and Surfaces. B, Biointerfaces, 197, 10.1016/j.colsurfb.2020.111373 · DOI
  8. Coulibaly, 2005, The birnavirus crystal structure reveals structural relationships among icosahedral viruses, Cell, 120, 761, 10.1016/j.cell.2005.01.009 · DOI
  9. Darden, 1993, Particle mesh Ewald: An N⋅log(N) method for Ewald sums in large systems, The Journal of Chemical Physics, 98, 10089, 10.1063/1.464397 · DOI
  10. de Jong, 2013, Improved parameters for the martini coarse-grained protein force field, Journal of Chemical Theory and Computation, 9, 687, 10.1021/ct300646g · DOI · Paper page
  11. Delgui, 2013, The endosomal pathway and the Golgi complex are involved in the infectious bursal disease virus life cycle, Journal of Virology, 87, 8993, 10.1128/JVI.03152-12 · DOI
  12. Delmas, 2019, ICTV virus taxonomy profile: birnaviridae, The Journal of General Virology, 100, 5, 10.1099/jgv.0.001185 · DOI
  13. Dolinsky, 2004, PDB2PQR: an automated pipeline for the setup of Poisson-Boltzmann electrostatics calculations, Nucleic Acids Research, 32, W665, 10.1093/nar/gkh381 · DOI
  14. Fernandes, 2011, Phosphoinositides direct equine infectious anemia virus gag trafficking and release, Traffic, 12, 438, 10.1111/j.1600-0854.2010.01153.x · DOI
  15. Ghanem, 2012, Significantly improved rescue of rabies virus from cDNA plasmids, European Journal of Cell Biology, 91, 10, 10.1016/j.ejcb.2011.01.008 · DOI
  16. Gibson, 2009, Enzymatic assembly of DNA molecules up to several hundred kilobases, Nature Methods, 6, 343, 10.1038/nmeth.1318 · DOI
  17. Gillooly, 2000, Localization of phosphatidylinositol 3-phosphate in yeast and mammalian cells, The EMBO Journal, 19, 4577, 10.1093/emboj/19.17.4577 · DOI · Paper page
  18. Gimenez, 2018, Infectious bursal disease virus hijacks endosomal membranes as the scaffolding structure for viral replication, Journal of Virology, 92, 10.1128/JVI.01964-17 · DOI
  19. Gimenez, 2021, Phosphatidylinositol 3-phosphate mediates the establishment of infectious bursal disease virus replication complexes in association with early endosomes, Journal of Virology, 95, 10.1128/JVI.02313-20 · DOI
  20. Gorbalenya, 2002, The palm subdomain-based active site is internally permuted in viral RNA-dependent RNA polymerases of an ancient lineage, Journal of Molecular Biology, 324, 47, 10.1016/s0022-2836(02)01033-1 · DOI
  21. Gorvel, 1991, rab5 controls early endosome fusion in vitro, Cell, 64, 915, 10.1016/0092-8674(91)90316-q · DOI
  22. Johnson, 1999, Analyzing protein circular dichroism spectra for accurate secondary structures, Proteins, 35, 307, 10.1002/(SICI)1097-0134(19990515)35:3 · DOI
  23. Kairys, 2019, Binding affinity in drug design: experimental and computational techniques, Expert Opinion on Drug Discovery, 14, 755, 10.1080/17460441.2019.1623202 · DOI
  24. Kolli, 2015, Structure-function analysis of vaccinia virus h7 protein reveals a novel phosphoinositide binding fold essential for poxvirus replication, Journal of Virology, 89, 2209, 10.1128/JVI.03073-14/ASSET/F1575F5D-784E-4FD0-9DDB-A2B374935CCA/ASSETS/GRAPHIC/ZJV9990900510007.JPEG · DOI
  25. Komada, 1995, Growth factor-induced tyrosine phosphorylation of hrs, a novel 115-kilodalton protein with a structurally conserved putative zinc finger domain, Molecular and Cellular Biology, 15, 6213, 10.1128/MCB.15.11.6213 · DOI · Paper page
  26. Koonin, 2020, Global organization and proposed megataxonomy of the virus world, Microbiology and Molecular Biology Reviews, 84, 10.1128/MMBR.00061-19 · DOI
  27. Lees, 2006, A reference database for circular dichroism spectroscopy covering fold and secondary structure space, Bioinformatics, 22, 1955, 10.1093/bioinformatics/btl327 · DOI
  28. Lombardo, 1999, VP1, the putative RNA-dependent RNA polymerase of infectious bursal disease virus, forms complexes with the capsid protein VP3, leading to efficient encapsidation into virus-like particles, Journal of Virology, 73, 6973, 10.1128/JVI.73.8.6973-6983.1999 · DOI
  29. Luque, 2009, Infectious bursal disease virus is an icosahedral polyploid dsRNA virus, PNAS, 106, 2148, 10.1073/pnas.0808498106 · DOI
  30. Luque, 2009, Infectious Bursal disease virus: ribonucleoprotein complexes of a double-stranded RNA virus, Journal of Molecular Biology, 386, 891, 10.1016/j.jmb.2008.11.029 · DOI
  31. Maraver, 2003, The oligomerization domain of VP3, the scaffolding protein of infectious bursal disease virus, plays a critical role in capsid assembly, Journal of Virology, 77, 6438, 10.1128/JVI.77.11.6438-6449.2003 · DOI
  32. Marrink, 2007, The MARTINI force field: coarse grained model for biomolecular simulations, The Journal of Physical Chemistry. B, 111, 7812, 10.1021/jp071097f · DOI
  33. Matsuda, 2004, Electroporation and RNA interference in the rodent retina in vivo and in vitro, PNAS, 101, 16, 10.1073/pnas.2235688100 · DOI
  34. McNulty, 2010, Multiple phosphatidylinositol 3-kinases regulate vaccinia virus morphogenesis, PLOS ONE, 5, 10.1371/journal.pone.0010884 · DOI
  35. Miles, 2018, CDtoolX, a downloadable software package for processing and analyses of circular dichroism spectroscopic data, Protein Science, 27, 1717, 10.1002/pro.3474 · DOI
  36. Nascimbeni, 2017, Local detection of PtdIns3P at autophagosome biogenesis membrane platforms, Autophagy, 13, 1602, 10.1080/15548627.2017.1341465 · DOI
  37. Olson, 1979, Preparation of liposomes of defined size distribution by extrusion through polycarbonate membranes, Biochimica et Biophysica Acta, 557, 9, 10.1016/0005-2736(79)90085-3 · DOI
  38. Parrinello, 1981, Polymorphic transitions in single crystals: a new molecular dynamics method, Journal of Applied Physics, 52, 7182, 10.1063/1.328693 · DOI
  39. Periole, 2009, Combining an elastic network with a coarse-grained molecular force field: structure, dynamics, and intermolecular recognition, Journal of Chemical Theory and Computation, 5, 2531, 10.1021/CT9002114/SUPPL_FILE/CT9002114_SI_001.PDF · DOI
  40. Poma, 2017, Combining the MARTINI and structure-based coarse-grained approaches for the molecular dynamics studies of conformational transitions in proteins, Journal of Chemical Theory and Computation, 13, 1366, 10.1021/ACS.JCTC.6B00986/ASSET/IMAGES/LARGE/CT-2016-00986K_0005.JPEG · DOI
  41. Potgieter, 2009, Improved strategies for sequence-independent amplification and sequencing of viral double-stranded RNA genomes, The Journal of General Virology, 90, 1423, 10.1099/vir.0.009381-0 · DOI
  42. Provencher, 1981, Estimation of globular protein secondary structure from circular dichroism, Biochemistry, 20, 33, 10.1021/bi00504a006 · DOI
  43. Puffer, 1998, Equine infectious anemia virus Gag polyprotein late domain specifically recruits cellular AP-2 adapter protein complexes during virion assembly, Journal of Virology, 72, 10218, 10.1128/JVI.72.12.10218-10221.1998 · DOI
  44. Qi, 2007, An improved method for infectious bursal disease virus rescue using RNA polymerase II system, Journal of Virological Methods, 142, 81, 10.1016/j.jviromet.2007.01.021 · DOI
  45. Ramírez, 2019, Adsorption and insertion of polyarginine peptides into membrane pores: The trade-off between electrostatics, acid-base chemistry and pore formation energy, Journal of Colloid and Interface Science, 552, 701, 10.1016/j.jcis.2019.05.087 · DOI
  46. Reddy, 2005, 5 nm gold-Ni-NTA binds his tags, Microscopy and Microanalysis, 11, 1118, 10.1017/S1431927605507712 · DOI
  47. Reddy, 2022, Birnaviridae virus factories show features of liquid-liquid phase separation and are distinct from paracrystalline arrays of virions observed by electron microscopy, Journal of Virology, 96, 10.1128/jvi.02024-21 · DOI
  48. Rydzanicz, 2005, Assembly PCR oligo maker: a tool for designing oligodeoxynucleotides for constructing long DNA molecules for RNA production, Nucleic Acids Research, 33, 10.1093/nar/gki380 · DOI
  49. Saugar, 2010, Electrostatic interactions between capsid and scaffolding proteins mediate the structural polymorphism of a double-stranded RNA virus, The Journal of Biological Chemistry, 285, 3643, 10.1074/jbc.M109.075994 · DOI
  50. Schindelin, 2012, Fiji: an open-source platform for biological-image analysis, Nature Methods, 9, 676, 10.1038/nmeth.2019 · DOI · Paper page
  51. Shah, 2014, Bio-layer interferometry for measuring kinetics of protein-protein interactions and allosteric ligand effects, Journal of Visualized Experiments, 01, 10.3791/51383 · DOI
  52. Sievers, 2011, Fast, scalable generation of high-quality protein multiple sequence alignments using Clustal Omega, Molecular Systems Biology, 7, 10.1038/msb.2011.75 · DOI
  53. Simonsen, 1998, EEA1 links PI(3)K function to Rab5 regulation of endosome fusion, Nature, 394, 494, 10.1038/28879 · DOI · Paper page
  54. Sreerama, 2000, Estimation of protein secondary structure from circular dichroism spectra: comparison of CONTIN, SELCON, and CDSSTR methods with an expanded reference set, Analytical Biochemistry, 287, 252, 10.1006/abio.2000.4880 · DOI
  55. Stenmark, 1996, Endosomal localization of the autoantigen EEA1 is mediated by a zinc-binding FYVE finger, The Journal of Biological Chemistry, 271, 24048, 10.1074/jbc.271.39.24048 · DOI
  56. Tanzi, 2003, Equine infectious anemia virus utilizes host vesicular protein sorting machinery during particle release, Journal of Virology, 77, 8440, 10.1128/jvi.77.15.8440-8447.2003 · DOI
  57. Thakur, 2024, EMBL’s European Bioinformatics Institute (EMBL-EBI) in 2023, Nucleic Acids Research, 52, D10, 10.1093/nar/gkad1088 · DOI
  58. Valli, 2012, The VP3 factor from viruses of birnaviridae family suppresses rna silencing by binding both long and small rna duplexes, PLOS ONE, 7, 10.1371/journal.pone.0045957 · DOI
  59. Walker, 2021, Changes to virus taxonomy and to the international code of virus classification and nomenclature ratified by the international committee on taxonomy of viruses (2021), Archives of Virology, 166, 2633, 10.1007/s00705-021-05156-1 · DOI
  60. Wassenaar, 2015, Computational lipidomics with insane: a versatile tool for generating custom membranes for molecular simulations, Journal of Chemical Theory and Computation, 11, 2144, 10.1021/acs.jctc.5b00209 · DOI · Paper page
  61. Whitmore, 2004, DICHROWEB, an online server for protein secondary structure analyses from circular dichroism spectroscopic data, Nucleic Acids Research, 32, 10.1093/nar/gkh371 · DOI
  62. Whitmore, 2008, Protein secondary structure analyses from circular dichroism spectroscopy: methods and reference databases, Biopolymers, 89, 392, 10.1002/bip.20853 · DOI
  63. Wickham, 2016, Ggplot2: Elegant Graphics for Data Analysis, 10.1007/978-3-319-24277-4 · DOI
  64. Wills, 1991, Form, function, and use of retroviral gag proteins, AIDS, 5, 639, 10.1097/00002030-199106000-00002 · DOI · Paper page
  65. Yanai, 2006, Development of a novel Borna disease virus reverse genetics system using RNA polymerase II promoter and SV40 nuclear import signal, Microbes and Infection, 8, 1522, 10.1016/j.micinf.2006.01.010 · DOI
  66. Zhou, 2022, ggmsa: a visual exploration tool for multiple sequence alignment and associated data, Briefings in Bioinformatics, 23, 10.1093/bib/bbac222 · DOI
  67. Da Costa B, Soignier S, Chevalier C, Henry C, Thory C, Huet JC, Delmas B. 2018. Blotched snakehead virus is a new aquatic birnavirus that is slightly more related to avibirnavirus than to aquabirnavirus. NCBI Protein. https://www.ncbi.nlm.nih.gov/protein/YP_052872.1. YP_052872.1.
  68. Mohr PG, Moody NJ, Williams LM, Hoad J, Crane MS. 2018. Molecular characterization of Tasmanian aquabirnaviruses from 1998 to 2013. NCBI Protein. https://www.ncbi.nlm.nih.gov/protein/YP_009255397.1. YP_009255397.1.
  69. Blake S, Ma JY, Caporale DA, Jairath S, Nicholson BL. 2021. Phylogenetic relationships of aquatic birnaviruses based on deduced amino acid sequences of genome segment A cDNA. NCBI Protein. https://www.ncbi.nlm.nih.gov/protein/YP_010084301.1. YP_010084301.1.
  70. Suzuki S, Kimura M, Kusuda R. 2018. The complete nucleotide sequence of the polyprotein and VP5 gene of a marine birnavirus. NCBI Protein. https://www.ncbi.nlm.nih.gov/protein/NP_690805.1. NP_690805.1.
  71. Duncan R, Dobos P. 2018. The nucleotide sequence of infectious pancreatic necrosis virus (IPNV) dsRNA segment A reveals one large ORF encoding a precursor polyprotein. NCBI Protein. https://www.ncbi.nlm.nih.gov/protein/NP_047196.1. NP_047196.1.
  72. Mohr PG, Moody NJ, Williams LM, Hoad J, Crane MS. 2018. Molecular characterization of Tasmanian aquabirnaviruses from 1998 to 2013. NCBI Protein. https://www.ncbi.nlm.nih.gov/protein/YP_009177608.1. YP_009177608.1.
  73. Nobiron I, Galloux M, Henry C, Torhy C, Boudinot P, Lejal N, Da Costa B, Delmas B. 2018. Genome and polypeptides characterization of Tellina virus 1 reveals a fifth genetic cluster in the Birnaviridae family. NCBI Protein. https://www.ncbi.nlm.nih.gov/protein/YP_009509080.1. YP_009509080.
  74. Chen J, Toh X, Ong J, Wang Y, Teo X, Lee B, Wong P, Chee S, Wee D, Wang A, Ng Y, Tan BM, Khor D, Chong S. 2022. Detection and characterisation of a novel marine Birnavirus isolated from Asian Seabass in Singapore. NCBI Protein. https://www.ncbi.nlm.nih.gov/protein/YP_010086267.1. YP_010086267.1.

Metadata

Authors
Zanetti, F. A., Fernandez, I., Baquero, E., Guardado-Calvo, P., Ferrino-Iriarte, A., Dubois, S., Morel, E., Alfonso, V., Aguilera, M. O., Celayes, M. E., Polo, L. M., Suhaiman, L., Galassi, V. V., Chiarpotti, M. V., Allende-Ballestero, C., Rodriguez, J. M., Castón, J. R., Lijavetzky, D., Taboga, O., Colombo, M. I., Del Pópolo, M., Rey, F. A., & Delgui, L. R.
Affiliations
  • Consejo Nacional de Investigaciones Científicas y Técnicas (AR)
  • Institut Pasteur (FR)
  • Institut Pasteur, Université Paris Cité, Structural Virology Unit
  • Centre National de la Recherche Scientifique (FR)
  • Université Paris Cité, INSERM UMR-S1151, CNRS UMR-S8253, Institut Necker Enfants Malades
  • Instituto Interdisciplinario de Ciencias Básicas (ICB), Consejo Nacional de Investigaciones Científicas y Técnicas (CONICET)
  • Consejo Superior de Investigaciones Científicas (ES)
  • Department of Structure of Macromolecules, Centro Nacional de Biotecnología (CNB-CSIC)
  • Instituto de Histología y Embriología de Mendoza, Universidad Nacional de Cuyo (UNCuyo), Consejo Nacional de Investigaciones Científicas y Técnicas (CONICET), Centro Universitario
Corresponding author
Delgui, Laura Ruth
Venue
eLife
Published
2025-03-06
Volume
13
Pages
RP97261
ISSN
2050-084X (ISSN-L)
OpenAlex
W4395667216
Cited by
4
References
2
Citations by year
2026: 3 · 2025: 1
Type
posted content
Language
en
Open access
Locations
  • eLife (publishedVersion, cc-by)
  • PubMed Central (publishedVersion, cc-by)
  • PubMed (publishedVersion)
  • DIGITAL.CSIC (Spanish National Research Council (CSIC)) (acceptedVersion)
  • HAL (submittedVersion, cc-by)
  • DOAJ (DOAJ: Directory of Open Access Journals) (submittedVersion, cc-by-sa)
Funders
  • Ministry of Science, Technology and Innovation (PICT 2016-0528, PICT 2019-01324, PICT 2015-2210, PICT 2019-01889, PICT 2020-3795)
  • National Scientific and Technical Research Council (PIP 2015-2017 11220150100114CO, PIP 2021-2023 11220200103195CO, PIP 11220200103223CO, 2021–2023 11220200103139CO)
  • National University of Cuyo (2013-2015 M006, 2016-2018 M029, 2019-2021 M071, 2022-2024 M012, Teaching Staff Mobility Program in 2018-2019)
  • Ministry of Education (BEC.AR 2018)
  • International Union of Biochemistry and Molecular Biology (2020 Mid-Career Research Fellowship)
  • Spanish Ministry of Science and Innovation (PID2020-113287RB-I00)
  • Comunidad Autónoma de Madrid (P2018/NMT-4389)
Topics
  • Life Sciences › Biochemistry, Genetics and Molecular Biology › Cell Biology › Cellular transport and secretion
  • Life Sciences › Agricultural and Biological Sciences › Animal Science and Zoology › Animal Virus Infections Studies
  • Health Sciences › Medicine › Epidemiology › Virology and Viral Diseases
Keywords
birnavirus, VP3, phosphatidylinositol 3-phosphate, early endosomes, membrane targeting, infectious bursal disease virus, viral replication, P2 domain, double-stranded RNA virus, membrane adsorption
MeSH terms
Animals, Humans, Infectious bursal disease virus, Intracellular Membranes, Protein Binding, Endosomes, Virus Replication, Viral Structural Proteins, Phosphatidylinositol Phosphates

About these checks

Registry, retraction, Cites and statistics results are computed, not judged, with one exception: a printed reference that no index lists is read once by a model before it counts as a citation error. Claims are extracted by a model and kept only when their quote appears verbatim in the text; each cited source is then checked, with a model’s help, for whether it says what the claim relies on. Those verdicts can be wrong — read the claim’s quote and the cited source before relying on one.

Statistics and arithmetic are recomputed, not judged.

Confidence bands are shown only for fields calibrated on our annotated test set. None is calibrated yet, so no band is shown.

What counts as a claim ›How we measure confidence ›How we check this ›

Are you an author, or do you see a problem with this page? Request a review

How to cite

Cite CoChat for the checks on this page, and the paper for its own findings.

This page
CoChat. (2026). Citation check: On the role of VP3-PI3P interaction in birnavirus endosomal membrane targeting. https://app.cochat.ai/papers/10.7554/elife.97261
The paper
Zanetti, F. A., Fernandez, I., Baquero, E., Guardado-Calvo, P., Ferrino-Iriarte, A., Dubois, S., Morel, E., Alfonso, V., Aguilera, M. O., Celayes, M. E., Polo, L. M., Suhaiman, L., Galassi, V. V., Chiarpotti, M. V., Allende-Ballestero, C., Rodriguez, J. M., Castón, J. R., Lijavetzky, D., Taboga, O., . . . Delgui, L. R. (2025). On the role of VP3-PI3P interaction in birnavirus endosomal membrane targeting. eLife. https://doi.org/10.7554/elife.97261