

Microengineered Multi‐Organoid System from hiPSCs to Recapitulate Human Liver‐Islet Axis in Normal and Type 2 Diabetes
Open accessThe DOI matches its Crossref record; 63 of the 65 references it cites were found in a registry or an index.
Abstract
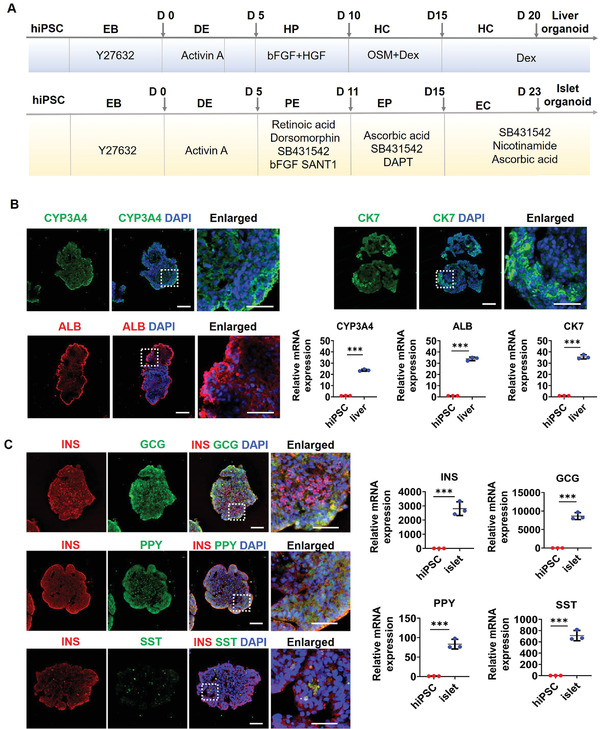
Type 2 diabetes mellitus (T2DM) is a systematic multi‐organ metabolic disease, which is characterized by the dynamic interplay among different organs. The increasing incidence of T2DM reflects an urgent need for the development of in vitro human‐relevant models for disease study and drug therapy. Here, a new microfluidic multi‐organoid system is developed that recapitulates the human liver‐pancreatic islet axis in normal and disease states. The system contains two compartmentalized regions connected by a microchannel network, enabling 3D co‐culture of human induced pluripotent stem cells (hiPSC)‐derived liver and islet organoids for up to 30 days under circulatory perfusion conditions. The co‐cultured liver and islet organoids exhibit favorable growth and improved tissue‐specific functions. Transcriptional analyses reveal the activation of metabolically relevant signaling pathways in the co‐cultured organoids. Notably, the co‐culture system facilitates sensitive glucose‐stimulated insulin secretion from islet organoids and increased glucose utilization in liver organoids by glucose tolerance tests. Both liver and islet organoids display mitochondrial dysfunction and decreased glucose transport capacity under high glucose conditions, which can be alleviated by metformin treatment. This novel multi‐organoid system can recapitulate human‐relevant liver‐islet axis under both physiological and pathological conditions, providing a unique platform for future T2DM research and drug development.
Overview
The claims and statistics of this paper haven’t been checked yet.
Free: it reads the open-access text and checks the first 5 claims that cite a source we can check. Create a free account to check every claim.
Integrity signals
Registry
Cites
Statistics
Figures



Verification
Claims the paper makes
The claims and statistics of this paper haven’t been checked yet.
Free: it reads the open-access text and checks the first 5 claims that cite a source we can check. Create a free account to check every claim.
Claims other papers make about this one
Each is checked against this paper’s own text: does it say what the citing paper says it does?
The cited source says what the claim attributes to it.
In the citing paper
“Tao et al. interfaced hiPSC-derived hepatic and pancreatic islet organoids within a unified microfluidic framework, faithfully reconstructing the human liver-islet axis under both euglycaemic and type-2-diabetic conditions.”
From Constructing biomimetic microenvironments for liver regeneration (2025) · doi:10.1186/s12951-025-03729-9 · cites this paper as [220]
In the citing paper
“This platform captures the synergistic regulation of glucose metabolism and pharmacological responses across organs, offering a powerful paradigm for interrogating multi-organ pathophysiology [220, 221].”
From Constructing biomimetic microenvironments for liver regeneration (2025) · doi:10.1186/s12951-025-03729-9 · cites this paper as [220]
Self-check
Percentages, sums and reported differences re-computed from the paper’s own numbers.
The self-check needs the paper’s full text.
Citations
Cites
Single-step method of RNA isolation by acid guanidinium thiocyanate-phenol-chloroform extraction
Chomczynski, P., & Sacchi, N. (1987) · Analytical Biochemistry · doi:10.1016/0003-2697(87)90021-2 · Cited by 46,426
Eckel, R. H., Alberti, K., Grundy, S. M., & Zimmet, P. Z. (2010) · The Lancet · doi:10.1016/s0140-6736(09)61794-3 · Cited by 6,295
Global aetiology and epidemiology of type 2 diabetes mellitus and its complications
Zheng, Y., Ley, S. H., & Hu, F. B. (2018) · Nature Reviews Endocrinology · doi:10.1038/nrendo.2017.151 · Cited by 5,697
Eckel, R. H., Grundy, S. M., & Zimmet, P. Z. (2005) · The Lancet · doi:10.1016/s0140-6736(05)66378-7 · Cited by 5,550
Type 2 diabetes: principles of pathogenesis and therapy
Stumvoll, M., Goldstein, B. J., & van Haeften, T. W. (2005) · The Lancet · doi:10.1016/s0140-6736(05)61032-x · Cited by 2,662
Serum retinol binding protein 4 contributes to insulin resistance in obesity and type 2 diabetes
Yang, Q., Graham, T. E., Mody, N., Preitner, F., Peroni, O. D., Zabolotny, J. M., Kotani, K., Quadro, L., & Kahn, B. B. (2005) · Nature · doi:10.1038/nature03711 · Cited by 2,086
Mitochondrial dysfunction and type 2 diabetes
Lowell, B. B., & Shulman, G. I. (2005) · Science · doi:10.1126/science.1104343 · Cited by 2,070
Generation of Functional Human Pancreatic β Cells In Vitro
Pagliuca, F. W., Millman, J. R., Gürtler, M., Segel, M., Van Dervort, A., Ryu, J. H., Peterson, Q. P., Greiner, D., & Melton, D. A. (2014) · Cell · doi:10.1016/j.cell.2014.09.040 · Cited by 2,025
Modeling physiological events in 2D vs. 3D cell culture
Duval, K., Grover, H., Han, L.-H., Mou, Y., Pegoraro, A. F., Fredberg, J., & Chen, Z. (2017) · Physiology · doi:10.1152/physiol.00036.2016 · Cited by 1,849
Metformin—mode of action and clinical implications for diabetes and cancer
Pernicova, I., & Korbonits, M. (2014) · Nature Reviews Endocrinology · doi:10.1038/nrendo.2013.256 · Cited by 1,349
Research works printed but not linked: 2
- 10.1038/s41574-018-0132-z · DOI
- Phillips P. J., 2012, Aust. Fam. Physician, 41, 391
Cited by
Human organs-on-chips for disease modelling, drug development and personalized medicine
Ingber, D. E. (2022) · Nature Reviews Genetics · doi:10.1038/s41576-022-00466-9 · Cited by 1,589
A guide to the organ-on-a-chip
Leung, C. M., de Haan, P., Ronaldson-Bouchard, K., Kim, G.-A., Ko, J., Rho, H. S., Chen, Z., Habibovic, P., Jeon, N. L., Takayama, S., et al. (2022) · Nature Reviews Methods Primers · doi:10.1038/s43586-022-00118-6 · Cited by 1,116
Organ-on-a-chip meets artificial intelligence in drug evaluation
Deng, S., Li, C., Cao, J., Cui, Z., Du, J., Fu, Z., Yang, H., & Chen, P. (2023) · Theranostics · doi:10.7150/thno.87266 · Cited by 260
“permission from [183], copyright 2022 Wiley.”
BackgroundMethodInfluentialIntegrating organoids and organ-on-a-chip devices
Zhao, Y., Landau, S., Okhovatian, S., Liu, C., Lu, R. X. Z., Lai, B. F. L., Wu, Q., Kieda, J., Cheung, K., Rajasekar, S., et al. (2024) · Nature Reviews Bioengineering · doi:10.1038/s44222-024-00207-z · Cited by 185
“Tissue aggregates have also been cultured in perfusable microenvironments to study inter-organ crosstalk, including islet–liver 86 , liver–intestine–stomach 87 , liver–lung 88 , liver–”
Human organoids-on-chips for biomedical research and applications
Wang, H., Ning, X., Zhao, F. H., Zhao, H., & Li, D. (2024) · Theranostics · doi:10.7150/thno.90492 · Cited by 157
“Up to now, many parts of the human body have been reproduced with OOCs, such as the brain, lung, gut, liver, kidney, islet, heart and cartilage [10, 11, 13, 69-80].”
BackgroundMethodInfluentialPapamichail, L., Koch, L. S., Veerman, D., Broersen, K., & van der Meer, A. D. (2025) · Frontiers in Bioengineering and Biotechnology · doi:10.3389/fbioe.2025.1515340 · Cited by 120
Wang, Q., Yuan, F., Zuo, X., & Li, M. (2025) · Cell Death Discovery · doi:10.1038/s41420-025-02505-w · Cited by 117
Towards a better understanding of diabetes mellitus using organoid models
Beydag-Tasöz, B. S., Yennek, S., & Grapin‐Botton, A. (2023) · Nature Reviews Endocrinology · doi:10.1038/s41574-022-00797-x · Cited by 95
Applications of human organoids in the personalized treatment for digestive diseases
Wang, Q., Guo, F., Jin, Y., & Ma, Y. (2022) · Signal Transduction and Targeted Therapy · doi:10.1038/s41392-022-01194-6 · Cited by 78
“With the help of a microfluidic system consisting of two separated regions connected by a microchannel network, coculture systems can be established between liver and pancreas organoids derived from human iPSCs, recapitulating the physiological and pathological conditions of the human liver-islet axis and facilitating…”
BackgroundRoadblocks confronting widespread dissemination and deployment of Organs on Chips
Alver, C. G., Drabbe, E., Ishahak, M., & Agarwal, A. (2024) · Nature Communications · doi:10.1038/s41467-024-48864-3 · Cited by 74
Type 1 Diabetes Mellitus: A Review on Advances and Challenges in Creating Insulin Producing Devices
Oliveira, S. M. R., Rebocho, A., Ahmadpour, E., Nissapatorn, V., & Pereira, M. D. L. (2023) · Micromachines · doi:10.3390/mi14010151 · Cited by 102
Application of new approach methodologies for nonclinical safety assessment of drug candidates
Beilmann, M., Adkins, K., Boonen, H. C. M., Hewitt, P. G., Hu, W., Mader, R., Moore, S., Rana, P., Steger‐Hartmann, T., Villenave, R., et al. (2025) · Nature Reviews Drug Discovery · doi:10.1038/s41573-025-01182-9 · Cited by 85
Advances in Microfluidic Technologies in Organoid Research
Liu, H., Gan, Z., Qin, X., Wang, Y., & Qin, J. (2023) · Advanced Healthcare Materials · doi:10.1002/adhm.202302686 · Cited by 74
Self-citationYang, H., Yang, S., He, J., Li, W., Zhang, A., Li, N., Zhou, G., & Sun, B. (2023) · Cancer Cell International · doi:10.1186/s12935-023-03162-8 · Cited by 77
“Of the 14 GLUTs known in humans, GLUT1, GLUT2, GLUT3, and GLUT4 are responsible for transporting glucose to different tissues in the body [10].”
BackgroundAI-Powered Microfluidics: Shaping the Future of Phenotypic Drug Discovery
Liu, J., Du, H., Huang, L., Xie, W., Liu, K., Zhang, X., Chen, S., Zhang, Y., Li, D., & Pan, H. (2024) · ACS Applied Materials & Interfaces · doi:10.1021/acsami.4c07665 · Cited by 75
Self-citationStrategies to overcome the limitations of current organoid technology - engineered organoids
Fan, X., Hou, K., Liu, G., Shi, R., Wang, W., & Liang, G. (2025) · Journal of Tissue Engineering · doi:10.1177/20417314251319475 · Cited by 77
“14 However, no organoid has yet been successfully built that can completely replicate the full function of the corresponding organ.”
Advances in human organoids-on-chips in biomedical research
Wang, Y., & Qin, J. (2023) · Life Medicine · doi:10.1093/lifemedi/lnad007 · Cited by 61
Self-citationAdvancing Organoid Engineering for Tissue Regeneration and Biofunctional Reconstruction
Jin, H., Xue, Z., Liu, J., Ma, B., Yang, J., & Lei, L. (2024) · Biomaterials Research · doi:10.34133/bmr.0016 · Cited by 60
“A novel microfluidic multiorgan system generalizing the human hepatopancreatic islet axis has been previously investigated [261].”
BackgroundShafagh, R. Z., Youhanna, S. C., Keulen, J., Shen, J. X., Taebnia, N., Preiss, L. C., Klein, K., Büttner, F., Bergqvist, M., van der Wijngaart, W., et al. (2022) · Advanced Science · doi:10.1002/advs.202203368 · Cited by 60
Che, H., Gao, Y., Xu, Y., Xu, H., Eils, R., & Tian, M. (2026) · Signal Transduction and Targeted Therapy · doi:10.1038/s41392-025-02329-1 · Cited by 64
From organoids to organoids-on-a-chip: Current applications and challenges in biomedical research
Liu, K., Chen, X., Fan, Z., Ren, F., Liu, J., & Hu, B. (2025) · Chinese Medical Journal · doi:10.1097/cm9.0000000000003535 · Cited by 60
Fanizza, F., Campanile, M., Forloni, G., Giordano, C., & Albani, D. (2022) · Journal of Tissue Engineering · doi:10.1177/20417314221095339 · Cited by 58
Global Literature Analysis of Organoid and Organ‐on‐Chip Research
Shoji, J., Davis, R. P., Mummery, C. L., & Krauss, S. J. K. (2023) · Advanced Healthcare Materials · doi:10.1002/adhm.202301067 · Cited by 54
Organoids‐On‐a‐Chip for Personalized Precision Medicine
Man, Y., Liu, Y., Chen, Q., Zhang, Z., Li, M., Xu, L., Tan, Y., & Liu, Z. (2024) · Advanced Healthcare Materials · doi:10.1002/adhm.202401843 · Cited by 58
Pancreatic islet organoids-on-a-chip: how far have we gone?
Yin, J., Meng, H., Lin, J., Ji, W., Xu, T., & Liu, H. (2022) · Journal of Nanobiotechnology · doi:10.1186/s12951-022-01518-2 · Cited by 49
“In summary, most commonly used co-culture system to study the impact of organ crosstalk in type 2 DM including duct- and pancreatic islets-on-achip [63], liver- and pancreatic islets-on-a-chip [67, 68].”
BackgroundKim, H. J., Kim, G., Chi, K. Y., Kim, H., Jang, Y. J., Jo, S., Lee, J., Lee, Y., Woo, D., Han, C., et al. (2023) · Stem Cell Research & Therapy · doi:10.1186/s13287-023-03235-5 · Cited by 51
Long, C., Zhou, X., Xia, F., & Zhou, B. (2024) · Biology · doi:10.3390/biology13040243 · Cited by 60
“In a similar vein, through the application of microfluidic chip technology, researchers have designed a microfluidic multi-class organ system to investigate human liver–islet axis insulin and glucose regulation in normal and diseased conditions [103].”
BackgroundHarnessing the power of artificial intelligence for human living organoid research
Wang, H., Li, X., You, X., & Zhao, G. (2024) · Bioactive Materials · doi:10.1016/j.bioactmat.2024.08.027 · Cited by 64
“With the deepening of research on organoids-on-chip technology, a more superior alternative model can be constructed by using its unique properties, which provides a practical solution to many problems faced by disease modeling and drug evaluation [90].”
BackgroundLiu, Y., Kang, W., Liu, S., Li, J., Liu, J., Chen, X., Gan, F., & Huang, K. (2022) · The Science of The Total Environment · doi:10.1016/j.scitotenv.2022.157861 · Cited by 46
Generation of innervated cochlear organoid recapitulates early development of auditory unit
Xia, M., Ma, J., Wu, M., Guo, L., Chen, Y., Li, G., Sun, S., Chai, R., Li, H., & Li, W. (2022) · Stem Cell Reports · doi:10.1016/j.stemcr.2022.11.024 · Cited by 49
3D multicellular systems in disease modelling: From organoids to organ-on-chip
Goldrick, C., Guri, I., Herrera-Oropeza, G. E., O’Brien-Gore, C., Roy, E., Wojtynska, M., & Spagnoli, F. M. (2023) · Frontiers in Cell and Developmental Biology · doi:10.3389/fcell.2023.1083175 · Cited by 47
“, 2021), as well as diabetes mellitus (Xu et al., 2008; Iori et al., 2012; Nguyen et al., 2017; Nikolaev et al., 2020; Tao et al., 2022) and obesity (Viravaidya and Shuler, 2008; Xu et al.”
BackgroundIn vitro functional models for human liver diseases and drug screening: beyond animal testing
Paradiso, A., Volpi, M., Rinoldi, C., Celikkin, N., Contessi Negrini, N., Bilgen, M., Dallera, G., Pierini, F., Costantini, M., Święszkowski, W., et al. (2023) · Biomaterials Science · doi:10.1039/d1bm01872h · Cited by 40
Biomimetic lung-on-a-chip to model virus infection and drug evaluation
Tan, J., Guo, Q., Tian, L., Pei, Z., Li, D., Wu, M., Zhang, J., & Gao, X. (2022) · European Journal of Pharmaceutical Sciences · doi:10.1016/j.ejps.2022.106329 · Cited by 44
Engineered hydrogel microspheres for spheroids and organoids construction
Gai, T., Zhang, Y., Li, G., Zhou, F., He, C., Wang, X., & Su, J. (2024) · Chemical Engineering Journal · doi:10.1016/j.cej.2024.155131 · Cited by 43
Hydrogel-Encapsulated Pancreatic Islet Cells as a Promising Strategy for Diabetic Cell Therapy
Huan, Z., Li, J., Luo, Z., Yu, Y., & Li, L. (2024) · Research · doi:10.34133/research.0403 · Cited by 47
“Many groups have successfully induced SC-islets with multicellular components by administering various types of growth factors and transcription factors to stem cells, which have been applied to islet transplantation, organoid chips, and other fields [58–60].”
BackgroundJuguilon, C., Khosravi, R., Radisic, M., & Wu, J. C. (2025) · Circulation Research · doi:10.1161/circresaha.125.325497 · Cited by 47
Wu, Y., Zhou, Y., Paul, R., Qin, X., Islam, K., & Liu, Y. (2022) · Analytical Chemistry · doi:10.1021/acs.analchem.2c02556 · Cited by 39
Zhu, Y., Jiang, D., Qiu, Y. L., Liu, X., Bian, Y., Tian, S., Wang, X., Hsia, K. J., Wan, H., Zhuang, L., et al. (2024) · Bioactive Materials · doi:10.1016/j.bioactmat.2024.05.019 · Cited by 53
“Besides, multi-organ microphysiological systems are established to mimic inter-organ communication and systemic diseases [36 – 38].”
BackgroundEffects of Metformin Delivery via Biomaterials on Bone and Dental Tissue Engineering
Zhu, M., Zhao, Z., Xu, H. H. K., Dai, Z., Yu, K., Xiao, L., Schneider, A., Weir, M. D., Oates, T. W., Bai, Y., et al. (2022) · International Journal of Molecular Sciences · doi:10.3390/ijms232415905 · Cited by 34
Hydrogel Microspheres Empowering Organ‐on‐a‐Chip Systems: Innovations and Applications
Liu, J., Du, C., Chen, J., Tang, B., Liu, S., Tan, J., Luo, X., Zhan, J., Liu, J., Chen, Z., et al. (2025) · Small · doi:10.1002/smll.202504563 · Cited by 44
Aizenshtadt, A., Wang, C., Abadpour, S., Menezes, P. D., Wilhelmsen, I., Dalmao‐Fernández, A., Stokowiec, J., Golovin, A., Johnsen, M., Combriat, T. M. D., et al. (2024) · Advanced Healthcare Materials · doi:10.1002/adhm.202303785 · Cited by 39
Engineering organoids-on-chips for drug testing and evaluation
Wang, H., Zhu, W., Xu, C., Su, W., & Li, Z. (2024) · Metabolism · doi:10.1016/j.metabol.2024.156065 · Cited by 32
Yang, J., Zhang, X., Liu, Z., Yang, C., Li, S., Zhou, H., & Gao, Z. (2024) · Chemical Engineering Journal · doi:10.1016/j.cej.2024.155882 · Cited by 30
Self-citationDeveloping Liver Microphysiological Systems for Biomedical Applications
Wang, J., Wu, X., Zhao, J., Ren, H., & Zhao, Y. (2024) · Advanced Healthcare Materials · doi:10.1002/adhm.202302217 · Cited by 27
Schlünder, K., Cipriano, M., Zbinden, A., Fuchs, S., Mayr, T., Schenke‐Layland, K., & Loskill, P. (2024) · Lab on a Chip · doi:10.1039/d3lc00838j · Cited by 34
Ma, W., Zheng, Y., Yang, G.-Z., Zhang, H., Lu, M., Ma, H., Wu, C., & Lu, H. (2024) · Materials Horizons · doi:10.1039/d4mh00228h · Cited by 30
Engineered Human Organoids for Biomedical Applications
Zhu, Y., Sun, L., Wu, X., Gu, Z., & Zhao, Y. (2023) · Advanced Functional Materials · doi:10.1002/adfm.202310961 · Cited by 32
Advances in application and innovation of microfluidic platforms for pharmaceutical analysis
Ma, L., Li, N., Wang, J., Ma, C., Hu, X., Li, M., & Wu, Z. (2023) · TrAC Trends in Analytical Chemistry · doi:10.1016/j.trac.2023.116951 · Cited by 27
Liver organoids: updates on generation strategies and biomedical applications
Liu, S., Cheng, C., Zhu, L., Zhao, T., Wang, Z., Yi, X., Yan, F., Wang, X., Li, C., Cui, T., et al. (2024) · Stem Cell Research & Therapy · doi:10.1186/s13287-024-03865-3 · Cited by 33
Ni, B., Ye, L., Zhang, Y., Hu, S., & Lei, W. (2025) · Journal of Translational Medicine · doi:10.1186/s12967-025-06381-x · Cited by 27
“However, the cellular interaction network of multilineage organoids is not sufficient to form complex tissue microenvironments and lacks the required spatial organization [48, 49].”
Artificial Intelligence for Organoids Multidimensional Assessment
Mo, Y., Wang, J., Yang, H., Bai, L., Xu, K., & Su, J. (2025) · SmartMat · doi:10.1002/smm2.70016 · Cited by 29
“N ‐ acetylcysteine, B27 supplement, N2 supplement, GlutaMAX, and non ‐ essential amino acids [49] Liver/heart/skeletal muscle α ‐ MEM with FBS and L ‐ glutamine [80] Liver/heart/skeletal muscle/ neuron Serum ‐ free medium supplemented with growth factors [81] Intestine/liver/kidney proximal…”
The Potential Clinical Use of Stem/Progenitor Cells and Organoids in Liver Diseases
Nikokiraki, C., Psaraki, A., & Roubelakis, M. G. (2022) · Cells · doi:10.3390/cells11091410 · Cited by 32
Paola, F. J. D., Calafato, G., Piccaluga, P. P., Tallini, G., & Rhoden, K. J. (2025) · Journal of Personalized Medicine · doi:10.3390/jpm15080394 · Cited by 27
“A liver-islet organoid-on-a-chip system has also been established to study diabetes melli-J tus, recapitulating the features of type 2 diabetes, and allowing the testing of therapeutic effects of drugs such as metformin [131].”
Modelling fatty liver disease with mouse liver-derived multicellular spheroids
van Os, E. A., Cools, L., Eysackers, N., Szafranska, K., Smout, A., Verhulst, S., Reynaert, H., McCourt, P., Mannaerts, I., & van Grunsven, L. A. (2022) · Biomaterials · doi:10.1016/j.biomaterials.2022.121817 · Cited by 24
Zhao, K.-Y., Du, Y., Cao, H., Su, L., Su, X., & Li, X. (2024) · Colloids and Surfaces B Biointerfaces · doi:10.1016/j.colsurfb.2024.114435 · Cited by 31
Human Organoids and Their Application in Tumor Models, Disease Modeling, and Tissue Engineering
Song, S., Liu, Z., Wang, Y., & Gong, B. (2025) · Medicine Bulletin · doi:10.1002/mdb2.70001 · Cited by 32
Self-citationApplication Prospect of Induced Pluripotent Stem Cells in Organoids and Cell Therapy
Zhang, T., Qian, C., Song, M., Tang, Y., Zhou, Y., Dong, G., Shen, Q., Chen, W., Wang, A., Shen, S., et al. (2024) · International Journal of Molecular Sciences · doi:10.3390/ijms25052680 · Cited by 27
Self-citationGenetically modified organoids for tissue engineering and regenerative medicine
Zhang, Q., Jin, H., Zhu, D., Chen, Y., Fu, M., Lu, S., Qiu, Y., Zhou, G., Yang, G., & Jiang, Z. (2024) · Advances in Colloid and Interface Science · doi:10.1016/j.cis.2024.103337 · Cited by 26
Han, D., Xu, K., Jin, Z., Xu, Y., Li, Y., Wang, L., Cao, Q., Kim, K.-P., Ryu, D. H., Hong, K., et al. (2023) · International Journal of Biological Sciences · doi:10.7150/ijbs.85145 · Cited by 24
“Indeed, a recent study has successfully demonstrated the recapitulation of human liver-pancreatic islet axis using a microfluidic multi-organoid system (132).”
Yang, H., Li, J., Wang, Z., Khutsishvili, D., Tang, J., Zhu, Y., Cai, Y., Dai, X., & Ma, S. (2024) · Life Medicine · doi:10.1093/lifemedi/lnae016 · Cited by 28
“Additionally, they modeled type 2 diabetes mellitus (T2DM) by subjecting this system to high glucose levels, observing mitochondrial dysfunction and impaired glucose transport in both liver and islet organoids [59].”
Organoids in concert: engineering in vitro models toward enhanced fidelity
Chen, Z., Sugimura, R., Zhang, Y. S., Ruan, C., & Wen, C. (2024) · Aggregate · doi:10.1002/agt2.478 · Cited by 24
The progress of pluripotent stem cell-derived pancreatic β-cells regeneration for diabetic therapy
Wang, X., Gao, M., Wang, Y., & Zhang, Y. (2022) · Frontiers in Endocrinology · doi:10.3389/fendo.2022.927324 · Cited by 25
“This new system provides a source for the research and therapy of T2DM (77).”
BackgroundSelf-citationModeling human liver organ development and diseases with pluripotent stem cell-derived organoids
Ouchi, R., & Koike, H. (2023) · Frontiers in Cell and Developmental Biology · doi:10.3389/fcell.2023.1133534 · Cited by 18
Using Liver Organoids as Models to Study the Pathobiology of Rare Liver Diseases
Obeid, D. A., Mir, T. A., Alzhrani, A., Altuhami, A., Shamma, T., Ahmed, S. G., Kazmi, S., Fujitsuka, I., Ikhlaq, M., Mir, M. S., et al. (2024) · Biomedicines · doi:10.3390/biomedicines12020446 · Cited by 20
“Following the successful optimization of organoid culture technology, some progress has been made over the past five years in modeling liver-specific rare genetic diseases using the organoid platform [76–89].”
BackgroundMethodLiver organoids: From fabrication to application in liver diseases
Liu, Q., Zeng, A., Liu, Z., Wu, C., & Song, L. (2022) · Frontiers in Physiology · doi:10.3389/fphys.2022.956244 · Cited by 19
“, 2021) and body on chip (Tao et al., 2021), a collection of multiple organoids.”
BackgroundRigal, S., Casas, B., Kanebratt, K. P., Huldt, C. W., Magnusson, L. U., Müllers, E., Karlsson, F. H., Clausen, M., Hansson, S., Leonard, L., et al. (2024) · Communications Biology · doi:10.1038/s42003-024-06514-w · Cited by 24
Engineering human immune organoids for translational immunology
Suhito, I. R., Sunil, C., & Tay, A. K. P. (2024) · Bioactive Materials · doi:10.1016/j.bioactmat.2024.10.010 · Cited by 39
“…technology has been pushed forward in the past few years to improve the understanding of human disease mechanisms and drug efficacy by a multi-organoid-on-a-chip model, e.g., liver-heart organoids-on-a-chip [158], liver-pancreatic islet organoids-on-a-chip [159], and body-on-a-chip system [160].”
BackgroundEmerging biotechnologies for engineering liver organoids
Zhao, J., Zhi, Y., Ren, H., Wang, J., & Zhao, Y. (2024) · Bioactive Materials · doi:10.1016/j.bioactmat.2024.11.002 · Cited by 34
Gao, Z., Du, Z., Hou, Y., Hua, K., Tu, P., Ai, X., & Jiang, Y. (2024) · Acta Pharmaceutica Sinica B · doi:10.1016/j.apsb.2024.11.004 · Cited by 20
Establishment of advanced tumor organoids with emerging innovative technologies
Mao, Y., & Hu, H. (2024) · Cancer Letters · doi:10.1016/j.canlet.2024.217122 · Cited by 20
Skeletal muscle, neuromuscular organoids and assembloids: a scoping review
Yang, J.-L., Qian, S.-Y., Chen, M.-L., Wang, L., Wang, Y., Liu, J., Xi, C., Yang, Y., Li, Y., Gao, C., et al. (2025) · EBioMedicine · doi:10.1016/j.ebiom.2025.105825 · Cited by 21
Self-citationYu, P., Liu, B., Dong, C., & Chang, Y. (2025) · Cells · doi:10.3390/cells14080619 · Cited by 20
“In particular, using a 3D culture of human iPSC-CMs as engineered heart tissue activated multiple pathways associated with diabetic cardiomyopathy, including metabolic remodeling, mitochondrial dysfunction, extracellular matrix remodeling, and increased endoplasmic reticulum stress [230].”
InfluentialImportance of multiple endocrine cell types in islet organoids for type 1 diabetes treatment
Heaton, E. S., & Jin, S. (2022) · Translational research · doi:10.1016/j.trsl.2022.06.014 · Cited by 16
Sun, S., Xue, X., & Fu, J. (2023) · Current Opinion in Genetics & Development · doi:10.1016/j.gde.2023.102097 · Cited by 15
Emerging approaches for the development of artificial islets
Li, J., Sun, L., Bian, F.-K., Pandol, S., & Li, L. (2024) · Smart Medicine · doi:10.1002/smmd.20230042 · Cited by 10
Recent progress in modeling and treating diabetes using stem cell-derived islets
Maestas, M. M., Bui, M. H., & Millman, J. R. (2024) · Stem Cells Translational Medicine · doi:10.1093/stcltm/szae059 · Cited by 17
Complex or not too complex? One size does not fit all in next generation microphysiological systems
Bersini, S., Arrigoni, C., Talò, G., Candrian, C., & Moretti, M. (2024) · iScience · doi:10.1016/j.isci.2024.109199 · Cited by 14
Progress, application and challenges of liver organoids
Sang, C., Lin, J., Ji, S., & Gao, Q. (2024) · Clinical Cancer Bulletin · doi:10.1007/s44272-024-00012-0 · Cited by 15
“Both ESCs and iPSCs can be induced to differentiate into various liver organoid types [10, 53].”
Multiscale Construction, Evaluation, and Application of Organoids
Ma, W., Dong, Z., Zheng, Z., Bai, L., Zhang, X., & Su, J. (2025) · Advanced Science · doi:10.1002/advs.202508534 · Cited by 19
Self-citationAleman, J., Ravikumar, K., Wiegand, C., Schurdak, M. E., Vernetti, L. A., Gavlock, D. C., Reese, C. E., DeBiasio, R., LaRocca, G., Angarita, Y. D., et al. (2024) · Communications Biology · doi:10.1038/s42003-024-07006-7 · Cited by 14
Constructing biomimetic microenvironments for liver regeneration
(2025) · doi:10.1186/s12951-025-03729-9 · Cited by 11
“This platform captures the synergistic regulation of glucose metabolism and pharmacological responses across organs, offering a powerful paradigm for interrogating multi-organ pathophysiology [220, 221].”
From organ to system: multiorgan-on-a-chip platforms as next-generation biomedical simulators
Chen, C., Zhou, L., Kou, N., Li, X., Mao, H., & Liu, H. (2025) · Biofabrication · doi:10.1088/1758-5090/ae0dba · Cited by 11
Integrating allostasis and emerging technologies to study complex diseases
Park, I., Gwon, H., Jung, Y., Kim, B.-Y., Ju, G., Sin, E., An, H. I., Bang, H. J., Yun, T., Lee, S. H., et al. (2025) · Communications Biology · doi:10.1038/s42003-025-08939-3 · Cited by 14
“For instance, Tao et al. developed an iPSC-derived liver-islet multi organ model that recapitulates hyperglycemia-induced metabolic dysfunction and showed that metformin treatment partially restored these phenotypes 77 .”
Wan, Y., Ding, J., Jia, Z., Hong, Y., Tian, G., Zheng, S., Pan, P., Wang, J., & Liang, H. (2024) · Heliyon · doi:10.1016/j.heliyon.2024.e32965 · Cited by 13
“…small molecules and growth factors, such as extracellular matrix, fibroblast growth factor (FGF), Wnt, Noggin, etc., are also essential [40 – 42], and through techniques such as 3 d cultures, tissue engineering and microfluidics, cultures can brain organoids, intestinal organoids,…”
BackgroundNovel organoids mode evaluating the food nutrition and safety: Current state and future prospects
Tan, F., Cui, P., Li, S., Tan, Y., & Ma, A. (2024) · Food Frontiers · doi:10.1002/fft2.451 · Cited by 11
Microfluidic Techniques for Next‐Generation Organoid Systems
Gong, J., Li, M., Kang, J., Yin, Z., Cha, Z., Yang, J., & Xu, H. (2022) · Advanced Materials Interfaces · doi:10.1002/admi.202200846 · Cited by 17
Standard: human liver-on-a-chip
Liu, H., Zhang, X., Wang, Y., Zhang, M., Wang, P., Shang, J., Li, Z., Gong, L., Xie, X., Liu, D., et al. (2025) · Cell Regeneration · doi:10.1186/s13619-025-00226-0 · Cited by 12
Self-citationHypoxia and Multilineage Communication in 3D Organoids for Human Disease Modeling
Ehab, S., Gaser, O. A., & Dayem, A. A. (2025) · Biomimetics · doi:10.3390/biomimetics10090624 · Cited by 13
“Nonetheless, current multilineage organoids still fall short in establishing intricate cellular interaction networks and often lack the spatial organization necessary for recreating true tissue microenvironments [243,244].”
Advances and Challenges in Cerebral Organoids Research
Luo, D., Xu, J., Liu, F., & Gu, Z. (2024) · Advanced NanoBiomed Research · doi:10.1002/anbr.202300126 · Cited by 11
Application and challenge of pancreatic organoids in therapeutic research
Chen, J., Lu, J., Wang, S., & Miao, C. (2024) · Frontiers in Pharmacology · doi:10.3389/fphar.2024.1366417 · Cited by 14
“The majority of co-culture methodologies for examining T2DM treatment encompass duct-and pancreatic islets-on-a-chip, as well as liver-and pancreatic islets-on-a-chip (Bauer et al., 2017; Shik Mun et al., 2019; Tao et al., 2022).”
BackgroundDevelopment and Applications of Organoids in Gynecological Diseases
Yang, J., Li, W., Zhang, Z., Xu, Z., Zhu, W., Wang, J., & Wang, W. (2024) · Stem Cell Reviews and Reports · doi:10.1007/s12015-024-10833-0 · Cited by 10
“Tao et al. [77] constructed a hepato-islet organoid model derived from hiPSCs using organoids-on-a-chip technology to simulate liver-islet interactions in carbohydrate metabolism.”
A microfluidic twin islets-on-chip device for on-line electrophysiological monitoring
Lallouet, M., Olçomendy, L., Gaitan, J., Montiège, K., Monchablon, M., Pirog, A., Chapeau, D., Puginier, E., Renaud, S., Raoux, M., et al. (2025) · Lab on a Chip · doi:10.1039/d4lc00967c · Cited by 9
Organ mimicking technologies and their applications in drug discovery
Qu, Y., Ye, J., Lin, B., Luo, Y., & Zhang, X. (2023) · Intelligent Pharmacy · doi:10.1016/j.ipha.2023.05.003 · Cited by 14
Self-citationHuangfu, Y., Wang, J., Feng, J., & Zhang, Z. (2023) · Lab on a Chip · doi:10.1039/d3lc00616f · Cited by 10
The applications and techniques of organoids in head and neck cancer therapy
Hao, Q., Tan, X., Zhang, W., Zhou, Y., Chen, S., Zha, D., Wang, S., & Wen, J. (2023) · Frontiers in Oncology · doi:10.3389/fonc.2023.1191614 · Cited by 11
“This microfluidic technique has been used to successfully culture up to two types of organoids(liver and islet) and detect metabolismrelated pathway activity (84).”
MethodClassical and Innovative Evidence for Therapeutic Strategies in Retinal Dysfunctions
Caruso, L., Fields, M., Rimondi, E., Zauli, G., Longo, G., Marcuzzi, A., Previati, M., Gonelli, A., Zauli, E., & Milani, D. (2024) · International Journal of Molecular Sciences · doi:10.3390/ijms25042124 · Cited by 9
“Multi-organ organoids are formed by cells from two or more organs and simulate the physiological interaction between them [209–212].”
BackgroundOrganoids-on-Chips Technology: Unveiling New Perspectives in Rare-Disease Research
Li, X., Wang, H., You, X., & Zhao, G. (2025) · International Journal of Molecular Sciences · doi:10.3390/ijms26094367 · Cited by 16
“In the coming years, they will likely enable unprecedented drug screening and personalized treatment efforts that may help revolutionize the rare-disease research space.”
Gong, Y., Tian, X., Ma, X., Jin, X., Ji, Z., Gao, X., Chen, Z., Hu, F., Yin, D., Li, F., et al. (2025) · Journal of Ethnopharmacology · doi:10.1016/j.jep.2025.120020 · Cited by 9
Direct Differentiation of Human Adult Adipose Tissue into Multilineage Functional Organoids
Huang, R., Yang, J., Yan, Y., Liu, X., Yin, X., Liu, C., Liu, X., Aimaier, R., Ji, Q., Li, G., et al. (2025) · Engineering · doi:10.1016/j.eng.2025.06.031 · Cited by 11
Ye, L., Li, S., Bi, G., Li, B., Cai, Z., Jin, M., Zhang, Y., Yang, W., Li, Y., Li, S., et al. (2025) · Advanced Science · doi:10.1002/advs.202417478 · Cited by 12
Metadata
- Authors
- Tao, T., Deng, P., Wang, Y., Zhang, X., Guo, Y., Chen, W., & Qin, J.
- Affiliations
- Dalian Institute of Chemical Physics (CN)
- Corresponding author
- Qin, Jianhua
- Venue
- Advanced Science
- Publisher
- Wiley
- Published
- 2021-12-23
- Volume
- 9
- Issue
- 5
- Pages
- e2103495-e2103495
- ISSN
- 2198-3844 (ISSN-L)
- PMC
- PMC8844474
- OpenAlex
- W4200627985
- Cited by
- 178
- References
- 65
- Citations by year
- 2026: 23 · 2025: 44 · 2024: 60 · 2023: 30 · 2022: 20 · 2021: 1
- FWCI
- 26.07
- Type
- journal article
- Language
- en
- Open access
- gold
- doi.org
- Licence
- Locations
- Advanced Science (publishedVersion, cc-by)
- PubMed Central (publishedVersion, cc-by)
- PubMed (publishedVersion)
- DOAJ (DOAJ: Directory of Open Access Journals) (submittedVersion, cc-by-sa)
- Funders
- Yunnan Key Research and Development Program (202003AD150009)
- Center for Advanced Study, University of Illinois at Urbana-Champaign (DICP I201934)
- Topics
- Health Sciences › Medicine › Endocrinology, Diabetes and Metabolism › Pancreatic function and diabetes
- Physical Sciences › Engineering › Biomedical Engineering › 3D Printing in Biomedical Research
- Health Sciences › Medicine › Surgery › Tissue Engineering and Regenerative Medicine
- Keywords
- type 2 diabetes, glucose-stimulated insulin secretion, glucose tolerance, mitochondrial dysfunction, glucose transport, metformin, in vitro disease model
- MeSH terms
- Diabetes Mellitus, Type 2, Humans, Islets of Langerhans, Liver, Organoids, Induced Pluripotent Stem Cells
About these checks
Registry, retraction, Cites and statistics results are computed, not judged, with one exception: a printed reference that no index lists is read once by a model before it counts as a citation error. Claims are extracted by a model and kept only when their quote appears verbatim in the text; each cited source is then checked, with a model’s help, for whether it says what the claim relies on. Those verdicts can be wrong — read the claim’s quote and the cited source before relying on one.
Statistics and arithmetic are recomputed, not judged.
Confidence bands are shown only for fields calibrated on our annotated test set. None is calibrated yet, so no band is shown.
What counts as a claim ›How we measure confidence ›How we check this ›
Are you an author, or do you see a problem with this page? Request a review
Data sources
Bibliographic data: Semantic Scholar, OpenAlex, Crossref.
Contains information from the Semantic Scholar Academic Graph Datasets, made available under the ODC Attribution License (ODC-BY 1.0).
Semantic Scholar’s data is described in: Kinney, R., et al. (2023). The Semantic Scholar Open Data Platform. arXiv:2301.10140.
