

The DOI matches its Crossref record; 30 of the 31 references it cites were found in a registry or an index, and 1 are not checked yet; none of the 22 sources its claims cite is checked for support yet.
Neutralizing topological obstructions to bubbles of nothing
Open accessAbstract
A bstract: Theories with compact extra dimensions can exhibit a vacuum instability known as a bubble of nothing. These decay modes can be obstructed if the internal manifold is stabilized by fluxes, or if it carries Wilson lines for background gauge fields, or if the instanton is incompatible with the spin structure. In each of these cases the decay can proceed by adding dynamical charged membranes or gauge fields. We give a general, bottom-up procedure for constructing approximate bubble of nothing solutions in models with internal spheres stabilized by flux and study the influence of the brane tension on the tunneling exponent, finding two branches of solutions that merge at a minimal superextremal value of the tension. In the case of Wilson operators and incompatible fermions, the relevant bubble is shown to be the Euclidean Reissner-Nordstrom black hole, and the ordinary decay exponent is modified by 1/ g 2 effects. We examine the Dirac operator on this background and comment on the relevance for models of supergravity with gauged R -symmetry.
Checked 2026-11-13 · 1 reference not checked yet
Overview
CoChat Summary
TL;DR
The paper gives bottom-up constructions of bubble-of-nothing decays that are topologically obstructed by flux, Wilson lines, or incompatible fermion spin structures, showing how dynamical membranes or gauge fields can neutralize the obstruction. It finds new branch structure and a lower bound on brane tension in flux-stabilized models, and identifies Euclidean Reissner-Nordström as the relevant instanton for Wilson-line/fermion obstructions.
Key findings
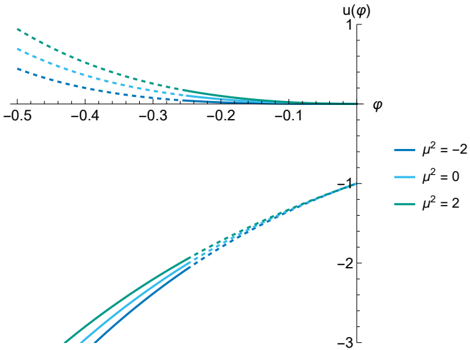
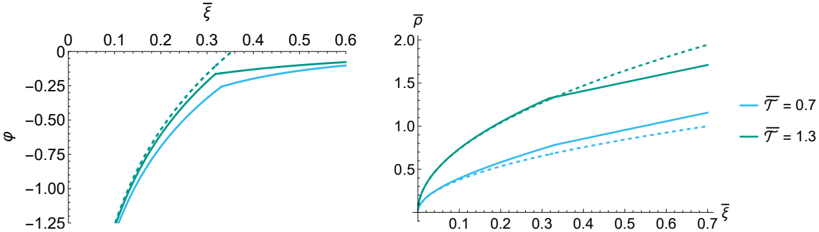
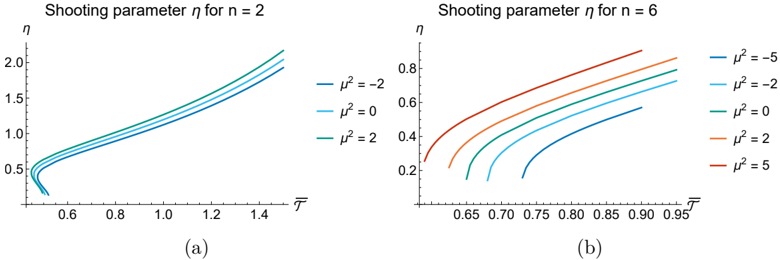
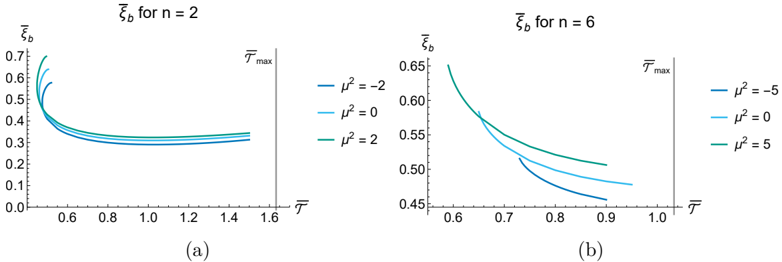
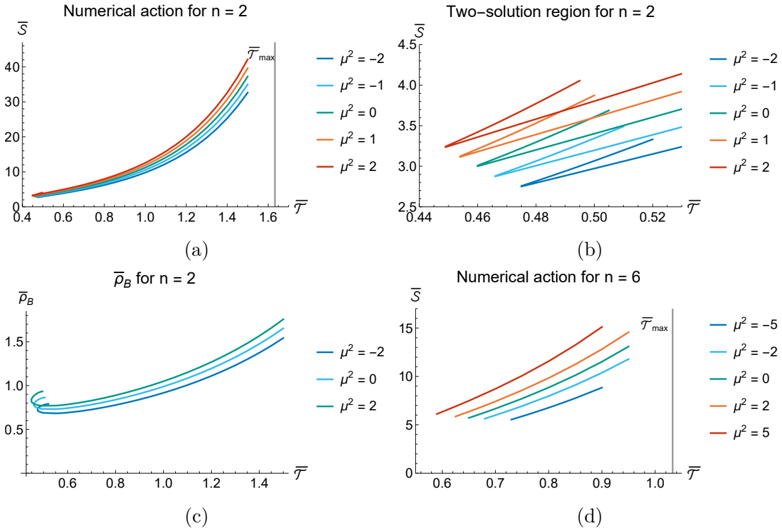
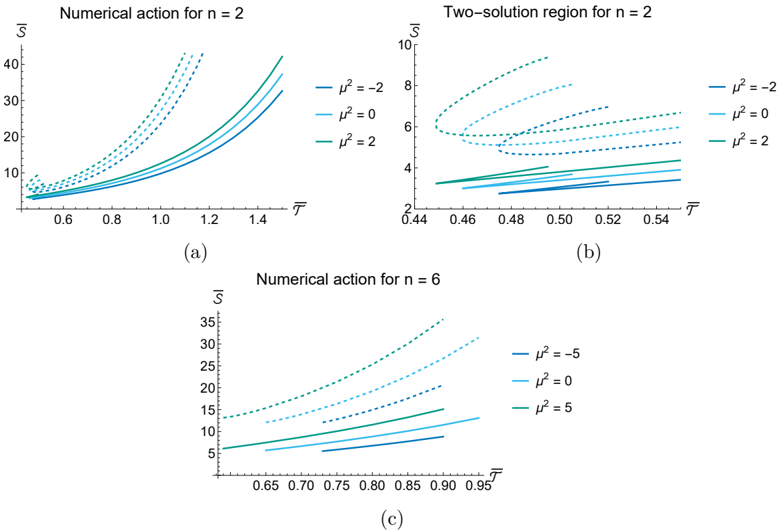
- For flux-stabilized internal spheres, BON decay requires co-nucleation with a charged membrane; the authors find two branches of solutions that merge at a minimal superextremal tension \(T_{\min}\), below which no viable solutions were found.
- The on-shell action grows faster than linearly with brane tension \(T\). For \(n=2\), \(\mu=0\), they report \(S(T=0.5)\approx 3\) and \(S(T=1.25)\approx 52\), and universe-lifetime bounds \(|Q|\gtrsim 20 g_0\) at \(T\simeq0.5\) and \(|Q|\gtrsim 10 g_0\) at \(T\simeq1.25\); for \(n=6\), \(|Q|\gtrsim150 g_0\) at \(T\simeq0.65\) and \(|Q|\gtrsim96 g_0\) at \(T\simeq0.95\).
- For Wilson operators and incompatible fermions, the relevant bubble is the Euclidean Reissner-Nordström black hole, and the ordinary decay exponent is modified by \(1/g^2\) effects; the Euclidean action is \(S_E \approx \frac{\pi^2 R_0^2}{\kappa_4}+\frac{2\pi^2 A_{5,0}^2}{g_4^2}\) for \(1/g_4^2\ll R_0^2/\kappa_4\).
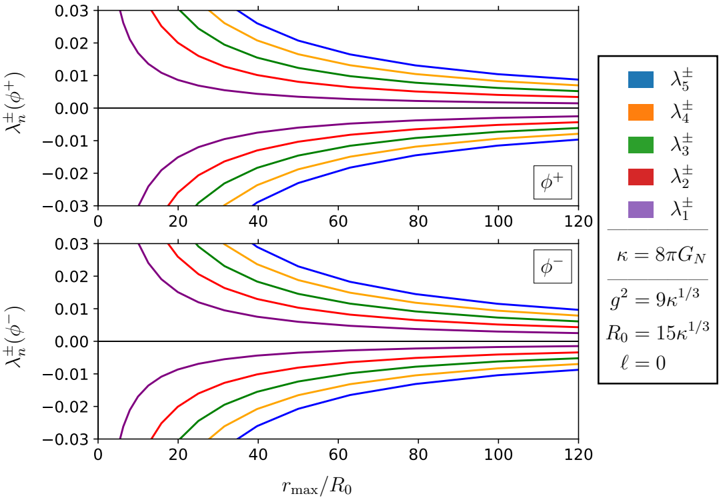
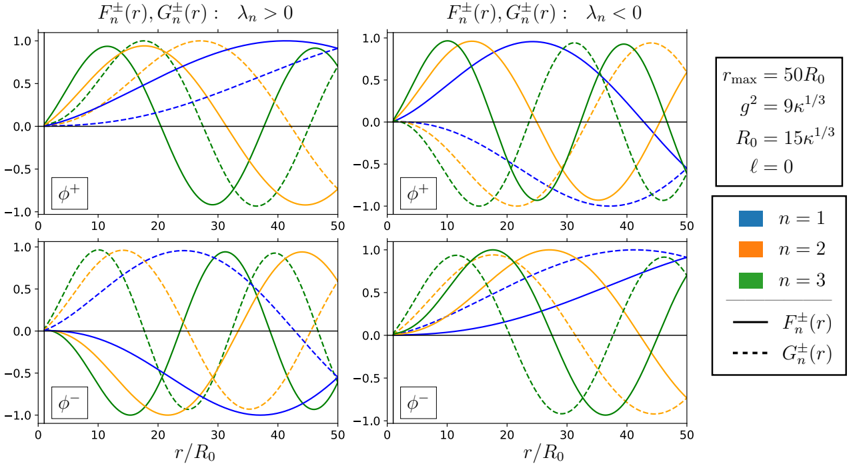
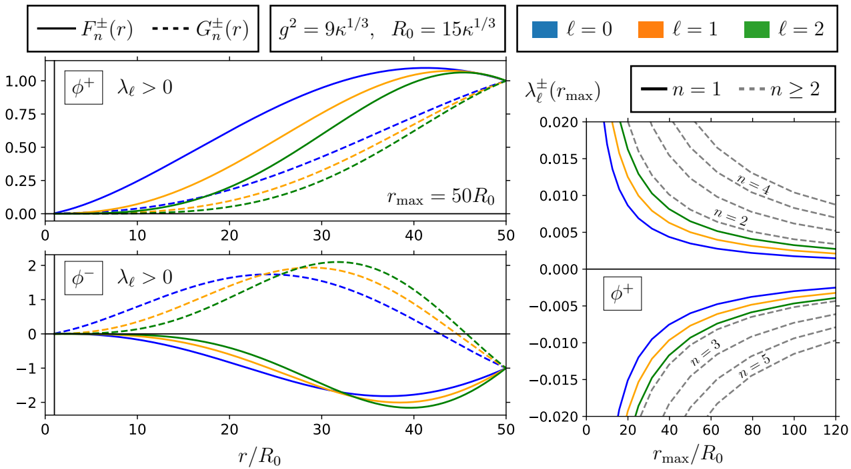
- A numerical Dirac spectrum on this background shows no isolated zero mode; eigenvalues converge to zero like \(1/r_{\max}\) as the cutoff grows. The mechanism can operate in softly broken gauged 5D supergravity, but the paper says only in rather exotic circumstances.
Methods
- Flux case: dimensionally reduce \(4+n\)-dimensional Einstein gravity with an \(n\)-sphere, flux, and a thin charged brane; formulate a Coleman-De Luccia problem with nonstandard boundary conditions, derive jump conditions, and solve numerically by shooting for \(n=2\) and \(n=6\) with potentials including \(\mu^2\).
- Wilson/fermion case: study 5D Kaluza-Klein theory with a background Wilson line or massive fermions, make the gauge field dynamical, and use the Euclidean Reissner-Nordström solution to Einstein-Maxwell equations.
- Dirac spectrum: solve the Dirac equation on the Euclidean Reissner-Nordström background numerically, using conformal transformation to a product manifold and point-and-shoot with Dirichlet boundary conditions.
Limitations
- The paper states that the flux analysis uses a thin-brane, full-screening approximation where all flux is screened inside the brane radius, treating the brane as smeared rather than localized; it says a more physically accurate treatment could alter the properties found.
- The paper states numerical difficulties: the upper branch for \(n=2\) is only found for restricted \(T\), the shooting method becomes unreliable near \(T_{\min}\) and \(T_{\max}\), and for \(n=6\) no second solution branch was found before numerical precision limits.
- The paper states that in the Wilson-line section it ignores the stabilizing radial modulus and the holonomy potential \(V(A_5)\), assuming a relevant minimum away from the origin; it also notes the Dirac spectrum discussion is “somewhat tangential.”
Model-written summary. Check it against the paper before relying on it.
Integrity signals
Registry
Cites
Statistics
Figures
Verification
Claims the paper makes
0 Valid · 9 Not valid · 15 Not checked · 126 Own results and interpretations
A result the paper states — it cites no source for it, so there is none to check. The quote shows it is in the paper.
In the paper
“In the case of Wilson operators and incompatible fermions, the relevant bubble is shown to be the Euclidean Reissner-Nordstrom black hole, and the ordinary decay exponent is modified by 1/g 2 effects.”
§ Neutralizing topological obstructions to bubbles of nothing > Abstract
plainstates a cause- Asserted: passes — The authors put it forward as true.
- Checkable: passes — It can be checked against evidence.
- Load-bearing: passes — The paper’s conclusions depend on it.
- Based: passes — The paper gives a reason why it holds.
A result the paper reports from its own data — it cites no other source for it, so there is none to check. The quote shows it is in the paper.
In the paper
“The branches converge at a minimum value of T , below which we found no viable solutions.”
§ Neutralizing topological obstructions to bubbles of nothing > 2.7.2 Examples
plainstates an associationn = 2- Asserted: passes — The authors put it forward as true.
- Checkable: passes — It can be checked against evidence.
- Load-bearing: unclear — It is unclear whether the paper’s conclusions depend on it.
- Based: passes — The paper gives a reason why it holds.
The paper states this without a source or data behind it here, so there is nothing to check it against. The quote shows it is in the paper.
In the paper
“It is straightforward to check that for n ≥ 2, the term in the third line of (2.39), localized at ξ = 0, vanishes.”
§ Neutralizing topological obstructions to bubbles of nothing > JHEP10(2023)049
plain- Asserted: passes — The authors put it forward as true.
- Checkable: passes — It can be checked against evidence.
- Load-bearing: passes — The paper’s conclusions depend on it.
- Based: unclear — It is unclear why the paper says it holds.
A result the paper reports from its own data — it cites no other source for it, so there is none to check. The quote shows it is in the paper.
In the paper
“finding two branches of solutions that merge at a minimal superextremal value of the tension.”
- Also stated in: § 1 Introduction · plain
“An interesting new finding of the numerical analysis is the existence of multiple branches of BON solutions, and a novel lower bound on the tension of the charged membrane, below which the vacuum is not destabilized by this Schwinger-BON decay.”
§ Neutralizing topological obstructions to bubbles of nothing > Abstract
plainstates a cause- Asserted: passes — The authors put it forward as true.
- Checkable: passes — It can be checked against evidence.
- Load-bearing: passes — The paper’s conclusions depend on it.
- Based: passes — The paper gives a reason why it holds.
- Also stated in: § 1 Introduction · plain
A result the paper states — it cites no source for it, so there is none to check. The quote shows it is in the paper.
In the paper
“The equations of motion (2.43)-(2.46)for the nondimensionalized parameters φ( ξ), ρ( ξ), u(φ), and T do not depend on the values of U 0 , Q, g or M p /M .”
§ Neutralizing topological obstructions to bubbles of nothing > JHEP10(2023)049
plain- Asserted: passes — The authors put it forward as true.
- Checkable: passes — It can be checked against evidence.
- Load-bearing: passes — The paper’s conclusions depend on it.
- Based: passes — The paper gives a reason why it holds.
70 more claims
Create a free account to see all 150 claims and to verify the 15 references still open.
- It may state two separate claims as one. 46
- Probably not a substantial claim. 40
- The quote only partly states this claim. 1
Citations
Cites
Gravitational effects on and of vacuum decay
Coleman, S., & De Luccia, F. (1980) · Physical Review D · doi:10.1103/physrevd.21.3305 · Cited by 1,537 · cited 1×
“The gravitational force enriches the semiclassical theory of vacuum decay [1].”
BackgroundCharged black holes in string theory
Garfinkle, D., Horowitz, G. T., & Strominger, A. (1991) · Physical Review D · doi:10.1103/physrevd.43.3140 · Cited by 1,124
Instability of the Kaluza-Klein vacuum
Witten, E. (1982) · Nuclear Physics B · doi:10.1016/0550-3213(82)90007-4 · Cited by 595
Sharpening the weak gravity conjecture with dimensional reduction
Heidenreich, B., Reece, M., & Rudelius, T. (2016) · Journal of High Energy Physics · doi:10.1007/jhep02(2016)140 · Cited by 190
Comments on supercurrent multiplets, supersymmetric field theories and supergravity
Komargodski, Z., & Seiberg, N. (2010) · Journal of High Energy Physics · doi:10.1007/jhep07(2010)017 · Cited by 154
Casimir effect between world-branes in heterotic M-theory
Fabinger, M., & Hořava, P. (2000) · Nuclear Physics B · doi:10.1016/s0550-3213(00)00255-8 · Cited by 133
Negative energy in string theory
Brill, D., & Horowitz, G. T. (1991) · Physics Letters B · doi:10.1016/0370-2693(91)90618-z · Cited by 123
Comments on the Fayet-Iliopoulos term in field theory and supergravity
Komargodski, Z., & Seiberg, N. (2009) · Journal of High Energy Physics · doi:10.1088/1126-6708/2009/06/007 · Cited by 109
Quantum horizons of the standard model landscape
Arkani-Hamed, N., Dubovsky, S., Nicolis, A., & Villadoro, G. (2007) · Journal of High Energy Physics · doi:10.1088/1126-6708/2007/06/078 · Cited by 103
Nonperturbative instability of AdS5×S5/Zk
Horowitz, G. T., Orgera, J., & Polchinski, J. (2008) · Physical review. D. Particles, fields, gravitation, and cosmology/Physical review. D. Particles and fields · doi:10.1103/physrevd.77.024004 · Cited by 98
Cited by
Hiding the extra dimensions: A review on scale separation in string theory
Coudarchet, T. (2024) · Physics Reports · doi:10.1016/j.physrep.2024.02.003 · Cited by 50
Cobordism and bubbles of anything in the string landscape
Friedrich, B., Hebecker, A., & Walcher, J. (2024) · Journal of High Energy Physics · doi:10.1007/jhep02(2024)127 · Cited by 26
Morse-Bott inequalities, topology change and cobordisms to nothing
Ruiz, I. (2025) · Journal of High Energy Physics · doi:10.1007/jhep06(2025)030 · Cited by 6
The Measure Problem and Challenges in String Compactifications
Friedrich, B. (2025) · heiDOK (Heidelberg University) · doi:10.11588/heidok.00036724
Bubbles of nothing: the tunneling potential approach
Blanco-Pillado, J. J., Espinosa, J. R., Huertas, J., & Sousa, K. (2024) · Journal of Cosmology and Astroparticle Physics · doi:10.1088/1475-7516/2024/03/029 · Cited by 9
Metadata
- Authors
- Draper, P., Lillard, B., & Skye, C.
- Affiliations
- University of Illinois Urbana-Champaign (US)
- Corresponding author
- Lillard, Benjamin
- Venue
- Journal of High Energy Physics
- Published
- 2023-10-06
- Volume
- 2023
- Issue
- 10
- ISSN
- 1029-8479 (ISSN-L)
- OpenAlex
- W4387429263
- Semantic Scholar
- 557fab5967493652bc12cbfe6d87151982e53e52
- Cited by
- 5
- References
- 30
- Citations by year
- 2025: 2 · 2024: 3
- FWCI
- 0.31
- Type
- journal article
- Language
- en
- Open access
- diamond
- doi.org
- Locations
- Journal of High Energy Physics (publishedVersion, cc-by)
- arXiv (Cornell University) (submittedVersion)
- DOAJ (DOAJ: Directory of Open Access Journals) (submittedVersion, cc-by-sa)
- arXiv (Cornell University)
- Funders
- U.S. Department of Energy (DESC0011640, DESC0015655)
- Office of Science (DESC0015655)
- High Energy Physics (DESC0015655)
- Topics
- Physical Sciences › Physics and Astronomy › Nuclear and High Energy Physics › Black Holes and Theoretical Physics
- Physical Sciences › Physics and Astronomy › Nuclear and High Energy Physics › Particle physics theoretical and experimental studies
- Physical Sciences › Physics and Astronomy › Nuclear and High Energy Physics › Noncommutative and Quantum Gravity Theories
- Keywords
- bubble of nothing, vacuum decay, compactified extra dimensions, flux stabilization, Wilson lines, instantons, spin structure, charged membranes, brane tension, Dirac operator, supergravity, topological obstructions
About these checks
Registry, retraction, Cites and statistics results are computed, not judged, with one exception: a printed reference that no index lists is read once by a model before it counts as a citation error. Claims are extracted by a model and kept only when their quote appears verbatim in the text; each cited source is then checked, with a model’s help, for whether it says what the claim relies on. Those verdicts can be wrong — read the claim’s quote and the cited source before relying on one.
A language model drew the claims from the paper on 2026-11-13, under version 3 of the claim definition (model deepseek-v4.1-flash, prompt extract-v3).
A second model labelled each claim on 2026-11-13 (model jev-1.13-20260917, definition revision gold-guideline-v0.2).
Statistics and arithmetic are recomputed, not judged.
Confidence bands are shown only for fields calibrated on our annotated test set. None is calibrated yet, so no band is shown.
What counts as a claim ›How we measure confidence ›How we check this ›
Are you an author, or do you see a problem with this page? Request a review
Data sources
Bibliographic data: Semantic Scholar, OpenAlex, Crossref.
Contains information from the Semantic Scholar Academic Graph Datasets, made available under the ODC Attribution License (ODC-BY 1.0).
Semantic Scholar’s data is described in: Kinney, R., et al. (2023). The Semantic Scholar Open Data Platform. arXiv:2301.10140.
