

The DOI matches its Crossref record; 46 of the 46 references it cites were found in a registry or an index; 5 of the 16 sources its claims cite were checked for support.
Mechanistic evaluation of primary human hepatocyte culture using global proteomic analysis reveals a selective dedifferentiation profile
Open accessAbstract
The application of primary human hepatocytes following isolation from human tissue is well accepted to be compromised by the process of dedifferentiation. This phenomenon reduces many unique hepatocyte functions, limiting their use in drug disposition and toxicity assessment. The aetiology of dedifferentiation has not been well defined, and further understanding of the process would allow the development of novel strategies for sustaining the hepatocyte phenotype in culture or for improving protocols for maturation of hepatocytes generated from stem cells. We have therefore carried out the first proteomic comparison of primary human hepatocyte differentiation. Cells were cultured for 0, 24, 72 and 168 h as a monolayer in order to permit unrestricted hepatocyte dedifferentiation, so as to reveal the causative signalling pathways and factors in this process, by pathway analysis. A total of 3430 proteins were identified with a false detection rate of <1 %, of which 1117 were quantified at every time point. Increasing numbers of significantly differentially expressed proteins compared with the freshly isolated cells were observed at 24 h (40 proteins), 72 h (118 proteins) and 168 h (272 proteins) (p < 0.05). In particular, cytochromes P450 and mitochondrial proteins underwent major changes, confirmed by functional studies and investigated by pathway analysis. We report the key factors and pathways which underlie the loss of hepatic phenotype in vitro, particularly those driving the large-scale and selective remodelling of the mitochondrial and metabolic proteomes. In summary, these findings expand the current understanding of dedifferentiation should facilitate further development of simple and complex hepatic culture systems.
Overview
AI snapshot
Written from the paper’s full text.
TL;DR
This study used global iTRAQ proteomics to track primary human hepatocyte dedifferentiation over 168 h in monolayer culture, identifying an escalating and selective loss of hepatic proteins rather than a wholesale collapse of all hepatocyte functions. Donor identity dominated early proteomic clustering, while culture time drove convergence toward a dedifferentiated phenotype.
Key findings
- Across three iTRAQ runs, 3430 unique proteins were detected with FDR <1%, and 1117 were quantified at every time point; significantly differentially expressed proteins increased from 40 at 24 h to 118 at 72 h and 272 at 168 h versus freshly isolated cells (p < 0.05).
- Dedifferentiation was selective: cytochromes P450 were largely down-regulated, with CYP2A6, CYP2C8, and CYP4A11 among the top down-regulated proteins at 168 h, while some CYPs such as CYP2C18 and CYP2J2 remained unaltered; only 2 of 9 detected transporters, both influx transporters SLCO1B1 and SLCO1B3, were significantly down-regulated at 168 h (p < 0.05).
- Mitochondrial and metabolic proteomes underwent major remodeling, but oxidative phosphorylation parameters remained remarkably stable between 24 and 168 h, and PHHs showed significantly increased resistance to rotenone toxicity at 168 h in all donors.
- Hierarchical clustering showed donor source was the dominant factor over the first 72 h, with convergence toward a culture-time-dependent dedifferentiated phenotype by 168 h; pathway analysis implicated proliferative/inflammatory activation and inhibition of metabolic regulators including PPARα, insulin receptor, KLF15, and TFAM.
Methods
- Primary human hepatocytes were isolated by a 2-step collagenase method from surgical waste with consent and cultured as monolayers on collagen-I-coated plates; samples were collected at 0, 24, 72, and 168 h.
- Five donors were analyzed by iTRAQ-based quantitative proteomics across three 8-plex runs, with proteins identified by mass spectrometry and statistically analyzed using LIMMA and t test modules in R; pathway, upstream regulator, and transcription factor binding analyses used IPA, PANTHER, and Mapper2.
- Functional validation included western blotting for CYP2D6, CYP2E1, CYP1A2, and actin; LC–MS–MS metabolism assays for CYP3A4 (testosterone) and CYP2D6 (dextromethorphan); Seahorse OCR/ECAR mitochondrial and glycolytic assays; and rotenone toxicity ATP assays.
Limitations
- The paper does not include a dedicated limitations section.
- The authors state that some results may be specific to monolayer culture, which was chosen deliberately to exacerbate dedifferentiation and may not fully represent complex culture systems.
- Evident from the text: proteomic analysis used five donors, functional assays used varying donor numbers (e.g., metabolism n = 3; Seahorse and rotenone n = 5), and some ADME heatmap data were derived from n = 2 or n = 1 donors, limiting generalizability and statistical power.
Model-written summary. Check it against the paper before relying on it.
Integrity signals
Registry
Cites
Statistics
Figures
Verification
Claims the paper makes
53 Own result · 28 Own interpretation · 10 No full text of the sources · 4 No basis given · 3 Partly supported · 3 Own method · 1 Supported · 1 Supported so far · accuracy not yet measured
Every source the paper cites for this claim was checked and supports it.
In the paper
“only ~40 % of the variation in cell protein levels can be explained by differences in the corresponding mRNA levels (Schwanhausser et al. 2011).”
§ Mechanistic evaluation of primary human hepatocyte culture using global proteomic analysis reveals a selective dedifferentiation profile > Introduction
What the sources say
- Supportedcites Schwanhausser et al. 2011 source
The Discussion (p. 15) states that mRNA levels explain around 40% of the variability in protein levels. The analysis (p. 10) reports R² = 0.41 for the measured mRNA and protein copy numbers, directly supporting the paraphrase in the context of the cells studied. (LLM, conf=0.94)
plaincorrelational- Asserted: passes — The authors put it forward as true.
- Checkable: passes — It can be checked against evidence.
- Load-bearing: passes — The paper’s conclusions depend on it.
- Based: passes — The paper gives a reason why it holds.
- Supported
The paper states this without a source or data behind it here, so there is nothing to check it against. The quote shows it is in the paper.
In the paper
“We have therefore carried out the first proteomic comparison of primary human hepatocyte differentiation.”
§ Mechanistic evaluation of primary human hepatocyte culture using global proteomic analysis reveals a selective dedifferentiation profile > Abstract
plain- Asserted: passes — The authors put it forward as true.
- Checkable: passes — It can be checked against evidence.
- Load-bearing: passes — The paper’s conclusions depend on it.
- Based: passes — The paper gives a reason why it holds.
- Rests on an assumption: The aetiology of dedifferentiation has not been well defined.
- Rests on an assumption: The exact mechanisms governing hepatocyte dedifferentiation remain incompletely understood.
A result the paper reports from its own data — it cites no other source for it, so there is none to check. The quote shows it is in the paper.
In the paper
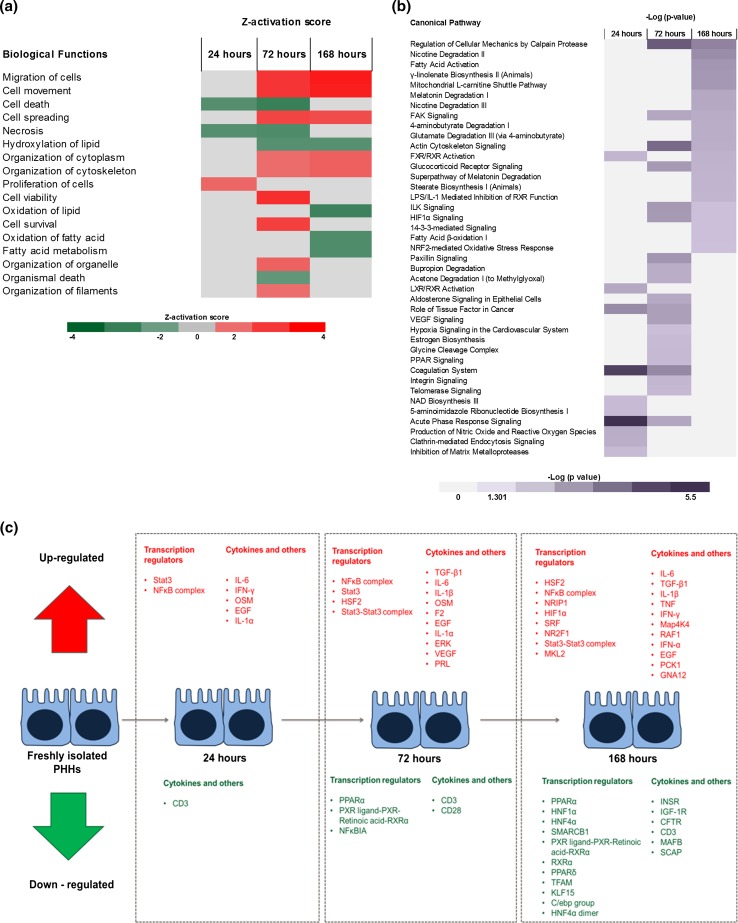
“Moreover, many energy production-associated factors are down-regulated at 168 h including PPARα, insulin receptor, KLF15 and the mitochondrial transcription factor TFAM.”
§ Mechanistic evaluation of primary human hepatocyte culture using global proteomic analysis reveals a selective dedifferentiation profile > Results > Pathway analysis reveals the key changes and dynamic profile of dedifferentiation
plaincorrelational- Asserted: passes — The authors put it forward as true.
- Checkable: passes — It can be checked against evidence.
- Load-bearing: passes — The paper’s conclusions depend on it.
- Based: passes — The paper gives a reason why it holds.
A result the paper reports from its own data — it cites no other source for it, so there is none to check. The quote shows it is in the paper.
In the paper
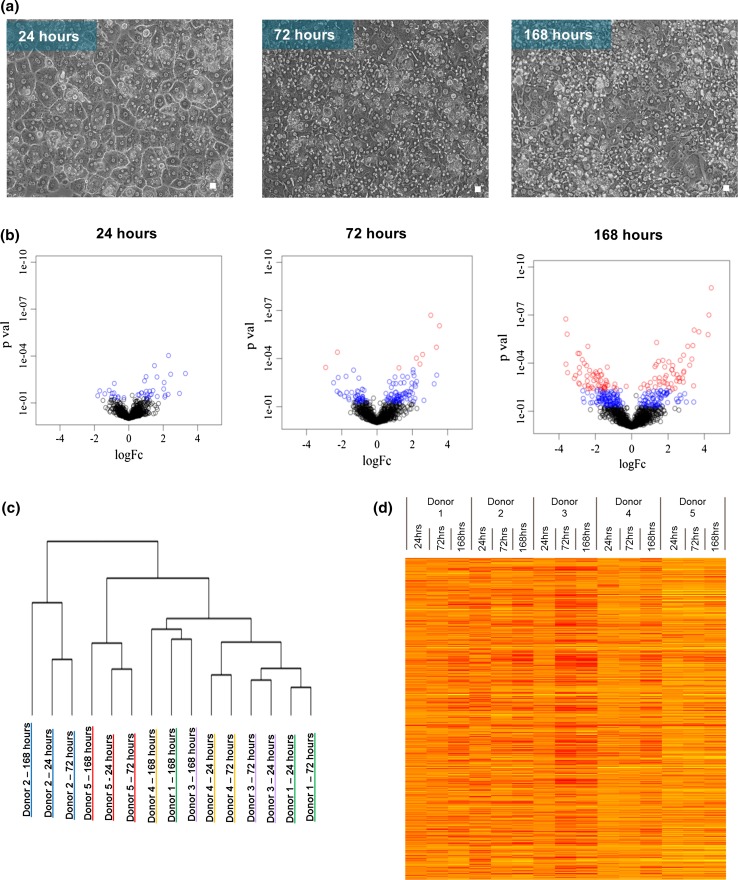
“Hierarchical clustering of the entire dataset shows that the dominant factor in determining how the samples are related is in fact the original source of the cells, rather than time in culture (Fig. 1c).”
§ Mechanistic evaluation of primary human hepatocyte culture using global proteomic analysis reveals a selective dedifferentiation profile > Results > Global proteomics reveals donor-dependent variation as a major influence on dedifferentiation
plaincorrelational- Asserted: passes — The authors put it forward as true.
- Checkable: passes — It can be checked against evidence.
- Load-bearing: passes — The paper’s conclusions depend on it.
- Based: passes — The paper gives a reason why it holds.
A result the paper reports from its own data — it cites no other source for it, so there is none to check. The quote shows it is in the paper.
In the paper
“This criterion highlights a number of proteins, including CYP2C9, which is known to vary in expression between individuals (Sistonen et al. 2009), and glutamine synthetase, which is associated with differential expression according to liver zonation (Jungermann and Kietzmann 1996).”
§ Mechanistic evaluation of primary human hepatocyte culture using global proteomic analysis reveals a selective dedifferentiation profile > Results > Global proteomics reveals donor-dependent variation as a major influence on dedifferentiation
boostedcorrelationaln = 5- Asserted: passes — The authors put it forward as true.
- Checkable: passes — It can be checked against evidence.
- Load-bearing: passes — The paper’s conclusions depend on it.
- Based: passes — The paper gives a reason why it holds.
A result the paper reports from its own data — it cites no other source for it, so there is none to check. The quote shows it is in the paper.
In the paper
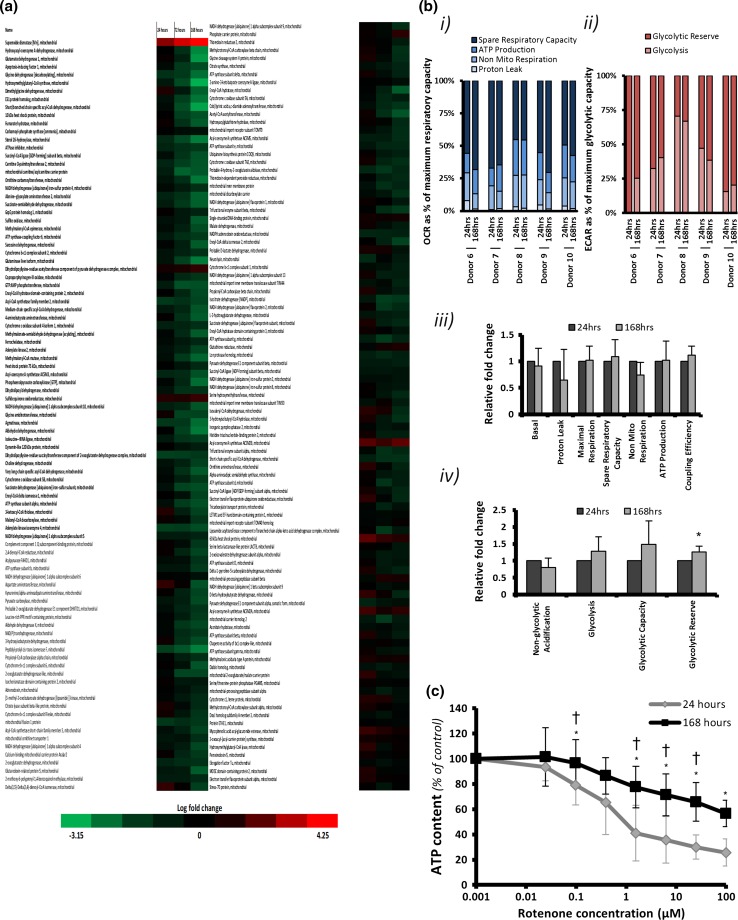
“However, a number of key mitochondrial proteins, such as mitochondrial import receptor subunits, remained largely unchanged (table S5).”
§ Mechanistic evaluation of primary human hepatocyte culture using global proteomic analysis reveals a selective dedifferentiation profile > Results > Analysis of mitochondrial functional profile reveals donor variation in the bioenergetic profile
plain- Asserted: passes — The authors put it forward as true.
- Checkable: passes — It can be checked against evidence.
- Load-bearing: passes — The paper’s conclusions depend on it.
- Based: passes — The paper gives a reason why it holds.
A result the paper reports from its own data — it cites no other source for it, so there is none to check. The quote shows it is in the paper.
In the paper
“In particular, cytochromes P450 and mitochondrial proteins underwent major changes, confirmed by functional studies and investigated by pathway analysis.”
§ Mechanistic evaluation of primary human hepatocyte culture using global proteomic analysis reveals a selective dedifferentiation profile > Abstract
plaindirect- Asserted: passes — The authors put it forward as true.
- Checkable: passes — It can be checked against evidence.
- Load-bearing: passes — The paper’s conclusions depend on it.
- Based: passes — The paper gives a reason why it holds.
A result the paper reports from its own data — it cites no other source for it, so there is none to check. The quote shows it is in the paper.
In the paper
“Furthermore, a negative regulator of mitochondrial fusion, OMA-1, is also predicted to be down-regulated (figure S2b).”
§ Mechanistic evaluation of primary human hepatocyte culture using global proteomic analysis reveals a selective dedifferentiation profile > Results > Analysis of mitochondrial functional profile reveals donor variation in the bioenergetic profile
hedged- Asserted: passes — The authors put it forward as true.
- Checkable: passes — It can be checked against evidence.
- Load-bearing: unclear — It is unclear whether the paper’s conclusions depend on it.
- Based: passes — The paper gives a reason why it holds.
A result the paper reports from its own data — it cites no other source for it, so there is none to check. The quote shows it is in the paper.
In the paper
“This is particularly pronounced at the 24 and 72 h time points, which cluster according to donor in every case.”
§ Mechanistic evaluation of primary human hepatocyte culture using global proteomic analysis reveals a selective dedifferentiation profile > Results > Global proteomics reveals donor-dependent variation as a major influence on dedifferentiation
plaincorrelational- Asserted: passes — The authors put it forward as true.
- Checkable: passes — It can be checked against evidence.
- Load-bearing: passes — The paper’s conclusions depend on it.
- Based: passes — The paper gives a reason why it holds.
A result the paper reports from its own data — it cites no other source for it, so there is none to check. The quote shows it is in the paper.
In the paper
“The expression of proteins with known mitochondrial associations demonstrated a general downward trend of the DEPs (bold) with time in culture, particularly at 168 h, with superoxide dismutase II being a notable exception (Fig. 3a).”
§ Mechanistic evaluation of primary human hepatocyte culture using global proteomic analysis reveals a selective dedifferentiation profile > Results > Analysis of mitochondrial functional profile reveals donor variation in the bioenergetic profile
boostedcorrelational- Asserted: passes — The authors put it forward as true.
- Checkable: passes — It can be checked against evidence.
- Load-bearing: passes — The paper’s conclusions depend on it.
- Based: passes — The paper gives a reason why it holds.
A result the paper reports from its own data — it cites no other source for it, so there is none to check. The quote shows it is in the paper.
In the paper
“Increasing numbers of significantly differentially expressed proteins compared with the freshly isolated cells were observed at 24 h (40 proteins), 72 h (118 proteins) and 168 h (272 proteins) (p < 0.05).”
- Also stated in: § Global proteomics reveals donor-dependent variation as a major influence on dedifferentiation · plain
“40 DEPs are seen after 24 h, 118 after 72 h and 272 after 168 h in culture (p < 0.05).”
§ Mechanistic evaluation of primary human hepatocyte culture using global proteomic analysis reveals a selective dedifferentiation profile > Abstract
plaincorrelational- Asserted: passes — The authors put it forward as true.
- Checkable: passes — It can be checked against evidence.
- Load-bearing: passes — The paper’s conclusions depend on it.
- Based: passes — The paper gives a reason why it holds.
- Also stated in: § Global proteomics reveals donor-dependent variation as a major influence on dedifferentiation · plain
A result the paper reports from its own data — it cites no other source for it, so there is none to check. The quote shows it is in the paper.
In the paper
“Analysis of glycolytic consumption, as measured by ECAR, shows much greater donor-dependent variation (Fig. 3b (ii))”
§ Mechanistic evaluation of primary human hepatocyte culture using global proteomic analysis reveals a selective dedifferentiation profile > Results > Analysis of mitochondrial functional profile reveals donor variation in the bioenergetic profile
plaincorrelationaln = 5- Asserted: passes — The authors put it forward as true.
- Checkable: passes — It can be checked against evidence.
- Load-bearing: unclear — It is unclear whether the paper’s conclusions depend on it.
- Based: passes — The paper gives a reason why it holds.
A result the paper reports from its own data — it cites no other source for it, so there is none to check. The quote shows it is in the paper.
In the paper
“This analysis revealed predicted roles for AMPK signalling, a master regulator of energy metabolism, which increases in significance during time in culture (Figure S2a).”
§ Mechanistic evaluation of primary human hepatocyte culture using global proteomic analysis reveals a selective dedifferentiation profile > Results > Analysis of mitochondrial functional profile reveals donor variation in the bioenergetic profile
plaindirectn = 5- Asserted: passes — The authors put it forward as true.
- Checkable: passes — It can be checked against evidence.
- Load-bearing: unclear — It is unclear whether the paper’s conclusions depend on it.
- Based: passes — The paper gives a reason why it holds.
A result the paper reports from its own data — it cites no other source for it, so there is none to check. The quote shows it is in the paper.
In the paper
“These included several mitochondrial proteins within the ten most stable proteins.”
§ Mechanistic evaluation of primary human hepatocyte culture using global proteomic analysis reveals a selective dedifferentiation profile > Results > Global proteomics reveals donor-dependent variation as a major influence on dedifferentiation
plainn = 5- Asserted: passes — The authors put it forward as true.
- Checkable: passes — It can be checked against evidence.
- Load-bearing: unclear — It is unclear whether the paper’s conclusions depend on it.
- Based: passes — The paper gives a reason why it holds.
A result the paper reports from its own data — it cites no other source for it, so there is none to check. The quote shows it is in the paper.
In the paper
“Throughout the analysis, differentially expressed proteins and associated pathways were found at every time point”
§ Mechanistic evaluation of primary human hepatocyte culture using global proteomic analysis reveals a selective dedifferentiation profile > Discussion
plain- Asserted: passes — The authors put it forward as true.
- Checkable: passes — It can be checked against evidence.
- Load-bearing: passes — The paper’s conclusions depend on it.
- Based: passes — The paper gives a reason why it holds.
- Rests on an assumption: The iTRAQ proteomic quantification accurately reflects relative protein expression changes in PHH culture.
The paper states this without a source or data behind it here, so there is nothing to check it against. The quote shows it is in the paper.
In the paper
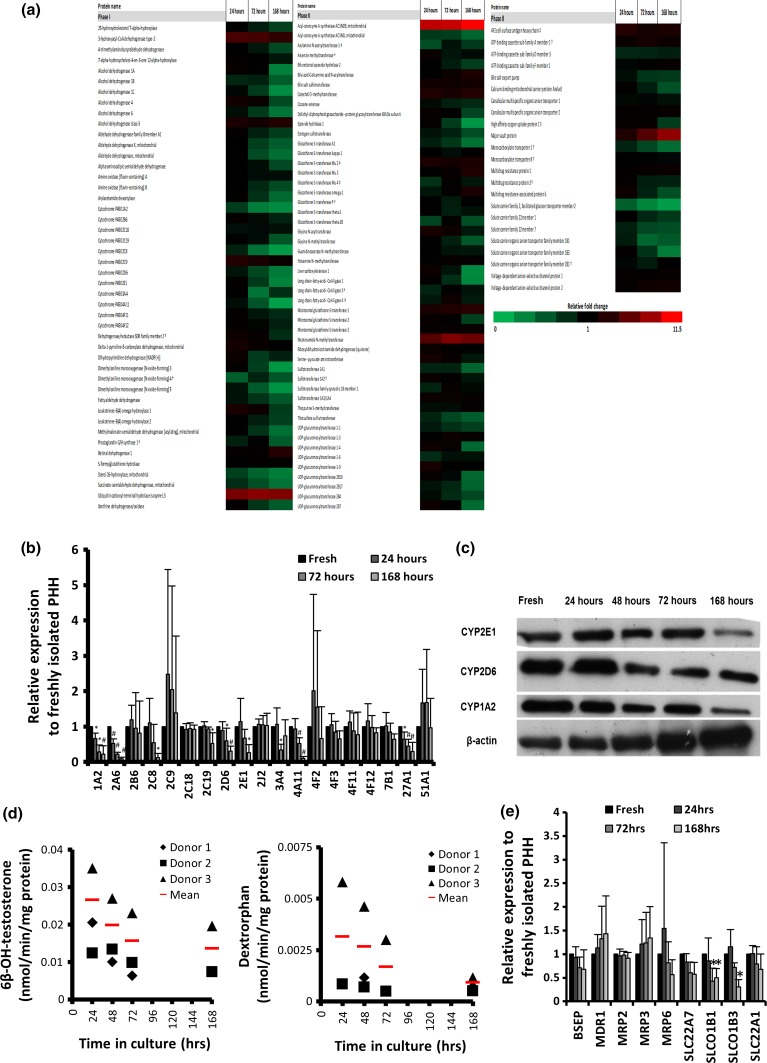
“the majority, with the exception of CYP4F2 and 4F3, show significant down-regulation at 168 h”
§ Mechanistic evaluation of primary human hepatocyte culture using global proteomic analysis reveals a selective dedifferentiation profile > Results > Assessment of ADME proteins during dedifferentiation reveals selective protein down-regulation
plain- Asserted: passes — The authors put it forward as true.
- Checkable: passes — It can be checked against evidence.
- Load-bearing: passes — The paper’s conclusions depend on it.
- Based: passes — The paper gives a reason why it holds.
- Rests on an assumption: The iTRAQ proteomic quantification accurately reflects relative protein expression changes in PHH culture.
A result the paper reports from its own data — it cites no other source for it, so there is none to check. The quote shows it is in the paper.
In the paper
“is highly associated with the differentially expressed ADME proteins.”
§ Mechanistic evaluation of primary human hepatocyte culture using global proteomic analysis reveals a selective dedifferentiation profile > Results > Pathway analysis of ADME proteins reveals the pathways and transcription factors predicted to underlie the loss of specific metabolic functions
plaincorrelational- Asserted: passes — The authors put it forward as true.
- Checkable: passes — It can be checked against evidence.
- Load-bearing: unclear — It is unclear whether the paper’s conclusions depend on it.
- Based: passes — The paper gives a reason why it holds.
- Rests on an assumption: Predicted transcription factor binding sites are functionally relevant to CYP expression.
A result the paper reports from its own data — it cites no other source for it, so there is none to check. The quote shows it is in the paper.
In the paper
“the most significantly predicted up-regulated factor at 168 h was heat shock factor 2 (HSF2).”
§ Mechanistic evaluation of primary human hepatocyte culture using global proteomic analysis reveals a selective dedifferentiation profile > Discussion
plain- Asserted: passes — The authors put it forward as true.
- Checkable: passes — It can be checked against evidence.
- Load-bearing: unclear — It is unclear whether the paper’s conclusions depend on it.
- Based: passes — The paper gives a reason why it holds.
- Rests on an assumption: Predicted transcription factor binding sites are functionally relevant to CYP expression.
In the paper
“HNF1α, C/EBP and HNF1β were amongst the most significantly associated regulators with the loss of metabolic competence.”
§ Mechanistic evaluation of primary human hepatocyte culture using global proteomic analysis reveals a selective dedifferentiation profile > Results > Pathway analysis of ADME proteins reveals the pathways and transcription factors predicted to underlie the loss of specific metabolic functions
What the sources say
- Not checked — no full text of the sourcecites Fraczek et al. 2013 source
plaincorrelational- Asserted: passes — The authors put it forward as true.
- Checkable: passes — It can be checked against evidence.
- Load-bearing: passes — The paper’s conclusions depend on it.
- Based: passes — The paper gives a reason why it holds.
- Rests on an assumption: Predicted transcription factor binding sites are functionally relevant to CYP expression.
The paper states this without a source or data behind it here, so there is nothing to check it against. The quote shows it is in the paper.
In the paper
“demonstrating a good correlation between mRNA at 72 h and protein at 168 h in the down-regulated CYPs.”
§ Mechanistic evaluation of primary human hepatocyte culture using global proteomic analysis reveals a selective dedifferentiation profile > Results > Assessment of ADME proteins during dedifferentiation reveals selective protein down-regulation
boostedcorrelational- Asserted: passes — The authors put it forward as true.
- Checkable: passes — It can be checked against evidence.
- Load-bearing: passes — The paper’s conclusions depend on it.
- Based: passes — The paper gives a reason why it holds.
- Rests on an assumption: The mRNA data from Richert et al. 2006 in monolayer culture are comparable to the protein data in this study.
A result the paper reports from its own data — it cites no other source for it, so there is none to check. The quote shows it is in the paper.
In the paper
“Only 2 of the 9 detected transporters are significantly down-regulated at 168 h (p < 0.05; Fig. 4e)”
§ Mechanistic evaluation of primary human hepatocyte culture using global proteomic analysis reveals a selective dedifferentiation profile > Results > Assessment of ADME proteins during dedifferentiation reveals selective protein down-regulation
plain- Asserted: passes — The authors put it forward as true.
- Checkable: passes — It can be checked against evidence.
- Load-bearing: passes — The paper’s conclusions depend on it.
- Based: passes — The paper gives a reason why it holds.
- Rests on an assumption: The iTRAQ proteomic quantification accurately reflects relative protein expression changes in PHH culture.
A result the paper reports from its own data — it cites no other source for it, so there is none to check. The quote shows it is in the paper.
In the paper
“The number of significantly differentially expressed proteins increased at each time”
§ Mechanistic evaluation of primary human hepatocyte culture using global proteomic analysis reveals a selective dedifferentiation profile > Discussion
plaindirect- Asserted: passes — The authors put it forward as true.
- Checkable: passes — It can be checked against evidence.
- Load-bearing: passes — The paper’s conclusions depend on it.
- Based: passes — The paper gives a reason why it holds.
- Rests on an assumption: The iTRAQ proteomic quantification accurately reflects relative protein expression changes in PHH culture.
A result the paper reports from its own data — it cites no other source for it, so there is none to check. The quote shows it is in the paper.
In the paper
“some phase III proteins, including multidrug resistance protein 1 (MDR1) and major vault protein (MVP), demonstrating an up-regulation during culture.”
§ Mechanistic evaluation of primary human hepatocyte culture using global proteomic analysis reveals a selective dedifferentiation profile > Results > Assessment of ADME proteins during dedifferentiation reveals selective protein down-regulation
boosteddirect- Asserted: passes — The authors put it forward as true.
- Checkable: passes — It can be checked against evidence.
- Load-bearing: passes — The paper’s conclusions depend on it.
- Based: passes — The paper gives a reason why it holds.
- Rests on an assumption: The iTRAQ proteomic quantification accurately reflects relative protein expression changes in PHH culture.
A result the paper reports from its own data — it cites no other source for it, so there is none to check. The quote shows it is in the paper.
In the paper
“the top three most down-regulated proteins at 168 h: CYP2A6, CYP2C8 and CYP4A11.”
§ Mechanistic evaluation of primary human hepatocyte culture using global proteomic analysis reveals a selective dedifferentiation profile > Discussion
plain- Asserted: passes — The authors put it forward as true.
- Checkable: passes — It can be checked against evidence.
- Load-bearing: passes — The paper’s conclusions depend on it.
- Based: passes — The paper gives a reason why it holds.
- Rests on an assumption: The iTRAQ proteomic quantification accurately reflects relative protein expression changes in PHH culture.
A result the paper reports from its own data — it cites no other source for it, so there is none to check. The quote shows it is in the paper.
In the paper
“A significant increase in PHH resistance to rotenone toxicity in all donors at 168 h regardless of background bioenergetic (OCR/ECAR) profile (Fig. 3c) was found.”
§ Mechanistic evaluation of primary human hepatocyte culture using global proteomic analysis reveals a selective dedifferentiation profile > Results > Analysis of mitochondrial functional profile reveals donor variation in the bioenergetic profile
plaindirect- Asserted: passes — The authors put it forward as true.
- Checkable: passes — It can be checked against evidence.
- Load-bearing: passes — The paper’s conclusions depend on it.
- Based: passes — The paper gives a reason why it holds.
- Rests on an assumption: Rotenone resistance is a valid functional readout of complex I mitochondrial function in PHH.
A result the paper reports from its own data — it cites no other source for it, so there is none to check. The quote shows it is in the paper.
In the paper
“Furthermore, many of the tested OCR parameters remain remarkably stable between 24 and 168 h (Fig. 3b (iii)), despite the large-scale changes to the mitochondrial proteome.”
§ Mechanistic evaluation of primary human hepatocyte culture using global proteomic analysis reveals a selective dedifferentiation profile > Results > Analysis of mitochondrial functional profile reveals donor variation in the bioenergetic profile
plainn = 5- Asserted: passes — The authors put it forward as true.
- Checkable: passes — It can be checked against evidence.
- Load-bearing: passes — The paper’s conclusions depend on it.
- Based: passes — The paper gives a reason why it holds.
The paper states this without a source or data behind it here, so there is nothing to check it against. The quote shows it is in the paper.
In the paper
“These changes lead to a reduction in many mitochondrial-associated proteins, particularly those involved in lipid and fatty acid metabolism.”
§ Mechanistic evaluation of primary human hepatocyte culture using global proteomic analysis reveals a selective dedifferentiation profile > Discussion
plaindirect- Asserted: passes — The authors put it forward as true.
- Checkable: passes — It can be checked against evidence.
- Load-bearing: passes — The paper’s conclusions depend on it.
- Based: passes — The paper gives a reason why it holds.
- Rests on an assumption: The iTRAQ proteomic quantification accurately reflects relative protein expression changes in PHH culture.
In the paper
“the protein expression of the transporters identified as being important for drug influx and efflux in the liver (Zamek-Gliszczynski et al. 2012) is relatively stable throughout the 168-h culture.”
§ Mechanistic evaluation of primary human hepatocyte culture using global proteomic analysis reveals a selective dedifferentiation profile > Results > Assessment of ADME proteins during dedifferentiation reveals selective protein down-regulation
What the sources say
- Not checked — no full text of the sourcecites Zamek-Gliszczynski et al. 2012 source
plain- Asserted: passes — The authors put it forward as true.
- Checkable: passes — It can be checked against evidence.
- Load-bearing: passes — The paper’s conclusions depend on it.
- Based: passes — The paper gives a reason why it holds.
- Rests on an assumption: The iTRAQ proteomic quantification accurately reflects relative protein expression changes in PHH culture.
A result the paper reports from its own data — it cites no other source for it, so there is none to check. The quote shows it is in the paper.
In the paper
“these are both influx transporters (SLCO1B1 and SLCO1B3).”
§ Mechanistic evaluation of primary human hepatocyte culture using global proteomic analysis reveals a selective dedifferentiation profile > Results > Assessment of ADME proteins during dedifferentiation reveals selective protein down-regulation
plain- Asserted: passes — The authors put it forward as true.
- Checkable: passes — It can be checked against evidence.
- Load-bearing: passes — The paper’s conclusions depend on it.
- Based: passes — The paper gives a reason why it holds.
- Rests on an assumption: The iTRAQ proteomic quantification accurately reflects relative protein expression changes in PHH culture.
A result the paper reports from its own data — it cites no other source for it, so there is none to check. The quote shows it is in the paper.
In the paper
“whereas ZEB1, FOXO1 and NF-Y binding sites are almost exclusively predicted to be located upstream of the differentially expressed CYPs.”
§ Mechanistic evaluation of primary human hepatocyte culture using global proteomic analysis reveals a selective dedifferentiation profile > Results > Pathway analysis of ADME proteins reveals the pathways and transcription factors predicted to underlie the loss of specific metabolic functions
plaincorrelational- Asserted: passes — The authors put it forward as true.
- Checkable: passes — It can be checked against evidence.
- Load-bearing: passes — The paper’s conclusions depend on it.
- Based: passes — The paper gives a reason why it holds.
- Rests on an assumption: Predicted transcription factor binding sites are functionally relevant to CYP expression.
A result the paper reports from its own data — it cites no other source for it, so there is none to check. The quote shows it is in the paper.
In the paper
“The heatmap highlights the loss of metabolic competence with the majority of phase I enzymes following a relatively linear pattern of down-regulation towards 168 h.”
§ Mechanistic evaluation of primary human hepatocyte culture using global proteomic analysis reveals a selective dedifferentiation profile > Results > Assessment of ADME proteins during dedifferentiation reveals selective protein down-regulation
plaincorrelational- Asserted: passes — The authors put it forward as true.
- Checkable: passes — It can be checked against evidence.
- Load-bearing: passes — The paper’s conclusions depend on it.
- Based: passes — The paper gives a reason why it holds.
- Rests on an assumption: The iTRAQ proteomic quantification accurately reflects relative protein expression changes in PHH culture.
A result the paper reports from its own data — it cites no other source for it, so there is none to check. The quote shows it is in the paper.
In the paper
“given the remarkable stability of oxidative phosphorylation following plating, during a period of substantial phenotypic change”
§ Mechanistic evaluation of primary human hepatocyte culture using global proteomic analysis reveals a selective dedifferentiation profile > Discussion
plain- Asserted: passes — The authors put it forward as true.
- Checkable: passes — It can be checked against evidence.
- Load-bearing: passes — The paper’s conclusions depend on it.
- Based: passes — The paper gives a reason why it holds.
- Rests on an assumption: The iTRAQ proteomic quantification accurately reflects relative protein expression changes in PHH culture.
In the paper
“The results corroborate previous reports showing the importance of HNF1α alongside HNF1β, C/EBP and FOXA1 in dedifferentiation (Padgham et al. 1993).”
§ Mechanistic evaluation of primary human hepatocyte culture using global proteomic analysis reveals a selective dedifferentiation profile > Discussion
What the sources say
- Not checked — no full text of the sourcecites Padgham et al. 1993 source
plaindirect- Asserted: passes — The authors put it forward as true.
- Checkable: passes — It can be checked against evidence.
- Load-bearing: unclear — It is unclear whether the paper’s conclusions depend on it.
- Based: passes — The paper gives a reason why it holds.
- Rests on an assumption: Predicted transcription factor binding sites are functionally relevant to CYP expression.
A result the paper reports from its own data — it cites no other source for it, so there is none to check. The quote shows it is in the paper.
In the paper
“The general trend of expression relative to freshly isolated PHHs is downward”
§ Mechanistic evaluation of primary human hepatocyte culture using global proteomic analysis reveals a selective dedifferentiation profile > Results > Assessment of ADME proteins during dedifferentiation reveals selective protein down-regulation
plaincorrelationaln = 5- Asserted: passes — The authors put it forward as true.
- Checkable: passes — It can be checked against evidence.
- Load-bearing: passes — The paper’s conclusions depend on it.
- Based: passes — The paper gives a reason why it holds.
- Rests on an assumption: The iTRAQ proteomic quantification accurately reflects relative protein expression changes in PHH culture.
In the paper
“All CYPs with a reported gene expression >30 % at 72 h maintained protein expression >60 % at 168 h.”
§ Mechanistic evaluation of primary human hepatocyte culture using global proteomic analysis reveals a selective dedifferentiation profile > Results > Assessment of ADME proteins during dedifferentiation reveals selective protein down-regulation
What the sources say
- Not checked — no full text of the sourcecites Richert et al. 2006 source
plaincorrelational- Asserted: passes — The authors put it forward as true.
- Checkable: passes — It can be checked against evidence.
- Load-bearing: passes — The paper’s conclusions depend on it.
- Based: passes — The paper gives a reason why it holds.
- Rests on an assumption: The mRNA data from Richert et al. 2006 in monolayer culture are comparable to the protein data in this study.
A result the paper reports from its own data — it cites no other source for it, so there is none to check. The quote shows it is in the paper.
In the paper
“SMARCB1 is also significantly associated with the ADME proteomic profile at 168 h.”
§ Mechanistic evaluation of primary human hepatocyte culture using global proteomic analysis reveals a selective dedifferentiation profile > Results > Pathway analysis of ADME proteins reveals the pathways and transcription factors predicted to underlie the loss of specific metabolic functions
plaincorrelational- Asserted: passes — The authors put it forward as true.
- Checkable: passes — It can be checked against evidence.
- Load-bearing: unclear — It is unclear whether the paper’s conclusions depend on it.
- Based: passes — The paper gives a reason why it holds.
- Rests on an assumption: Predicted transcription factor binding sites are functionally relevant to CYP expression.
A result the paper reports from its own data — it cites no other source for it, so there is none to check. The quote shows it is in the paper.
In the paper
“This analysis predicted binding sites for HSF2 to be highly enriched in the CYPs which were not differentially expressed”
§ Mechanistic evaluation of primary human hepatocyte culture using global proteomic analysis reveals a selective dedifferentiation profile > Results > Pathway analysis of ADME proteins reveals the pathways and transcription factors predicted to underlie the loss of specific metabolic functions
plaincorrelational- Asserted: passes — The authors put it forward as true.
- Checkable: passes — It can be checked against evidence.
- Load-bearing: passes — The paper’s conclusions depend on it.
- Based: passes — The paper gives a reason why it holds.
- Rests on an assumption: Predicted transcription factor binding sites are functionally relevant to CYP expression.
A result the paper reports from its own data — it cites no other source for it, so there is none to check. The quote shows it is in the paper.
In the paper
“Our results strongly predict a down-regulation of SMARCB1”
§ Mechanistic evaluation of primary human hepatocyte culture using global proteomic analysis reveals a selective dedifferentiation profile > Discussion
boosteddirect- Asserted: passes — The authors put it forward as true.
- Checkable: passes — It can be checked against evidence.
- Load-bearing: unclear — It is unclear whether the paper’s conclusions depend on it.
- Based: passes — The paper gives a reason why it holds.
- Rests on an assumption: Predicted transcription factor binding sites are functionally relevant to CYP expression.
A result the paper reports from its own data — it cites no other source for it, so there is none to check. The quote shows it is in the paper.
In the paper
“the majority of the detected CYP proteins are maintained in expression at 24 h in relation to the freshly isolated cells”
§ Mechanistic evaluation of primary human hepatocyte culture using global proteomic analysis reveals a selective dedifferentiation profile > Results > Assessment of ADME proteins during dedifferentiation reveals selective protein down-regulation
plainn = 5- Asserted: passes — The authors put it forward as true.
- Checkable: passes — It can be checked against evidence.
- Load-bearing: passes — The paper’s conclusions depend on it.
- Based: passes — The paper gives a reason why it holds.
- Rests on an assumption: The iTRAQ proteomic quantification accurately reflects relative protein expression changes in PHH culture.
A result the paper reports from its own data — it cites no other source for it, so there is none to check. The quote shows it is in the paper.
In the paper
“Phase II/III enzymes appear to show greater stability”
§ Mechanistic evaluation of primary human hepatocyte culture using global proteomic analysis reveals a selective dedifferentiation profile > Results > Assessment of ADME proteins during dedifferentiation reveals selective protein down-regulation
hedged- Asserted: passes — The authors put it forward as true.
- Checkable: passes — It can be checked against evidence.
- Load-bearing: passes — The paper’s conclusions depend on it.
- Based: passes — The paper gives a reason why it holds.
- Rests on an assumption: The iTRAQ proteomic quantification accurately reflects relative protein expression changes in PHH culture.
A result the paper reports from its own data — it cites no other source for it, so there is none to check. The quote shows it is in the paper.
In the paper
“analysis of CYP450 activity using probe substrates for CYP3A and 2D6 shows a loss of functional capacity that is mostly consistent with the loss of protein recorded by iTRAQ and western immunoblotting”
§ Mechanistic evaluation of primary human hepatocyte culture using global proteomic analysis reveals a selective dedifferentiation profile > Results > Assessment of ADME proteins during dedifferentiation reveals selective protein down-regulation
hedgedcorrelational- Asserted: passes — The authors put it forward as true.
- Checkable: passes — It can be checked against evidence.
- Load-bearing: passes — The paper’s conclusions depend on it.
- Based: passes — The paper gives a reason why it holds.
- Rests on an assumption: The iTRAQ proteomic quantification accurately reflects relative protein expression changes in PHH culture.
A result the paper reports from its own data — it cites no other source for it, so there is none to check. The quote shows it is in the paper.
In the paper
“here, we show CYP2A6 to be the largest discriminator between freshly isolated and 168 h cultured hepatocytes.”
§ Mechanistic evaluation of primary human hepatocyte culture using global proteomic analysis reveals a selective dedifferentiation profile > Discussion
plaincorrelational- Asserted: passes — The authors put it forward as true.
- Checkable: passes — It can be checked against evidence.
- Load-bearing: passes — The paper’s conclusions depend on it.
- Based: passes — The paper gives a reason why it holds.
- Rests on an assumption: The iTRAQ proteomic quantification accurately reflects relative protein expression changes in PHH culture.
A result the paper reports from its own data — it cites no other source for it, so there is none to check. The quote shows it is in the paper.
In the paper
“FECH (ferrochelatase), a key enzyme in the production of heme, found to be significantly down-regulated at 168 h (table S2)”
§ Mechanistic evaluation of primary human hepatocyte culture using global proteomic analysis reveals a selective dedifferentiation profile > Results > Pathway analysis of ADME proteins reveals the pathways and transcription factors predicted to underlie the loss of specific metabolic functions
plain- Asserted: passes — The authors put it forward as true.
- Checkable: passes — It can be checked against evidence.
- Load-bearing: unclear — It is unclear whether the paper’s conclusions depend on it.
- Based: passes — The paper gives a reason why it holds.
- Rests on an assumption: The iTRAQ proteomic quantification accurately reflects relative protein expression changes in PHH culture.
A result the paper reports from its own data — it cites no other source for it, so there is none to check. The quote shows it is in the paper.
In the paper
“Comparisons between differentially expressed and non-differentially expressed drug-metabolising proteins revealed no single factor which could mediate all the ADME-associated proteomic changes.”
§ Mechanistic evaluation of primary human hepatocyte culture using global proteomic analysis reveals a selective dedifferentiation profile > Discussion
plain- Asserted: passes — The authors put it forward as true.
- Checkable: passes — It can be checked against evidence.
- Load-bearing: passes — The paper’s conclusions depend on it.
- Based: passes — The paper gives a reason why it holds.
- Rests on an assumption: Predicted transcription factor binding sites are functionally relevant to CYP expression.
A conclusion the paper draws from its own results — it cites no other source for it, so there is none to check. The quote shows it is in the paper.
In the paper
“Taken together, these data indicate a time point-dependent cellular response to isolation and culture (figure S1).”
§ Mechanistic evaluation of primary human hepatocyte culture using global proteomic analysis reveals a selective dedifferentiation profile > Results > Pathway analysis reveals the key changes and dynamic profile of dedifferentiation
hedgedcorrelational- Asserted: passes — The authors put it forward as true.
- Checkable: passes — It can be checked against evidence.
- Load-bearing: passes — The paper’s conclusions depend on it.
- Based: passes — The paper gives a reason why it holds.
A conclusion the paper draws from its own results — it cites no other source for it, so there is none to check. The quote shows it is in the paper.
In the paper
“Thus, these data suggest that phenotypic characteristics of the donor have a greater impact on the protein dedifferentiating expression profile of the hepatocytes than does the length of time in culture, particularly over the first 72 h of culture.”
§ Mechanistic evaluation of primary human hepatocyte culture using global proteomic analysis reveals a selective dedifferentiation profile > Results > Global proteomics reveals donor-dependent variation as a major influence on dedifferentiation
hedgedcorrelationaln = 3- Asserted: passes — The authors put it forward as true.
- Checkable: passes — It can be checked against evidence.
- Load-bearing: passes — The paper’s conclusions depend on it.
- Based: passes — The paper gives a reason why it holds.
A conclusion the paper draws from its own results — it cites no other source for it, so there is none to check. The quote shows it is in the paper.
In the paper
“We report the key factors and pathways which underlie the loss of hepatic phenotype in vitro, particularly those driving the large-scale and selective remodelling of the mitochondrial and metabolic proteomes.”
§ Mechanistic evaluation of primary human hepatocyte culture using global proteomic analysis reveals a selective dedifferentiation profile > Abstract
plaindirect- Asserted: passes — The authors put it forward as true.
- Checkable: passes — It can be checked against evidence.
- Load-bearing: passes — The paper’s conclusions depend on it.
- Based: passes — The paper gives a reason why it holds.
- Rests on an assumption: The aetiology of dedifferentiation has not been well defined.
- Rests on an assumption: The exact mechanisms governing hepatocyte dedifferentiation remain incompletely understood.
A conclusion the paper draws from its own results — it cites no other source for it, so there is none to check. The quote shows it is in the paper.
In the paper
“This indicates that the large-scale down-regulation of mitochondrial proteins represents an alteration in function between freshly isolated cells and 168 h rather than a generalised loss of mitochondrial mass between these time points.”
§ Mechanistic evaluation of primary human hepatocyte culture using global proteomic analysis reveals a selective dedifferentiation profile > Results > Analysis of mitochondrial functional profile reveals donor variation in the bioenergetic profile
hedgeddirect- Asserted: passes — The authors put it forward as true.
- Checkable: passes — It can be checked against evidence.
- Load-bearing: passes — The paper’s conclusions depend on it.
- Based: passes — The paper gives a reason why it holds.
A conclusion the paper draws from its own results — it cites no other source for it, so there is none to check. The quote shows it is in the paper.
In the paper
“Energy production is another fundamental cellular process affected by dedifferentiation that is highlighted by this study.”
§ Mechanistic evaluation of primary human hepatocyte culture using global proteomic analysis reveals a selective dedifferentiation profile > Discussion
plaindirect- Asserted: passes — The authors put it forward as true.
- Checkable: passes — It can be checked against evidence.
- Load-bearing: passes — The paper’s conclusions depend on it.
- Based: passes — The paper gives a reason why it holds.
- Rests on an assumption: The iTRAQ proteomic quantification accurately reflects relative protein expression changes in PHH culture.
A conclusion the paper draws from its own results — it cites no other source for it, so there is none to check. The quote shows it is in the paper.
In the paper
“The proteomic and functional data suggest a dramatic remodelling of the bioenergetic proteome during monolayer culture.”
§ Mechanistic evaluation of primary human hepatocyte culture using global proteomic analysis reveals a selective dedifferentiation profile > Discussion
hedgeddirect- Asserted: passes — The authors put it forward as true.
- Checkable: passes — It can be checked against evidence.
- Load-bearing: passes — The paper’s conclusions depend on it.
- Based: passes — The paper gives a reason why it holds.
- Rests on an assumption: The iTRAQ proteomic quantification accurately reflects relative protein expression changes in PHH culture.
A conclusion the paper draws from its own results — it cites no other source for it, so there is none to check. The quote shows it is in the paper.
In the paper
“Taken together, these results highlight the importance of epigenetic regulation in the dedifferentiation process”
§ Mechanistic evaluation of primary human hepatocyte culture using global proteomic analysis reveals a selective dedifferentiation profile > Discussion
plaincorrelational- Asserted: passes — The authors put it forward as true.
- Checkable: passes — It can be checked against evidence.
- Load-bearing: passes — The paper’s conclusions depend on it.
- Based: passes — The paper gives a reason why it holds.
- Rests on an assumption: Predicted transcription factor binding sites are functionally relevant to CYP expression.
A conclusion the paper draws from its own results — it cites no other source for it, so there is none to check. The quote shows it is in the paper.
In the paper
“Together these data suggest that, despite the variability seen between donors, a conserved change in essential mitochondrial function is observed as a result of time in culture.”
§ Mechanistic evaluation of primary human hepatocyte culture using global proteomic analysis reveals a selective dedifferentiation profile > Results > Analysis of mitochondrial functional profile reveals donor variation in the bioenergetic profile
hedgeddirect- Asserted: passes — The authors put it forward as true.
- Checkable: passes — It can be checked against evidence.
- Load-bearing: passes — The paper’s conclusions depend on it.
- Based: passes — The paper gives a reason why it holds.
- Rests on an assumption: The iTRAQ proteomic quantification accurately reflects relative protein expression changes in PHH culture.
- Rests on an assumption: Rotenone resistance is a valid functional readout of complex I mitochondrial function in PHH.
A conclusion the paper draws from its own results — it cites no other source for it, so there is none to check. The quote shows it is in the paper.
In the paper
“thus, its loss of expression would likely reduce the intracellular heme concentration.”
§ Mechanistic evaluation of primary human hepatocyte culture using global proteomic analysis reveals a selective dedifferentiation profile > Discussion
hedgedconditional- Asserted: passes — The authors put it forward as true.
- Checkable: passes — It can be checked against evidence.
- Load-bearing: passes — The paper’s conclusions depend on it.
- Based: passes — The paper gives a reason why it holds.
- Rests on an assumption: Ferrochelatase catalyses the final step of the heme production pathway.
- Rests on an assumption: CYPs are dependent on heme for function.
A conclusion the paper draws from its own results — it cites no other source for it, so there is none to check. The quote shows it is in the paper.
In the paper
“suggesting that the loss of CYPs can be mainly associated with reduced transcription.”
§ Mechanistic evaluation of primary human hepatocyte culture using global proteomic analysis reveals a selective dedifferentiation profile > Results > Assessment of ADME proteins during dedifferentiation reveals selective protein down-regulation
hedgedcorrelational- Asserted: passes — The authors put it forward as true.
- Checkable: passes — It can be checked against evidence.
- Load-bearing: passes — The paper’s conclusions depend on it.
- Based: passes — The paper gives a reason why it holds.
- Rests on an assumption: The mRNA data from Richert et al. 2006 in monolayer culture are comparable to the protein data in this study.
A conclusion the paper draws from its own results — it cites no other source for it, so there is none to check. The quote shows it is in the paper.
In the paper
“the use of a rudimentary culture system has allowed the identification of a wide array of known and novel mechanisms through which dedifferentiation influences hepatic phenotype.”
§ Mechanistic evaluation of primary human hepatocyte culture using global proteomic analysis reveals a selective dedifferentiation profile > Discussion
plaindirect- Asserted: passes — The authors put it forward as true.
- Checkable: passes — It can be checked against evidence.
- Load-bearing: passes — The paper’s conclusions depend on it.
- Based: passes — The paper gives a reason why it holds.
- Rests on an assumption: The iTRAQ proteomic quantification accurately reflects relative protein expression changes in PHH culture.
A conclusion the paper draws from its own results — it cites no other source for it, so there is none to check. The quote shows it is in the paper.
In the paper
“revealing the strikingly selective nature of dedifferentiation.”
§ Mechanistic evaluation of primary human hepatocyte culture using global proteomic analysis reveals a selective dedifferentiation profile > Discussion
boosted- Asserted: passes — The authors put it forward as true.
- Checkable: passes — It can be checked against evidence.
- Load-bearing: passes — The paper’s conclusions depend on it.
- Based: passes — The paper gives a reason why it holds.
- Rests on an assumption: The iTRAQ proteomic quantification accurately reflects relative protein expression changes in PHH culture.
In the paper
“Cytochrome P450s has been strongly associated with a loss of expression during culture (Rodriguez-Antona et al. 2002)”
§ Mechanistic evaluation of primary human hepatocyte culture using global proteomic analysis reveals a selective dedifferentiation profile > Discussion
What the sources say
- Not checked — no full text of the sourcecites Rodriguez-Antona et al. 2002 source
boostedcorrelational- Asserted: passes — The authors put it forward as true.
- Checkable: passes — It can be checked against evidence.
- Load-bearing: passes — The paper’s conclusions depend on it.
- Based: passes — The paper gives a reason why it holds.
A conclusion the paper draws from its own results — it cites no other source for it, so there is none to check. The quote shows it is in the paper.
In the paper
“the variable dedifferentiation of hepatocytes demonstrated in this study is likely to have an impact on attempts to achieve consistent biological assessment of multiple chemical variables”
§ Mechanistic evaluation of primary human hepatocyte culture using global proteomic analysis reveals a selective dedifferentiation profile > Discussion
hedgedconditional- Asserted: passes — The authors put it forward as true.
- Checkable: passes — It can be checked against evidence.
- Load-bearing: passes — The paper’s conclusions depend on it.
- Based: passes — The paper gives a reason why it holds.
- Rests on an assumption: The majority of toxicological endpoints are assessed within 72 h of isolation.
A conclusion the paper draws from its own results — it cites no other source for it, so there is none to check. The quote shows it is in the paper.
In the paper
“suggesting that these mechanisms are well conserved across donors.”
§ Mechanistic evaluation of primary human hepatocyte culture using global proteomic analysis reveals a selective dedifferentiation profile > Discussion
hedged- Asserted: passes — The authors put it forward as true.
- Checkable: passes — It can be checked against evidence.
- Load-bearing: unclear — It is unclear whether the paper’s conclusions depend on it.
- Based: passes — The paper gives a reason why it holds.
- Rests on an assumption: The iTRAQ proteomic quantification accurately reflects relative protein expression changes in PHH culture.
A conclusion the paper draws from its own results — it cites no other source for it, so there is none to check. The quote shows it is in the paper.
In the paper
“indicating a selective, rather than wholesale alteration, in the hepatocyte metabolic profile.”
§ Mechanistic evaluation of primary human hepatocyte culture using global proteomic analysis reveals a selective dedifferentiation profile > Results > Assessment of ADME proteins during dedifferentiation reveals selective protein down-regulation
hedged- Asserted: passes — The authors put it forward as true.
- Checkable: passes — It can be checked against evidence.
- Load-bearing: passes — The paper’s conclusions depend on it.
- Based: passes — The paper gives a reason why it holds.
- Rests on an assumption: The iTRAQ proteomic quantification accurately reflects relative protein expression changes in PHH culture.
A conclusion the paper draws from its own results — it cites no other source for it, so there is none to check. The quote shows it is in the paper.
In the paper
“these data suggest that the strictly defined culture system promotes a specific protein expression profile”
§ Mechanistic evaluation of primary human hepatocyte culture using global proteomic analysis reveals a selective dedifferentiation profile > Discussion
hedgeddirect- Asserted: passes — The authors put it forward as true.
- Checkable: passes — It can be checked against evidence.
- Load-bearing: passes — The paper’s conclusions depend on it.
- Based: passes — The paper gives a reason why it holds.
- Rests on an assumption: The culture system's conditions are strictly defined and consistent across donors.
A conclusion the paper draws from its own results — it cites no other source for it, so there is none to check. The quote shows it is in the paper.
In the paper
“suggests an increasing deviation from the freshly isolated donor phenotype.”
§ Mechanistic evaluation of primary human hepatocyte culture using global proteomic analysis reveals a selective dedifferentiation profile > Discussion
hedgedcorrelational- Asserted: passes — The authors put it forward as true.
- Checkable: passes — It can be checked against evidence.
- Load-bearing: passes — The paper’s conclusions depend on it.
- Based: passes — The paper gives a reason why it holds.
- Rests on an assumption: The iTRAQ proteomic quantification accurately reflects relative protein expression changes in PHH culture.
In the paper
“at 72 h, the mRNA of CYP1A2, 2A6, 2B6, 2C8, 2E1, 3A4, 4A11, 4F2, 4F3 and 27A1 is reported to drop to below 10 % of freshly isolated PHH (Richert et al. 2006).”
§ Mechanistic evaluation of primary human hepatocyte culture using global proteomic analysis reveals a selective dedifferentiation profile > Results > Assessment of ADME proteins during dedifferentiation reveals selective protein down-regulation
What the sources say
- Not checked — no full text of the sourcecites Richert et al. 2006 source
plaindirect- Asserted: passes — The authors put it forward as true.
- Checkable: passes — It can be checked against evidence.
- Load-bearing: passes — The paper’s conclusions depend on it.
- Based: passes — The paper gives a reason why it holds.
A conclusion the paper draws from its own results — it cites no other source for it, so there is none to check. The quote shows it is in the paper.
In the paper
“suggestive of a convergence towards a culture-dependent level of basal glycolysis.”
§ Mechanistic evaluation of primary human hepatocyte culture using global proteomic analysis reveals a selective dedifferentiation profile > Results > Analysis of mitochondrial functional profile reveals donor variation in the bioenergetic profile
hedgedcorrelationaln = 5- Asserted: passes — The authors put it forward as true.
- Checkable: passes — It can be checked against evidence.
- Load-bearing: passes — The paper’s conclusions depend on it.
- Based: passes — The paper gives a reason why it holds.
A conclusion the paper draws from its own results — it cites no other source for it, so there is none to check. The quote shows it is in the paper.
In the paper
“In this study, we have demonstrated the first use of global proteomics as a tool for investigating primary human hepatocyte dedifferentiation”
§ Mechanistic evaluation of primary human hepatocyte culture using global proteomic analysis reveals a selective dedifferentiation profile > Discussion
boosted- Asserted: passes — The authors put it forward as true.
- Checkable: passes — It can be checked against evidence.
- Load-bearing: passes — The paper’s conclusions depend on it.
- Based: unclear — It is unclear why the paper says it holds.
A conclusion the paper draws from its own results — it cites no other source for it, so there is none to check. The quote shows it is in the paper.
In the paper
“it appears that these essential processes are preferentially maintained, potentially at the expense of non-survival-essential proteins/functions.”
§ Mechanistic evaluation of primary human hepatocyte culture using global proteomic analysis reveals a selective dedifferentiation profile > Discussion
hedgedconditional- Asserted: passes — The authors put it forward as true.
- Checkable: passes — It can be checked against evidence.
- Load-bearing: passes — The paper’s conclusions depend on it.
- Based: passes — The paper gives a reason why it holds.
- Rests on an assumption: The iTRAQ proteomic quantification accurately reflects relative protein expression changes in PHH culture.
A conclusion the paper draws from its own results — it cites no other source for it, so there is none to check. The quote shows it is in the paper.
In the paper
“Such results emphasise the apparent trade-off between cell survival and a mature hepatic phenotype in traditional in vitro systems.”
§ Mechanistic evaluation of primary human hepatocyte culture using global proteomic analysis reveals a selective dedifferentiation profile > Discussion
hedgedcorrelational- Asserted: passes — The authors put it forward as true.
- Checkable: passes — It can be checked against evidence.
- Load-bearing: passes — The paper’s conclusions depend on it.
- Based: passes — The paper gives a reason why it holds.
- Rests on an assumption: The iTRAQ proteomic quantification accurately reflects relative protein expression changes in PHH culture.
A conclusion the paper draws from its own results — it cites no other source for it, so there is none to check. The quote shows it is in the paper.
In the paper
“showing that at 24 h the metabolic potential of PHH is mostly maintained”
§ Mechanistic evaluation of primary human hepatocyte culture using global proteomic analysis reveals a selective dedifferentiation profile > Results > Assessment of ADME proteins during dedifferentiation reveals selective protein down-regulation
plainn = 5- Asserted: passes — The authors put it forward as true.
- Checkable: passes — It can be checked against evidence.
- Load-bearing: passes — The paper’s conclusions depend on it.
- Based: passes — The paper gives a reason why it holds.
- Rests on an assumption: The iTRAQ proteomic quantification accurately reflects relative protein expression changes in PHH culture.
A conclusion the paper draws from its own results — it cites no other source for it, so there is none to check. The quote shows it is in the paper.
In the paper
“as a consequence of the variable PHH phenotype at isolation, the proteome changes required to achieve this dedifferentiated phenotype are also variable.”
§ Mechanistic evaluation of primary human hepatocyte culture using global proteomic analysis reveals a selective dedifferentiation profile > Discussion
plaindirect- Asserted: passes — The authors put it forward as true.
- Checkable: passes — It can be checked against evidence.
- Load-bearing: passes — The paper’s conclusions depend on it.
- Based: passes — The paper gives a reason why it holds.
- Rests on an assumption: The culture system's conditions are strictly defined and consistent across donors.
- It may state two separate claims as one. 26
- Probably not a substantial claim. 8
The sources with a verdict support this claim; the rest weren’t checked yet, have no full text we could read, or their verdicts aren’t rated yet.
In the paper
“The application of primary human hepatocytes following isolation from human tissue is well accepted to be compromised by the process of dedifferentiation.”
- Also stated in: § Introduction · plain
“following isolation, primary human hepatocytes undergo a rapid dedifferentiation process in which many unique hepatocyte characteristics are lost, reducing the physiological relevance of the model (Fraczek et al. 2013; Godoy et al. 2013).”
§ Mechanistic evaluation of primary human hepatocyte culture using global proteomic analysis reveals a selective dedifferentiation profile > Abstract
What the sources say
- Not checked — no full text of the sourcecites Fraczek et al. 2013 source
- Supportedcites Godoy et al. 2013 source
The 3D liver models section states that dedifferentiation in 2D culture reduces major liver functions and that primary hepatocytes rapidly deviate from their differentiated phenotype in vitro. This supports the citing sentence’s point that dedifferentiation compromises their use after isolation. (LLM, conf=0.91)
boosteddirect- Asserted: passes — The authors put it forward as true.
- Checkable: passes — It can be checked against evidence.
- Load-bearing: passes — The paper’s conclusions depend on it.
- Based: passes — The paper gives a reason why it holds.
It may state two separate claims as one.
- Also stated in: § Introduction · plain
The cited sources support only part of this claim — read each source’s verdict below.
In the paper
“In fact, zonation appears to be a large influencing factor on variation during culture as our pathway analysis of the most variable proteins revealed significant association with ketogenesis, cholesterol biosynthesis, fatty acid β oxidation and glutamine synthesis (table S4), all of these are related to the portocentral axis gradient of the lobule (Godoy et al. 2013).”
§ Mechanistic evaluation of primary human hepatocyte culture using global proteomic analysis reveals a selective dedifferentiation profile > Results > Global proteomics reveals donor-dependent variation as a major influence on dedifferentiation
What the sources say
- Partly supportedcites Godoy et al. 2013 sourceExperimental — accuracy not yet measured
Split into 2 atoms — 0 confirmed, 2 partially supported, 0 disputed, 0 misattributed, 0 unverifiable. Expand the claim to see per-atom verdicts.
hedgedcorrelationaln = 5- Asserted: passes — The authors put it forward as true.
- Checkable: passes — It can be checked against evidence.
- Load-bearing: passes — The paper’s conclusions depend on it.
- Based: passes — The paper gives a reason why it holds.
It may state two separate claims as one.
- Partly supported
The cited sources support only part of this claim — read each source’s verdict below.
In the paper
“Primary human hepatocytes (PHHs) are an important tool for studying human liver disease and drug-induced liver injury (DILI), with other models, such as rat hepatocytes, hepatic cell lines and stem cell-derived hepatocyte-like cells failing to offer metabolically competent and species-relevant alternatives (Godoy et al. 2013).”
§ Mechanistic evaluation of primary human hepatocyte culture using global proteomic analysis reveals a selective dedifferentiation profile > Introduction
What the sources say
- Partly supportedcites Godoy et al. 2013 sourceExperimental — accuracy not yet measured
Split into 2 atoms — 0 confirmed, 2 partially supported, 0 disputed, 0 misattributed, 0 unverifiable. Expand the claim to see per-atom verdicts.
plaindirect- Asserted: passes — The authors put it forward as true.
- Checkable: passes — It can be checked against evidence.
- Load-bearing: passes — The paper’s conclusions depend on it.
- Based: passes — The paper gives a reason why it holds.
It may state two separate claims as one.
- Partly supported
The cited sources support only part of this claim — read each source’s verdict below.
In the paper
“CYP2A6 has been reported to be the largest discriminant between foetal and adult hepatocytes (Rowe et al. 2013)”
§ Mechanistic evaluation of primary human hepatocyte culture using global proteomic analysis reveals a selective dedifferentiation profile > Discussion
What the sources say
- Partly supportedcites Rowe et al. 2013 sourceExperimental — accuracy not yet measured
The Discussion reports that CYP2A6 was 5.75-fold more abundant in adult hepatocytes than in fetal liver, and the Results (Fig. 8A) show strong detection in most adult samples but weak or absent detection in fetal samples. The paper identifies multiple proteins that discriminate the groups; it does not identify CYP2A6 as the largest discriminant. (LLM, conf=0.86)
plaincorrelational- Asserted: passes — The authors put it forward as true.
- Checkable: passes — It can be checked against evidence.
- Load-bearing: passes — The paper’s conclusions depend on it.
- Based: passes — The paper gives a reason why it holds.
Probably not a substantial claim.
- Partly supported
A result the paper reports from its own data — it cites no other source for it, so there is none to check. The quote shows it is in the paper.
In the paper
“Dedifferentiation and loss of characteristic hepatocyte morphology were confirmed by microscopy.”
§ Mechanistic evaluation of primary human hepatocyte culture using global proteomic analysis reveals a selective dedifferentiation profile > Results > Global proteomics reveals donor-dependent variation as a major influence on dedifferentiation
plain- Asserted: passes — The authors put it forward as true.
- Checkable: passes — It can be checked against evidence.
- Load-bearing: passes — The paper’s conclusions depend on it.
- Based: passes — The paper gives a reason why it holds.
It may state two separate claims as one.
A result the paper reports from its own data — it cites no other source for it, so there is none to check. The quote shows it is in the paper.
In the paper
“Interestingly, the first noticeable effects at 24 h are an increase in stress-related mediator superoxide dismutase and a decrease in histone proteins.”
§ Mechanistic evaluation of primary human hepatocyte culture using global proteomic analysis reveals a selective dedifferentiation profile > Results > Global proteomics reveals donor-dependent variation as a major influence on dedifferentiation
plaindirect- Asserted: passes — The authors put it forward as true.
- Checkable: passes — It can be checked against evidence.
- Load-bearing: unclear — It is unclear whether the paper’s conclusions depend on it.
- Based: passes — The paper gives a reason why it holds.
It may state two separate claims as one.
A result the paper reports from its own data — it cites no other source for it, so there is none to check. The quote shows it is in the paper.
In the paper
“Whilst metabolic pathways display a trend of increasing significance during culture, acute phase response signalling and ROS/NOS production are significantly affected at 24 h, but not at 168 h.”
§ Mechanistic evaluation of primary human hepatocyte culture using global proteomic analysis reveals a selective dedifferentiation profile > Results > Pathway analysis reveals the key changes and dynamic profile of dedifferentiation
plaincorrelational- Asserted: passes — The authors put it forward as true.
- Checkable: passes — It can be checked against evidence.
- Load-bearing: passes — The paper’s conclusions depend on it.
- Based: passes — The paper gives a reason why it holds.
It may state two separate claims as one.
A result the paper reports from its own data — it cites no other source for it, so there is none to check. The quote shows it is in the paper.
In the paper
“A total of 3430 proteins were identified with a false detection rate of <1 %, of which 1117 were quantified at every time point.”
- Also stated in: § Global proteomics reveals donor-dependent variation as a major influence on dedifferentiation · plain
“A total of 3430 unique proteins were detected across three iTRAQ runs (table S1), with 1117 identified across all samples.”
§ Mechanistic evaluation of primary human hepatocyte culture using global proteomic analysis reveals a selective dedifferentiation profile > Abstract
plain- Asserted: passes — The authors put it forward as true.
- Checkable: passes — It can be checked against evidence.
- Load-bearing: unclear — It is unclear whether the paper’s conclusions depend on it.
- Based: passes — The paper gives a reason why it holds.
It may state two separate claims as one.
- Also stated in: § Global proteomics reveals donor-dependent variation as a major influence on dedifferentiation · plain
A result the paper reports from its own data — it cites no other source for it, so there is none to check. The quote shows it is in the paper.
In the paper
“Many of the pathways follow a linear pattern of increasing activation or inhibition; however, some, such as the cell survival pathways, display different dynamics, as they are predicted to be activated at 72 h, but not at 24 or 168 h.”
§ Mechanistic evaluation of primary human hepatocyte culture using global proteomic analysis reveals a selective dedifferentiation profile > Results > Pathway analysis reveals the key changes and dynamic profile of dedifferentiation
plaincorrelational- Asserted: passes — The authors put it forward as true.
- Checkable: passes — It can be checked against evidence.
- Load-bearing: passes — The paper’s conclusions depend on it.
- Based: passes — The paper gives a reason why it holds.
It may state two separate claims as one.
A result the paper reports from its own data — it cites no other source for it, so there is none to check. The quote shows it is in the paper.
In the paper
“The separation from the other donors is still evident at 168 h for donors 2 and 5, although these samples do cluster away from the earlier time points, whereas by this time the other three donors (1, 3 and 4) cluster together, demonstrating a convergence towards a dedifferentiated phenotype which is more reflective of time in culture than the cell source.”
§ Mechanistic evaluation of primary human hepatocyte culture using global proteomic analysis reveals a selective dedifferentiation profile > Results > Global proteomics reveals donor-dependent variation as a major influence on dedifferentiation
boostedcorrelationaln = 3- Asserted: passes — The authors put it forward as true.
- Checkable: passes — It can be checked against evidence.
- Load-bearing: passes — The paper’s conclusions depend on it.
- Based: passes — The paper gives a reason why it holds.
It may state two separate claims as one.
A result the paper reports from its own data — it cites no other source for it, so there is none to check. The quote shows it is in the paper.
In the paper
“The results suggest an activation of proliferative and inflammatory regulators and inhibition of metabolic-associated factors.”
§ Mechanistic evaluation of primary human hepatocyte culture using global proteomic analysis reveals a selective dedifferentiation profile > Results > Pathway analysis reveals the key changes and dynamic profile of dedifferentiation
hedgeddirect- Asserted: passes — The authors put it forward as true.
- Checkable: passes — It can be checked against evidence.
- Load-bearing: passes — The paper’s conclusions depend on it.
- Based: passes — The paper gives a reason why it holds.
It may state two separate claims as one.
A result the paper reports from its own data — it cites no other source for it, so there is none to check. The quote shows it is in the paper.
In the paper
“The analysis demonstrated a clear variation in individual bioenergetic OCR profiles at 24 h (Fig. 3b (i)), with the 168-h profile showing greater dependence on the 24 h profile, rather than time in culture.”
§ Mechanistic evaluation of primary human hepatocyte culture using global proteomic analysis reveals a selective dedifferentiation profile > Results > Analysis of mitochondrial functional profile reveals donor variation in the bioenergetic profile
boostedcorrelationaln = 5- Asserted: passes — The authors put it forward as true.
- Checkable: passes — It can be checked against evidence.
- Load-bearing: passes — The paper’s conclusions depend on it.
- Based: passes — The paper gives a reason why it holds.
It may state two separate claims as one.
A result the paper reports from its own data — it cites no other source for it, so there is none to check. The quote shows it is in the paper.
In the paper
“Figure 1a shows images of the cells taken at 24, 72 and 168 h and clearly demonstrates the maintenance of confluency and the loss of the typical hepatocyte polygonal morphology (24 h), towards a culture with flatter and less defined epithelial characteristics at 72 and 168 h.”
§ Mechanistic evaluation of primary human hepatocyte culture using global proteomic analysis reveals a selective dedifferentiation profile > Results > Global proteomics reveals donor-dependent variation as a major influence on dedifferentiation
boosteddirect- Asserted: passes — The authors put it forward as true.
- Checkable: passes — It can be checked against evidence.
- Load-bearing: passes — The paper’s conclusions depend on it.
- Based: passes — The paper gives a reason why it holds.
It may state two separate claims as one.
A result the paper reports from its own data — it cites no other source for it, so there is none to check. The quote shows it is in the paper.
In the paper
“Of note, hepatic-associated proteins are not universally down-regulated, as exemplified by alpha-1-antitrypsin and cytokeratins 8 and 18, which are up-regulated throughout the analysis (Table S2 and S6).”
§ Mechanistic evaluation of primary human hepatocyte culture using global proteomic analysis reveals a selective dedifferentiation profile > Results > Global proteomics reveals donor-dependent variation as a major influence on dedifferentiation
plain- Asserted: passes — The authors put it forward as true.
- Checkable: passes — It can be checked against evidence.
- Load-bearing: passes — The paper’s conclusions depend on it.
- Based: passes — The paper gives a reason why it holds.
It may state two separate claims as one.
A result the paper reports from its own data — it cites no other source for it, so there is none to check. The quote shows it is in the paper.
In the paper
“Despite this variation, a trend emerges: basal glycolysis shows an increase during culture in donors with lower basal glycolysis, whereas those with higher basal levels at 24 h decrease”
§ Mechanistic evaluation of primary human hepatocyte culture using global proteomic analysis reveals a selective dedifferentiation profile > Results > Analysis of mitochondrial functional profile reveals donor variation in the bioenergetic profile
hedgeddirectn = 5- Asserted: passes — The authors put it forward as true.
- Checkable: passes — It can be checked against evidence.
- Load-bearing: unclear — It is unclear whether the paper’s conclusions depend on it.
- Based: passes — The paper gives a reason why it holds.
It may state two separate claims as one.
A result the paper reports from its own data — it cites no other source for it, so there is none to check. The quote shows it is in the paper.
In the paper
“Here we have additionally shown both AMPK and mitochondrial fusion pathways to be associated with the bioenergetic adaption to a monolayer culture system.”
§ Mechanistic evaluation of primary human hepatocyte culture using global proteomic analysis reveals a selective dedifferentiation profile > Discussion
boostedcorrelational- Asserted: passes — The authors put it forward as true.
- Checkable: passes — It can be checked against evidence.
- Load-bearing: passes — The paper’s conclusions depend on it.
- Based: passes — The paper gives a reason why it holds.
It may state two separate claims as one.
- Rests on an assumption: The iTRAQ proteomic quantification accurately reflects relative protein expression changes in PHH culture.
A result the paper reports from its own data — it cites no other source for it, so there is none to check. The quote shows it is in the paper.
In the paper
“despite the increase in CYP3A4 protein at 168 h, no corresponding increase in CYP3A activity was detected”
§ Mechanistic evaluation of primary human hepatocyte culture using global proteomic analysis reveals a selective dedifferentiation profile > Results > Assessment of ADME proteins during dedifferentiation reveals selective protein down-regulation
plain- Asserted: passes — The authors put it forward as true.
- Checkable: passes — It can be checked against evidence.
- Load-bearing: passes — The paper’s conclusions depend on it.
- Based: passes — The paper gives a reason why it holds.
It may state two separate claims as one.
- Rests on an assumption: The iTRAQ proteomic quantification accurately reflects relative protein expression changes in PHH culture.
A result the paper reports from its own data — it cites no other source for it, so there is none to check. The quote shows it is in the paper.
In the paper
“Our analysis revealed that the early stages of dedifferentiation are predominantly donor-dependent with the inter-individual variation that exists in the starting donor phenotype being maintained throughout the first 72 h of culture.”
§ Mechanistic evaluation of primary human hepatocyte culture using global proteomic analysis reveals a selective dedifferentiation profile > Discussion
plaindirect- Asserted: passes — The authors put it forward as true.
- Checkable: passes — It can be checked against evidence.
- Load-bearing: passes — The paper’s conclusions depend on it.
- Based: passes — The paper gives a reason why it holds.
It may state two separate claims as one.
- Rests on an assumption: The iTRAQ proteomic quantification accurately reflects relative protein expression changes in PHH culture.
A result the paper reports from its own data — it cites no other source for it, so there is none to check. The quote shows it is in the paper.
In the paper
“Further investigation of the proteomic data revealed a significant down-regulation of three complex I subunits, whereas the remaining nine detected subunits were not significantly differentially expressed.”
§ Mechanistic evaluation of primary human hepatocyte culture using global proteomic analysis reveals a selective dedifferentiation profile > Results > Analysis of mitochondrial functional profile reveals donor variation in the bioenergetic profile
plain- Asserted: passes — The authors put it forward as true.
- Checkable: passes — It can be checked against evidence.
- Load-bearing: passes — The paper’s conclusions depend on it.
- Based: passes — The paper gives a reason why it holds.
It may state two separate claims as one.
- Rests on an assumption: The iTRAQ proteomic quantification accurately reflects relative protein expression changes in PHH culture.
A result the paper reports from its own data — it cites no other source for it, so there is none to check. The quote shows it is in the paper.
In the paper
“ECAR measurements showed similar stability; however, there was a general trend of increased glycolytic parameters, including the only significantly altered factor, namely glycolytic reserve (Fig. 3b (iv)).”
§ Mechanistic evaluation of primary human hepatocyte culture using global proteomic analysis reveals a selective dedifferentiation profile > Results > Analysis of mitochondrial functional profile reveals donor variation in the bioenergetic profile
plaincorrelationaln = 5- Asserted: passes — The authors put it forward as true.
- Checkable: passes — It can be checked against evidence.
- Load-bearing: unclear — It is unclear whether the paper’s conclusions depend on it.
- Based: passes — The paper gives a reason why it holds.
It may state two separate claims as one.
A result the paper reports from its own data — it cites no other source for it, so there is none to check. The quote shows it is in the paper.
In the paper
“This analysis revealed similar percentages of proteins in each class, with the greatest proportion of proteins associated with metabolism in all subsets”
§ Mechanistic evaluation of primary human hepatocyte culture using global proteomic analysis reveals a selective dedifferentiation profile > Results > Assessment of ADME proteins during dedifferentiation reveals selective protein down-regulation
plaincorrelational- Asserted: passes — The authors put it forward as true.
- Checkable: passes — It can be checked against evidence.
- Load-bearing: passes — The paper’s conclusions depend on it.
- Based: passes — The paper gives a reason why it holds.
It may state two separate claims as one.
- Rests on an assumption: The iTRAQ proteomic quantification accurately reflects relative protein expression changes in PHH culture.
A result the paper reports from its own data — it cites no other source for it, so there is none to check. The quote shows it is in the paper.
In the paper
“Targeted analysis of the transcription factors that are associated with the ADME DEPs revealed the specific regulators, which are significantly perturbed and may cause the loss of ADME proteins during dedifferentiation (table S9).”
§ Mechanistic evaluation of primary human hepatocyte culture using global proteomic analysis reveals a selective dedifferentiation profile > Results > Pathway analysis of ADME proteins reveals the pathways and transcription factors predicted to underlie the loss of specific metabolic functions
hedgedcorrelational- Asserted: passes — The authors put it forward as true.
- Checkable: passes — It can be checked against evidence.
- Load-bearing: passes — The paper’s conclusions depend on it.
- Based: passes — The paper gives a reason why it holds.
It may state two separate claims as one.
- Rests on an assumption: Predicted transcription factor binding sites are functionally relevant to CYP expression.
A conclusion the paper draws from its own results — it cites no other source for it, so there is none to check. The quote shows it is in the paper.
In the paper
“Thus, while many proteins show conserved differential expression or high levels of inter-donor variability, a subset of proteins remains relatively stable and consequently may retain in vivo-like functionality and also serve as useful normalisers for protein expression changes.”
§ Mechanistic evaluation of primary human hepatocyte culture using global proteomic analysis reveals a selective dedifferentiation profile > Results > Global proteomics reveals donor-dependent variation as a major influence on dedifferentiation
hedgedconditionaln = 5- Asserted: passes — The authors put it forward as true.
- Checkable: passes — It can be checked against evidence.
- Load-bearing: passes — The paper’s conclusions depend on it.
- Based: passes — The paper gives a reason why it holds.
It may state two separate claims as one.
In the paper
“glutamine synthetase, which is associated with differential expression according to liver zonation (Jungermann and Kietzmann 1996)”
§ Mechanistic evaluation of primary human hepatocyte culture using global proteomic analysis reveals a selective dedifferentiation profile > Results > Global proteomics reveals donor-dependent variation as a major influence on dedifferentiation
What the sources say
- Not checked — no full text of the sourcecites Jungermann and Kietzmann 1996 source
plaincorrelational- Asserted: passes — The authors put it forward as true.
- Checkable: passes — It can be checked against evidence.
- Load-bearing: fails — The paper’s conclusions may not depend on it.
- Based: passes — The paper gives a reason why it holds.
Probably not a substantial claim. The paper’s conclusions may not depend on it.
A conclusion the paper draws from its own results — it cites no other source for it, so there is none to check. The quote shows it is in the paper.
In the paper
“Using iTRAQ-based stable isotope labelling and pathway analysis, we have identified the key changes in the PHH proteome during dedifferentiation and the inter-donor variability, which exists not only in donor phenotype, but also in the subsequent dedifferentiation profile.”
§ Mechanistic evaluation of primary human hepatocyte culture using global proteomic analysis reveals a selective dedifferentiation profile > Introduction
plaincorrelational- Asserted: passes — The authors put it forward as true.
- Checkable: passes — It can be checked against evidence.
- Load-bearing: passes — The paper’s conclusions depend on it.
- Based: passes — The paper gives a reason why it holds.
It may state two separate claims as one.
- Rests on an assumption: The aetiology of dedifferentiation has not been well defined.
- Rests on an assumption: The exact mechanisms governing hepatocyte dedifferentiation remain incompletely understood.
A conclusion the paper draws from its own results — it cites no other source for it, so there is none to check. The quote shows it is in the paper.
In the paper
“which may be attributable to the known gradient of glycolysis across the portocentral axis, and is consistent with our findings regarding the most variable proteins.”
§ Mechanistic evaluation of primary human hepatocyte culture using global proteomic analysis reveals a selective dedifferentiation profile > Results > Analysis of mitochondrial functional profile reveals donor variation in the bioenergetic profile
hedgedconditionaln = 5- Asserted: passes — The authors put it forward as true.
- Checkable: passes — It can be checked against evidence.
- Load-bearing: unclear — It is unclear whether the paper’s conclusions depend on it.
- Based: passes — The paper gives a reason why it holds.
It may state two separate claims as one.
In the paper
“CYP2C9, which is known to vary in expression between individuals (Sistonen et al. 2009)”
§ Mechanistic evaluation of primary human hepatocyte culture using global proteomic analysis reveals a selective dedifferentiation profile > Results > Global proteomics reveals donor-dependent variation as a major influence on dedifferentiation
What the sources say
- Not checked — no full text of the sourcecites Sistonen et al. 2009 source
boostedcorrelational- Asserted: passes — The authors put it forward as true.
- Checkable: passes — It can be checked against evidence.
- Load-bearing: fails — The paper’s conclusions may not depend on it.
- Based: passes — The paper gives a reason why it holds.
Probably not a substantial claim. The paper’s conclusions may not depend on it.
In the paper
“Interestingly, these proteins are readily detectable in hepatocyte-like cells derived from stem cells (Rambhatla et al. 2003), whereas many of the down-regulated proteins are not, demonstrating that simple in vitro culture systems may support similar expression patterns during both hepatic dedifferentiation and differentiation.”
§ Mechanistic evaluation of primary human hepatocyte culture using global proteomic analysis reveals a selective dedifferentiation profile > Results > Global proteomics reveals donor-dependent variation as a major influence on dedifferentiation
What the sources say
- Not checked — no full text of the sourcecites Rambhatla et al. 2003 source
boostedconditional- Asserted: passes — The authors put it forward as true.
- Checkable: passes — It can be checked against evidence.
- Load-bearing: passes — The paper’s conclusions depend on it.
- Based: passes — The paper gives a reason why it holds.
It may state two separate claims as one.
In the paper
“We have previously shown that the use of a global proteomic approach to phenotype rat hepatocytes can provide novel information on dedifferentiation (Rowe et al. 2010)”
§ Mechanistic evaluation of primary human hepatocyte culture using global proteomic analysis reveals a selective dedifferentiation profile > Introduction
What the sources say
- Not checked — no full text of the sourcecites Rowe et al. 2010 source
plainconditional- Asserted: passes — The authors put it forward as true.
- Checkable: passes — It can be checked against evidence.
- Load-bearing: passes — The paper’s conclusions depend on it.
- Based: passes — The paper gives a reason why it holds.
Probably not a substantial claim.
A conclusion the paper draws from its own results — it cites no other source for it, so there is none to check. The quote shows it is in the paper.
In the paper
“studies of more rudimentary models which result in more pronounced dedifferentiation may consequently provide a greater insight into the partially understood and currently unknown causes of dedifferentiation.”
§ Mechanistic evaluation of primary human hepatocyte culture using global proteomic analysis reveals a selective dedifferentiation profile > Introduction
hedgedconditional- Asserted: passes — The authors put it forward as true.
- Checkable: fails — It may be too vague to check against evidence.
- Load-bearing: passes — The paper’s conclusions depend on it.
- Based: passes — The paper gives a reason why it holds.
Probably not a substantial claim. It may be too vague to check against evidence.
- Rests on an assumption: The aetiology of dedifferentiation has not been well defined.
- Rests on an assumption: The exact mechanisms governing hepatocyte dedifferentiation remain incompletely understood.
What the paper did — it cites no source for this, so there is none to check. The quote shows it is in the paper.
In the paper
“Samples collected in iTRAQ buffer were quantified by Bradford assay and assessed by western blot to validate iTRAQ results.”
§ Mechanistic evaluation of primary human hepatocyte culture using global proteomic analysis reveals a selective dedifferentiation profile > Materials and methods > Western blotting
plain- Asserted: passes — The authors put it forward as true.
- Checkable: passes — It can be checked against evidence.
- Load-bearing: fails — The paper’s conclusions may not depend on it.
- Based: passes — The paper gives a reason why it holds.
Probably not a substantial claim. The paper’s conclusions may not depend on it.
A conclusion the paper draws from its own results — it cites no other source for it, so there is none to check. The quote shows it is in the paper.
In the paper
“Grouping of these data showed that dedifferentiation is not solely a change in expression of whole protein classes, but that it is a complex, differentially controlled and active process, in which selected pathways and functions from many classes are up- or down-regulated.”
§ Mechanistic evaluation of primary human hepatocyte culture using global proteomic analysis reveals a selective dedifferentiation profile > Discussion
plain- Asserted: passes — The authors put it forward as true.
- Checkable: passes — It can be checked against evidence.
- Load-bearing: passes — The paper’s conclusions depend on it.
- Based: passes — The paper gives a reason why it holds.
It may state two separate claims as one.
- Rests on an assumption: The iTRAQ proteomic quantification accurately reflects relative protein expression changes in PHH culture.
What the paper did — it cites no source for this, so there is none to check. The quote shows it is in the paper.
In the paper
“Following iTRAQ analysis, only proteins, which were present in all samples, identified with 95 % confidence (2 or more peptides) or 99 % confidence (single peptide) with a false detection rate (FDR) of less than 1 % were statistically analysed using R open-source software”
§ Mechanistic evaluation of primary human hepatocyte culture using global proteomic analysis reveals a selective dedifferentiation profile > Materials and methods > Proteomic data analysis
plain- Asserted: passes — The authors put it forward as true.
- Checkable: passes — It can be checked against evidence.
- Load-bearing: passes — The paper’s conclusions depend on it.
- Based: passes — The paper gives a reason why it holds.
Probably not a substantial claim.
What the paper did — it cites no source for this, so there is none to check. The quote shows it is in the paper.
In the paper
“Samples were run across three 8-plex iTRAQ runs (table S1), and results obtained relative to each donor’s fresh sample to control for inter-donor variation.”
§ Mechanistic evaluation of primary human hepatocyte culture using global proteomic analysis reveals a selective dedifferentiation profile > Materials and methods > iTRAQ
plaindirectn = 5- Asserted: passes — The authors put it forward as true.
- Checkable: passes — It can be checked against evidence.
- Load-bearing: passes — The paper’s conclusions depend on it.
- Based: passes — The paper gives a reason why it holds.
Probably not a substantial claim.
The paper relies on this without support.
The aetiology of dedifferentiation has not been well defined.
“The aetiology of dedifferentiation has not been well defined, and further understanding of the process would allow the development of novel strategies for sustaining the hepatocyte phenotype in culture or for improving protocols for maturation of hepatocytes generated from stem cells.”
The paper relies on this without support.
The exact mechanisms governing hepatocyte dedifferentiation remain incompletely understood.
“however, the exact mechanisms which govern these changes remain incompletely understood.”
The paper relies on this without support.
The full in vivo phenotype has not yet been achieved in culture.
“Despite these continued improvements and advances towards complex culture conditions which can maintain an improved phenotype over a period of weeks, the full in vivo phenotype has not yet been achieved.”
The paper relies on this without support.
The iTRAQ proteomic quantification accurately reflects relative protein expression changes in PHH culture.
“The general trend of expression relative to freshly isolated PHHs is downward; however, the majority of the detected CYP proteins are maintained in expression at 24 h in relation to the freshly isolated cells”
The paper relies on this without support.
Rotenone resistance is a valid functional readout of complex I mitochondrial function in PHH.
“To assess the functional consequence of these changes, rotenone was used as a model of complex I mitochondrial perturbation.”
The paper relies on this without support.
Predicted transcription factor binding sites are functionally relevant to CYP expression.
“Investigation into the predicted transcription factor binding sites of differentially expressed and non-differentially expressed CYPs revealed the factors that may underlie the selectivity found in the loss of xenobiotic CYPs (Table S10).”
The paper relies on this without support.
The majority of toxicological endpoints are assessed within 72 h of isolation.
“the majority of toxicological endpoints are assessed within 72 h of isolation”
The paper relies on this without support.
Ferrochelatase catalyses the final step of the heme production pathway.
“Ferrochelatase catalyses the final step of the heme production pathway”
The paper relies on this without support.
CYPs are dependent on heme for function.
“CYPs are dependent on heme for function”
The paper relies on this without support.
The mRNA data from Richert et al. 2006 in monolayer culture are comparable to the protein data in this study.
“Comparison of the trend in the CYP and transporter proteins with previously published hepatocyte monolayer gene expression data (Richert et al. 2006) allows further investigation of the loss of metabolic competence (table S8).”
The paper relies on this without support.
The culture system's conditions are strictly defined and consistent across donors.
“Taken together, these data suggest that the strictly defined culture system promotes a specific protein expression profile”
Claims other papers make about this one
Each is checked against this paper’s own text: does it say what the citing paper says it does?
The source backs part of the claim, not all of it — or backs it for a different population, condition or comparison.
In the citing paper
“rapid dedifferentiation of seeded primary hepatocytes within hours limits their utility to short-term experiments [ 2 , 3 ].”
From 3D microperfusion of mesoscale human microphysiological liver models improves functionality and recapitulates hepatic zonation (2023) · cites this paper as [3]
Experimental — accuracy not yet measured
Self-check
Percentages, sums and reported differences re-computed from the paper’s own numbers.
Each contradiction between two passages listed here was confirmed by an independent check.
Rated minor: it would not touch a result — a value no result rests on, a p-value that stays on the same side of the significance level, or a conflict that is clerical, resolved elsewhere in the paper, or outside its own findings.
In the paper
§ Mechanistic evaluation of primary human hepatocyte culture using global proteomic analysis reveals a selective dedifferentiation profile > Results > Pathway analysis reveals the key changes and dynamic profile of dedifferentiation
“If score 2 ≥ Z-score ≤ −2, the function is predicted to be activated or inhibited, respectively.”
§ Mechanistic evaluation of primary human hepatocyte culture using global proteomic analysis reveals a selective dedifferentiation profile > Materials and methods > Pathway analysis
“Using the IPA algorithm, functions or regulators that have a Z-score of ≥2 are predicted to be activated and ≤−2 are predicted to be inhibited.”
Citations
Cites
limma powers differential expression analyses for RNA-sequencing and microarray studies
Ritchie, M. E., Phipson, B., Wu, D., Hu, Y., Law, C. W., Shi, W., & Smyth, G. K. (2015) · Nucleic Acids Research · doi:10.1093/nar/gkv007 · Cited by 40,458
Global quantification of mammalian gene expression control
Schwanhäusser, B., Busse, D., Li, N., Dittmar, G., Schuchhardt, J., Wolf, J., Chen, W., & Selbach, M. (2011) · Nature · doi:10.1038/nature10098 · Cited by 6,566 · cited 1×
“This is exemplified by the recent results, showing that only ~40 % of the variation in cell protein levels can be explained by differences in the corresponding mRNA levels (Schwanhausser et al. 2011).”
ResultLarge-scale gene function analysis with the PANTHER classification system
Mi, H., Muruganujan, A., Casagrande, J. T., & Thomas, P. D. (2013) · Nature Protocols · doi:10.1038/nprot.2013.092 · Cited by 2,496
Control of Pancreas and Liver Gene Expression by HNF Transcription Factors
Odom, D. T., Zizlsperger, N., Gordon, D. B., Bell, G. W., Rinaldi, N. J., Murray, H. L., Volkert, T. L., Schreiber, J., Rolfe, A., Gifford, D. K., et al. (2004) · Science · doi:10.1126/science.1089769 · Cited by 1,348
SWI/SNF nucleosome remodellers and cancer
Wilson, B. G., & Roberts, C. W. M. (2011) · Nature reviews. Cancer · doi:10.1038/nrc3068 · Cited by 1,325
Godoy, P., Hewitt, N. J., Albrecht, U., Andersen, M. E., Ansari, N., Bhattacharya, S., Bode, J. G., Bolleyn, J., Borner, C., Böttger, J., et al. (2013) · Archives of Toxicology · doi:10.1007/s00204-013-1078-5 · Cited by 1,280
Self-citationZonation of parenchymal and nonparenchymal metabolism in liver.
Jungermann, K., & Keitzmann, T. (1996) · Annual Review of Nutrition · doi:10.1146/annurev.nu.16.070196.001143 · Cited by 589
Generation of Hepatocyte-Like Cells from Human Embryonic Stem Cells
Rambhatla, L., Chiu, C.-P., Kundu, P., Peng, Y., & Carpenter, M. K. (2003) · Cell Transplantation · doi:10.3727/000000003783985179 · Cited by 437
Rodríguez-Antona, C., Donato, M. T., Boobis, A., Edwards, R. J., Watts, P. S., Castell, J. V., & Gómez-Lechón, M.-J. (2002) · Xenobiotica · doi:10.1080/00498250210128675 · Cited by 420
Guo, L., Dial, S., Shi, L., Branham, W., Liu, J., Fang, J.-L., Green, B., Deng, H., Kaput, J., & Ning, B. (2011) · Drug Metabolism and Disposition · doi:10.1124/dmd.110.035873 · Cited by 348
Cited by
Sorted by citations
Organs-on-chips: into the next decade
Low, L. A., Mummery, C., Berridge, B. R., Austin, C. P., & Tagle, D. A. (2021) · Nature Reviews Drug Discovery · doi:10.1038/s41573-020-0079-3 · Cited by 1,029
Bell, C. C., Dankers, A. C. A., Lauschke, V. M., Sison-Young, R., Jenkins, R., Rowe, C., Goldring, C. E., Park, K., Regan, S. L., Walker, T., et al. (2018) · Toxicological Sciences · doi:10.1093/toxsci/kfx289 · Cited by 327
Self-citationLauschke, V. M., Hendriks, D. F. G., Bell, C. C., Andersson, T. B., & Ingelman-Sundberg, M. (2016) · Chemical Research in Toxicology · doi:10.1021/acs.chemrestox.6b00150 · Cited by 241
Bell, C. C., Lauschke, V. M., Vorrink, S. U., Palmgren, H., Duffin, R., Andersson, T. B., & Ingelman-Sundberg, M. (2017) · Drug Metabolism and Disposition · doi:10.1124/dmd.116.074369 · Cited by 201
Hepatic 3D spheroid models for the detection and study of compounds with cholestatic liability
Hendriks, D. F. G., Fredriksson Puigvert, L., Messner, S., Mortiz, W., & Ingelman-Sundberg, M. (2016) · Scientific Reports · doi:10.1038/srep35434 · Cited by 156
Metadata
- Authors
- Heslop, J. A., Rowe, C., Walsh, J., Sison-Young, R., Jenkins, R., Kamalian, L., Kia, R., Hay, D., Jones, R. P., Malik, H. Z., Fenwick, S., Chadwick, A. E., Mills, J., Kitteringham, N. R., Goldring, C. E. P., & Kevin Park, B.
- Affiliations
- University of Liverpool (GB)
- University of Oxford (GB)
- Aintree University Hospital (GB)
- AstraZeneca (United Kingdom) (GB)
- ORCID
- Venue
- Archives of Toxicology
- Published
- 2016-04-02
- Volume
- 91
- Issue
- 1
- Pages
- 439-452
- ISSN
- 0340-5761 (ISSN-L)
- 1432-0738
- PMC
- PMC5225178
- OpenAlex
- W2321561488
- Semantic Scholar
- 738c624a59802860e61440bd9f6ab427176b529f
- Cited by
- 141
- References
- 46
- Citations by year
- 2026: 16 · 2025: 14 · 2024: 10 · 2023: 15 · 2022: 16 · 2021: 12 · 2020: 17 · 2019: 10 · 2018: 18 · 2017: 7 · 2016: 6
- FWCI
- 15.18
- Type
- journal article
- Language
- en
- Open access
- hybrid
- doi.org
- Locations
- Archives of Toxicology (publishedVersion, cc-by)
- PubMed (publishedVersion)
- PubMed Central (submittedVersion, cc-by)
- Edinburgh Research Explorer (University of Edinburgh) (submittedVersion, other-oa)
- Funders
- Biotechnology and Biological Sciences Research Council (GB) (BB/J500756/1)
- Medical Research Council (GB) (MR/L006758/1 and G0700654)
- European Parliament (BE) (115336)
- Topics
- Life Sciences › Pharmacology, Toxicology and Pharmaceutics › Pharmacology › Drug-Induced Hepatotoxicity and Protection
- Health Sciences › Medicine › Hepatology › Liver physiology and pathology
- Physical Sciences › Chemistry › Spectroscopy › Advanced Proteomics Techniques and Applications
- Keywords
- primary human hepatocytes, hepatocyte dedifferentiation, hepatocyte culture, proteomic profiling, cytochrome P450, mitochondrial proteome, drug metabolism, hepatotoxicity assessment, stem cell-derived hepatocytes
- MeSH terms
- Cells, Cultured, Humans, Kinetics, Mitochondria, Liver, Pharmacology, Rotenone, Toxicology, Uncoupling Agents, Reproducibility of Results, Gene Expression Regulation, Developmental, Proteome, Gene Expression Profiling, Hepatocytes, Electron Transport Complex I, Cell Dedifferentiation, Protein Stability
About these checks
Registry, retraction, Cites and statistics results are computed, not judged, with one exception: a printed reference that no index lists is read once by a model before it counts as a citation error. Claims are extracted by a model and kept only when their quote appears verbatim in the text; each cited source is then checked, with a model’s help, for whether it says what the claim relies on. Those verdicts can be wrong — read the claim’s quote and the cited source before relying on one.
A language model drew the claims from the paper on 2026-10-23, under version 3 of the claim definition (model deepseek-v4.1-flash, prompt extract-v3).
A second model labelled each claim on 2026-10-23 (model jev-1.13-20260917, definition revision gold-guideline-v0.2).
Cited sources are checked with a language model’s help (gpt-6-sol).
Statistics and arithmetic are recomputed, not judged.
Confidence bands are shown only for fields calibrated on our annotated test set. None is calibrated yet, so no band is shown.
What counts as a claim ›How we measure confidence ›How we check this ›
Are you an author, or do you see a problem with this page? Request a review
