

The DOI matches its Crossref record; 80 of the 80 references it cites were found in a registry or an index.
Analyzing microglial phenotypes across neuropathologies: a practical guide
Open accessAbstract
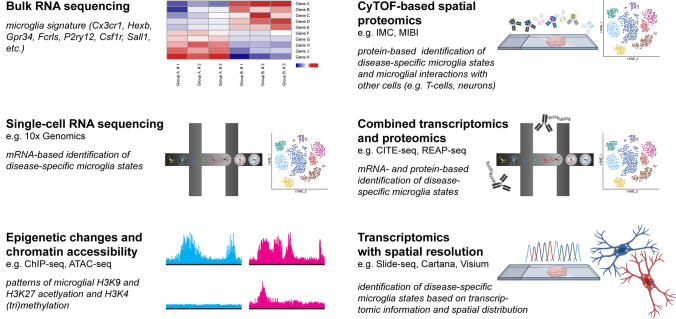
As extremely sensitive immune cells, microglia act as versatile watchdogs of the central nervous system (CNS) that tightly control tissue homeostasis. Therefore, microglial activation is an early and easily detectable hallmark of virtually all neuropsychiatric, neuro-oncological, neurodevelopmental, neurodegenerative and neuroinflammatory diseases. The recent introduction of novel high-throughput technologies and several single-cell methodologies as well as advances in epigenetic analyses helped to identify new microglia expression profiles, enhancer-landscapes and local signaling cues that defined diverse previously unappreciated microglia states in the healthy and diseased CNS. Here, we give an overview on the recent developments in the field of microglia biology and provide a practical guide to analyze disease-associated microglia phenotypes in both the murine and human CNS, on several morphological and molecular levels. Finally, technical limitations, potential pitfalls and data misinterpretations are discussed as well.
Overview
The claims and statistics of this paper haven’t been checked yet.
Run the check — free, no account needed. It reads the open-access text and checks the sources it cites.
Integrity signals
Registry
Cites
Statistics
Figures
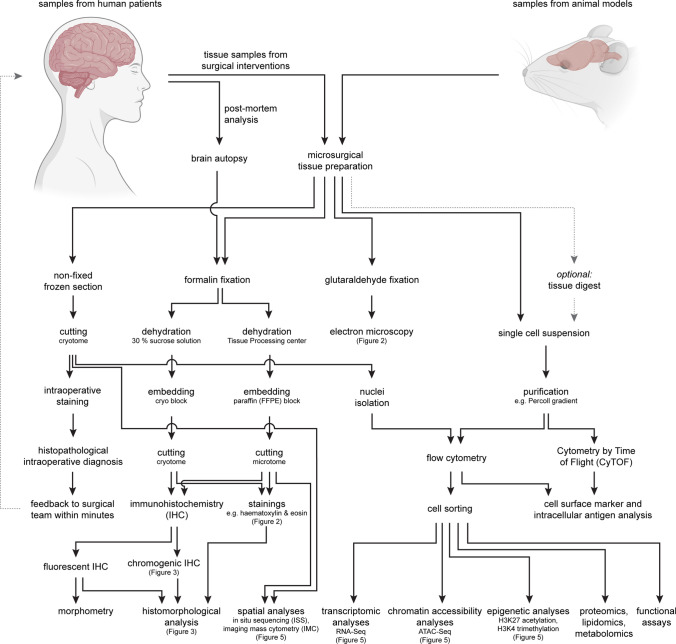
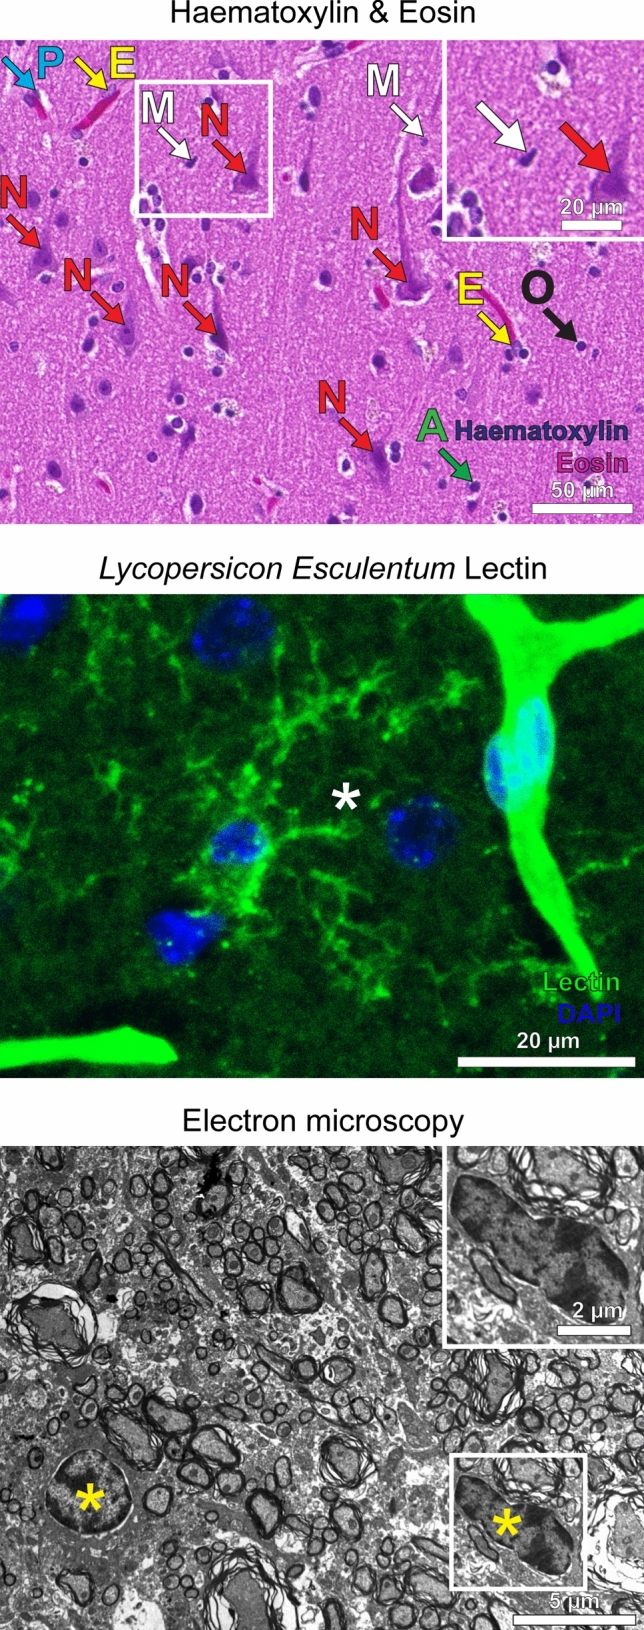
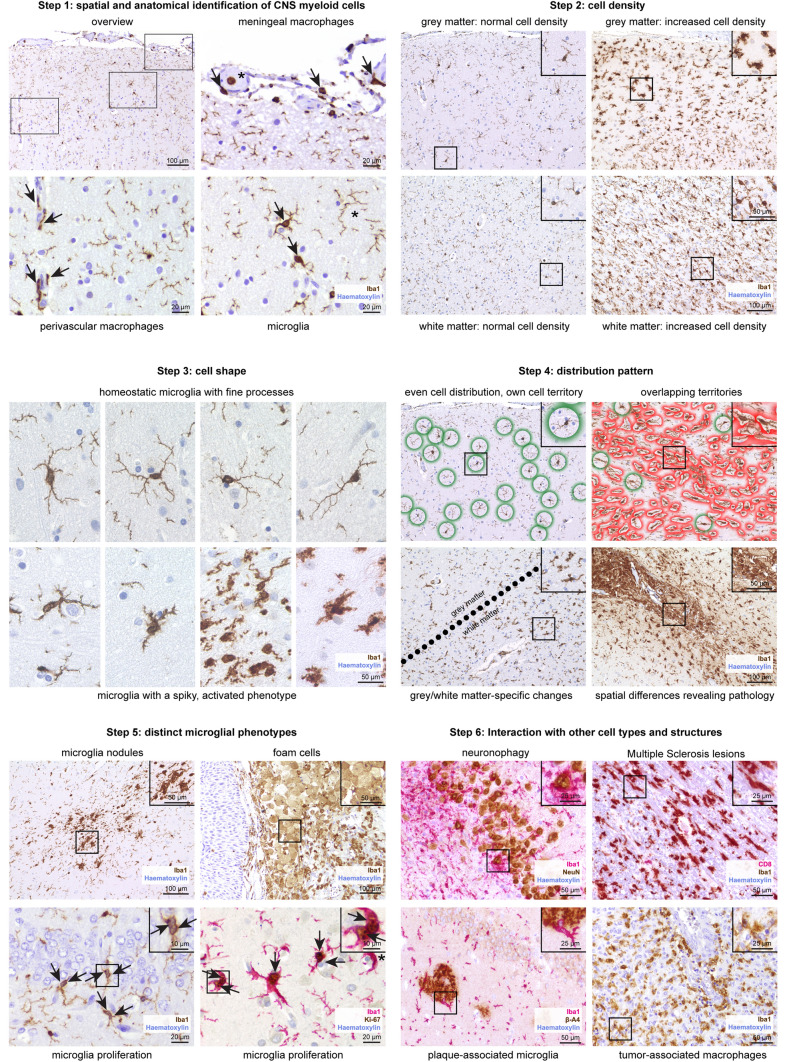
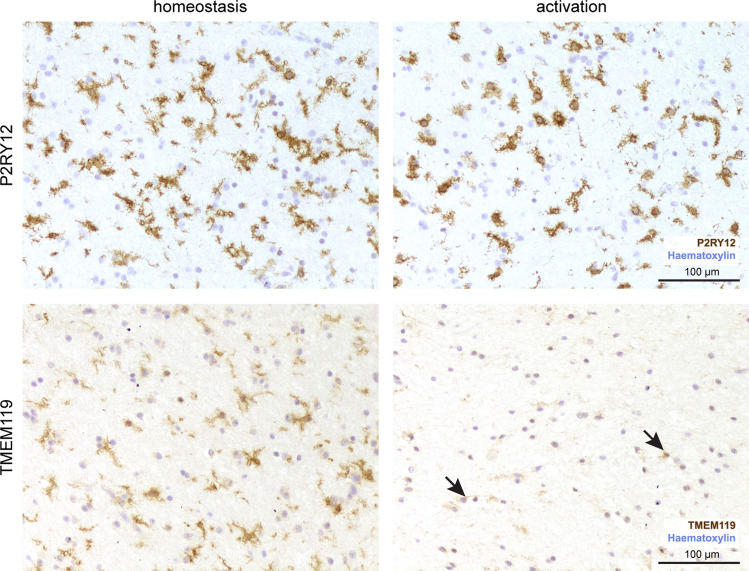
Verification
Claims the paper makes
The claims and statistics of this paper haven’t been checked yet.
Run the check — free, no account needed. It reads the open-access text and checks the sources it cites.
Claims other papers make about this one
Each is checked against this paper’s own text: does it say what the citing paper says it does?
The cited source says what the claim attributes to it.
In the citing paper
“Histopathological examination of the hippocampal parenchyma revealed microgliosis17 in aged mice, which was reduced after STING inhibition (Fig. 2a).”
From cGAS–STING drives ageing-related inflammation and neurodegeneration (2023) · cites this paper as [17]
The cited source says what the claim attributes to it.
In the citing paper
“Homeostatic microglia present a ramified morphology with longer processes (Schwabenland et al., 2021), such as that observed in WT and CKO mice (Fig. 4, H, M, and N), while microglia from T mice display a hypertrophic morphology characterized by a significant reduction in process length and number of branches per cell (P < 0.0001).”
From Cholesterol 25-hydroxylase mediates neuroinflammation and neurodegeneration in a mouse model of tauopathy (2024) · cites this paper as Schwabenland et al., 2021
Self-check
Percentages, sums and reported differences re-computed from the paper’s own numbers.
The self-check needs the paper’s full text.
Citations
Cites
Polazzi, E., Mengoni, I., Caprini, M., Peña‐Altamira, E., Kurtys, E., & Monti, B. (2012) · Neurosignals · doi:10.1159/000337115 · Cited by 9,023
A Unique Microglia Type Associated with Restricting Development of Alzheimer’s Disease
Keren-Shaul, H., Spinrad, A., Weiner, A., Matcovitch-Natan, O., Dvir-Szternfeld, R., Ulland, T. K., David, E., Baruch, K., Lara-Astaiso, D., Toth, B., et al. (2017) · Cell · doi:10.1016/j.cell.2017.05.018 · Cited by 5,493
Synaptic Pruning by Microglia Is Necessary for Normal Brain Development
Paolicelli, R. C., Bolasco, G., Pagani, F., Maggi, L., Scianni, M., Panzanelli, P., Giustetto, M., Ferreira, T. A., Guiducci, E., Dumas, L., et al. (2011) · Science · doi:10.1126/science.1202529 · Cited by 4,244
Host microbiota constantly control maturation and function of microglia in the CNS
Erny, D., Hrabě de Angelis, A. L., Jaitin, D., Wieghofer, P., Staszewski, O., David, E., Keren-Shaul, H., Mahlakoiv, T., Jakobshagen, K., Buch, T., et al. (2015) · Nature Neuroscience · doi:10.1038/nn.4030 · Cited by 3,569
Self-citationATAC-seq: a method for assaying chromatin accessibility genome-wide
Buenrostro, J. D., Wu, B., Chang, H. Y., & Greenleaf, W. J. (2015) · Current Protocols in Molecular Biology · doi:10.1002/0471142727.mb2129s109 · Cited by 3,289
Identification of a unique TGF-β–dependent molecular and functional signature in microglia
Butovsky, O., Jedrychowski, M. P., Moore, C. S., Cialic, R., Lanser, A. J., Gabriely, G., Koeglsperger, T., Dake, B., Wu, P. M., Doykan, C. E., et al. (2014) · Nature Neuroscience · doi:10.1038/nn.3599 · Cited by 2,543
Slide-seq: A scalable technology for measuring genome-wide expression at high spatial resolution
Rodriques, S. G., Stickels, R. R., Goeva, A., Martin, C. A., Murray, E., Vanderburg, C. R., Welch, J., Chen, L. M., Chen, F., & Macosko, E. Z. (2019) · Science · doi:10.1126/science.aaw1219 · Cited by 2,424
Tissue-Resident Macrophage Enhancer Landscapes Are Shaped by the Local Microenvironment
Lavin, Y., Winter, D., Blecher-Gonen, R., David, E., Keren-Shaul, H., Merad, M., Jung, S., & Amit, I. (2014) · Cell · doi:10.1016/j.cell.2014.11.018 · Cited by 2,167
New tools for studying microglia in the mouse and human CNS
Bennett, M. L., Bennett, F. C., Liddelow, S. A., Ajami, B., Zamanian, J. L., Fernhoff, N. B., Mulinyawe, S. B., Bohlen, C. J., Adil, A., Tucker, A., et al. (2016) · Proceedings of the National Academy of Sciences · doi:10.1073/pnas.1525528113 · Cited by 1,804
The role of microglia and macrophages in glioma maintenance and progression
Hambardzumyan, D., Gutmann, D. H., & Kettenmann, H. (2016) · Nature Neuroscience · doi:10.1038/nn.4185 · Cited by 1,683
Cited by
Sorted by citations
cGAS–STING drives ageing-related inflammation and neurodegeneration
Gulen, M. F., Samson, N., Keller, A., Schwabenland, M., Liu, C., Glück, S., Thacker, V. V., Favre, L., Mangeat, B., Kroese, L. J., et al. (2023) · Nature · doi:10.1038/s41586-023-06373-1 · Cited by 1,104
Self-citationThe Impact of Systemic Inflammation on Alzheimer’s Disease Pathology
Xie, J., Van Hoecke, L., & Vandenbroucke, R. E. (2022) · Frontiers in Immunology · doi:10.3389/fimmu.2021.796867 · Cited by 324
Microglia in multiple sclerosis: protectors turn destroyers
Yong, V. W. (2022) · Neuron · doi:10.1016/j.neuron.2022.06.023 · Cited by 185
Detection of SARS-CoV-2 viral proteins and genomic sequences in human brainstem nuclei
Emmi, A., Rizzo, S., Barzon, L., Sandre, M., Carturan, E., Sinigaglia, A., Riccetti, S., Barbera, M. D., Rafael Boscolo-berto, A., Cocco, P., et al. (2023) · npj Parkinson s Disease · doi:10.1038/s41531-023-00467-3 · Cited by 75
CNS border-associated macrophages in the homeostatic and ischaemic brain
Gerganova, G., Riddell, A., & Miller, A. A. (2022) · Pharmacology & Therapeutics · doi:10.1016/j.pharmthera.2022.108220 · Cited by 72
Metadata
- Authors
- Schwabenland, M., Brück, W., Priller, J., Stadelmann, C., Lassmann, H., & Prinz, M.
- Affiliations
- University of Freiburg (DE)
- Universitätsmedizin Göttingen (DE)
- German Center for Neurodegenerative Diseases (DE)
- Medical University of Vienna (AT)
- Corresponding author
- Lassmann, Hans
- Prinz, Marco
- ORCID
- Venue
- Acta Neuropathologica
- Published
- 2021-10-08
- Volume
- 142
- Issue
- 6
- Pages
- 923-936
- ISSN
- 0001-6322 (ISSN-L)
- 1432-0533
- PMC
- PMC8498770
- OpenAlex
- W3201995754
- Cited by
- 149
- References
- 80
- Citations by year
- 2026: 21 · 2025: 29 · 2024: 25 · 2023: 36 · 2022: 37 · 2021: 1
- FWCI
- 2.89
- Type
- journal article
- Language
- en
- Open access
- hybrid
- doi.org
- Locations
- Acta Neuropathologica (publishedVersion, cc-by)
- Europe PMC (PubMed Central) (publishedVersion, other-oa)
- PubMed Central (publishedVersion, cc-by)
- PubMed (publishedVersion)
- Informationszentrum Lebenswissenschaften (ZB MED) (submittedVersion, cc-by)
- mediaTUM – the media and publications repository of the Technical University Munich (Technical University Munich) (submittedVersion)
- DZNE Pub (submittedVersion, cc-by)
- GoeScholar The Publication Server of the Georg-August-Universität Göttingen (Georg-August-Universität Göttingen) (submittedVersion, cc-by)
- Funders
- Universitätsklinikum Freiburg
- Topics
- Life Sciences › Neuroscience › Neurology › Neuroinflammation and Neurodegeneration Mechanisms
- Health Sciences › Medicine › Clinical Neurology › Multiple Sclerosis Research Studies
- Life Sciences › Biochemistry, Genetics and Molecular Biology › Molecular Biology › Single-cell and spatial transcriptomics
- Keywords
- microglia, microglial phenotype, microglial activation, neurodegenerative diseases, neuroinflammation, single-cell transcriptomics, enhancer landscape, epigenetics, microglial morphology, CNS homeostasis, mouse model
- MeSH terms
- Neuropathology, Animals, Central Nervous System Diseases, Humans, Phenotype, Microglia, Mice
About these checks
Registry, retraction, Cites and statistics results are computed, not judged, with one exception: a printed reference that no index lists is read once by a model before it counts as a citation error. Claims are extracted by a model and kept only when their quote appears verbatim in the text; each cited source is then checked, with a model’s help, for whether it says what the claim relies on. Those verdicts can be wrong — read the claim’s quote and the cited source before relying on one.
Statistics and arithmetic are recomputed, not judged.
Confidence bands are shown only for fields calibrated on our annotated test set. None is calibrated yet, so no band is shown.
What counts as a claim ›How we measure confidence ›How we check this ›
Are you an author, or do you see a problem with this page? Request a review
