

The DOI matches its Crossref record; 87 of the 87 references it cites were found in a registry or an index; none of the 77 sources its claims cite is checked for support yet.
Dispersals of the Siberian Y-chromosome haplogroup Q in Eurasia
Open accessAbstract
The human Y-chromosome has proven to be a powerful tool for tracing the paternal history of human populations and genealogical ancestors. The human Y-chromosome haplogroup Q is the most frequent haplogroup in the Americas. Previous studies have traced the origin of haplogroup Q to the region around Central Asia and Southern Siberia. Although the diversity of haplogroup Q in the Americas has been studied in detail, investigations on the diffusion of haplogroup Q in Eurasia and Africa are still limited. In this study, we collected 39 samples from China and Russia, investigated 432 samples from previous studies of haplogroup Q, and analyzed the single nucleotide polymorphism (SNP) subclades Q1a1a1-M120, Q1a2a1-L54, Q1a1b-M25, Q1a2-M346, Q1a2a1a2-L804, Q1a2b2-F1161, Q1b1a-M378, and Q1b1a1-L245. Through NETWORK and BATWING analyses, we found that the subclades of haplogroup Q continued to disperse from Central Asia and Southern Siberia during the past 10,000 years. Apart from its migration through the Beringia to the Americas, haplogroup Q also moved from Asia to the south and to the west during the Neolithic period, and subsequently to the whole of Eurasia and part of Africa.
Overview
CoChat Summary
Written by AI from the paper’s full text.
TL;DR
This study analyzes Y-chromosome haplogroup Q in 471 unrelated males—39 newly identified Q samples from China and Russia plus 432 published samples—to trace its Eurasian dispersals. It concludes that Q subclades continued dispersing from Central Asia and Southern Siberia over the past ~10,000 years, including Neolithic southward and westward movements into Eurasia and part of Africa.
Key findings
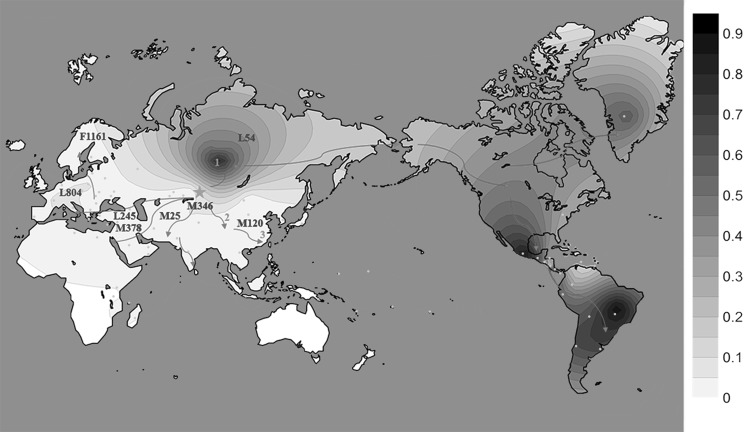
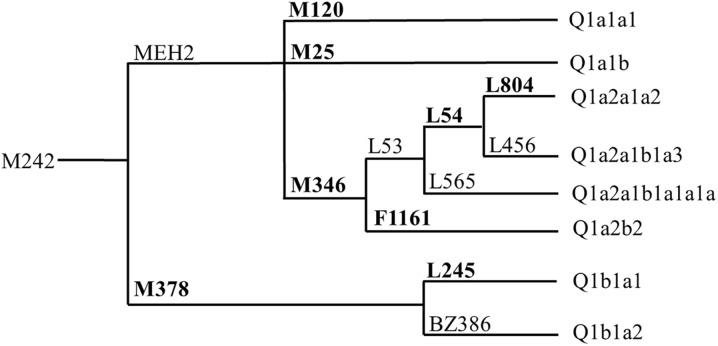
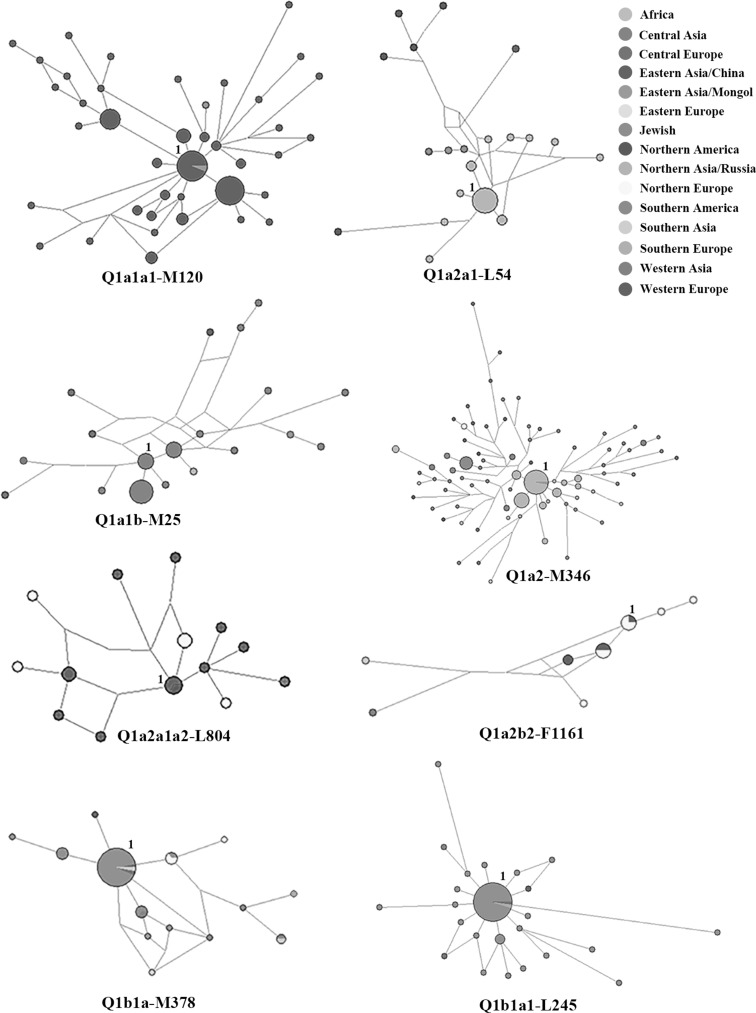
- Of 471 unrelated male samples, 39 newly collected samples belonged to haplogroup Q (16 from China, 23 from Russia); 432 were from previous studies. Networks showed Q1a1a1-M120 mostly in China/Mongolia, Q1a2a1-L54 mostly in Siberia, Q1a1b-M25 in Central Asia, Q1a2-M346 in Northern Asia/Russia/Mongolia with a few African samples, and Q1b1a-M378/Q1b1a1-L245 mainly in Jewish clusters.
- BATWING genealogical mutation-rate estimates included: Q1a1a1-M120 TMRCA 9.8–11.1 KYA and expansion 5.8–6.4 KYA; Q1a1b-M25 (Turkic) TMRCA 3.1–4.6 KYA and expansion 2.0–2.7 KYA; Q1a2-M346 (Turkic) TMRCA 4.0–5.5 KYA and expansion 3.6–4.4 KYA; Q1a2a1a2-L804 TMRCA 5.3–7.1 KYA and expansion 5.2–6.3 KYA.
- Q1b1a-M378 (Jews) TMRCA 1.4–1.8 KYA and expansion 1.5–1.8 KYA; Q1b1a1-L245 (Jews) TMRCA 8.6–10.9 KYA and expansion 4.8–5.4 KYA; Q1a2a1-L54 (Yenisei basin) TMRCA 0.3–2.5 KYA and expansion 0.4–3.4 KYA.
- The authors propose Q1a1a1-M120 migrated from Mongolia to China during the Neolithic and spread with Han ancestors; Q1a1b-M25 and Q1a2-M346 spread with Turkic nomads from Southern Siberia/Central Asia to Eurasia and the Comoros; Q1a2a1a2-L804 spread with early European Neolithic farmers from Central to Western/Northern Europe; Q1b1a-M378 and Q1b1a1-L245 expanded with Jewish Diaspora populations into Europe.
Methods
- Sample: 471 unrelated males; 39 newly identified haplogroup Q samples (16 China: Bao-An, Dong-Xiang, Li-Qian, Shao-Xing; 23 Russia: Enets, Ket, Selkup) plus 432 samples from published studies.
- Genotyping: hierarchical binary SNP genotyping by SNaPshot and fluorescent allele-specific PCR; 17 Y-STRs amplified with AmpFlSTR Yfiler; reduced-median networks in NETWORK v.5.0.0.1 for eight Q subclades using 7–15 loci; BATWING MCMC estimates of TMRCA and expansion time with four mutation rates (EMR, OMRB, OMRS, lmMR) and a 30-year generation time; Kriging contour map of Q-M242 frequencies.
- Analysis focused on Q1a1a1-M120, Q1a2a1-L54, Q1a1b-M25, Q1a2-M346, Q1a2a1a2-L804, Q1a2b2-F1161, Q1b1a-M378, and Q1b1a1-L245.
Limitations
- No formal limitations section is present. The paper states that a higher-resolution database would help draw more conclusions and that the authors did not discuss origins/migrations of American samples because they focused on Eurasia.
- Evident from the text: newly identified Q samples are small (16 China, 23 Russia) and unevenly distributed; analyses combine published datasets with different loci, requiring reduced STR panels (7–15 loci); time estimates depend heavily on mutation-rate choice, with EMR producing much older TMRCAs than genealogical rates; some network clusters are based on few samples (e.g., Q1a2a1a2-L804 cluster 1: two Western European and one Northern American; Q1a2b2-F1161 cluster 1: three Northern European and one Western European).
Model-written summary. Check it against the paper before relying on it.
Integrity signals
Registry
Cites
Statistics
Figures
Verification
Claims the paper makes
26 Check pending · 16 Own result · 12 Own interpretation · 6 Not checked yet · 5 No full text of the sources · 2 Own method
A result the paper reports from its own data — it cites no other source for it, so there is none to check. The quote shows it is in the paper.
In the paper
“The network of Q1a2a1a2-L804 had a central cluster shared by Western European and Northern American samples with other branches of Western, Northern and Central Europe.”
§ Dispersals of the Siberian Y-chromosome haplogroup Q in Eurasia > Results > The network of haplogroup Q subclades
plainstates an associationn = 471- Asserted: passes — The authors put it forward as true.
- Checkable: passes — It can be checked against evidence.
- Load-bearing: unclear — It is unclear whether the paper’s conclusions depend on it.
- Based: passes — The paper gives a reason why it holds.
A result the paper reports from its own data — it cites no other source for it, so there is none to check. The quote shows it is in the paper.
In the paper
“The network of Q1a1a1-M120 included most samples from China along with a small number of Mongolian samples.”
§ Dispersals of the Siberian Y-chromosome haplogroup Q in Eurasia > Results > The network of haplogroup Q subclades
plainn = 471- Asserted: passes — The authors put it forward as true.
- Checkable: passes — It can be checked against evidence.
- Load-bearing: unclear — It is unclear whether the paper’s conclusions depend on it.
- Based: passes — The paper gives a reason why it holds.
A result the paper reports from its own data — it cites no other source for it, so there is none to check. The quote shows it is in the paper.
In the paper
“The network of Q1a2a1-L54 contained most samples from Siberia (Northern Asia/Russia), and few samples from Mongolia, China and Northern America.”
§ Dispersals of the Siberian Y-chromosome haplogroup Q in Eurasia > Results > The network of haplogroup Q subclades
plainstates an associationn = 471- Asserted: passes — The authors put it forward as true.
- Checkable: passes — It can be checked against evidence.
- Load-bearing: unclear — It is unclear whether the paper’s conclusions depend on it.
- Based: passes — The paper gives a reason why it holds.
A result the paper reports from its own data — it cites no other source for it, so there is none to check. The quote shows it is in the paper.
In the paper
“The network of Q1a1b-M25 consisted of samples from Central Asia with a small number of Eastern Asian/Mongolian, Western Asian, Central and Western European samples.”
§ Dispersals of the Siberian Y-chromosome haplogroup Q in Eurasia > Results > The network of haplogroup Q subclades
plainn = 471- Asserted: passes — The authors put it forward as true.
- Checkable: passes — It can be checked against evidence.
- Load-bearing: unclear — It is unclear whether the paper’s conclusions depend on it.
- Based: passes — The paper gives a reason why it holds.
A result the paper reports from its own data — it cites no other source for it, so there is none to check. The quote shows it is in the paper.
In the paper
“The network of Q1b1a1-L245 had a star-like shape of Jewish samples and a small amount of European and Western Asian samples.”
§ Dispersals of the Siberian Y-chromosome haplogroup Q in Eurasia > Results > The network of haplogroup Q subclades
plainn = 471- Asserted: passes — The authors put it forward as true.
- Checkable: passes — It can be checked against evidence.
- Load-bearing: unclear — It is unclear whether the paper’s conclusions depend on it.
- Based: passes — The paper gives a reason why it holds.
- It may state two separate claims as one. 21
- Probably not a substantial claim. 9
Create a free account to see these claims.
Create a free account to see these assumptions.
36 more claims
Create a free account to see all 67 claims and to verify the 50 references still open.
Claims other papers make about this one
Each is checked against this paper’s own text: does it say what the citing paper says it does?
In the citing paper
“Modern genetic data do not show the traces of such expansions for R1b or Q in Central Eurasia.”
From Genomes of the Golden Horde elites and their implications for the rulers of the Mongol Empire (2026) · cites this paper as [66]
In the citing paper
“Previous studies have demonstrated that South Siberia is likely the center of diffusion of haplogroup Q-M242 beginning 30,000 thousand years ago [6,50,51].”
From Ancient Components and Recent Expansion in the Eurasian Heartland: Insights into the Revised Phylogeny of Y-Chromosomes from Central Asia (2022) · cites this paper as [51]
In the citing paper
“Furthermore, many minor sub-lineages of Q-M242 have been detected in populations from Inner Eurasia, including Mongolic- and Turkic-speaking populations [6,23,50,51].”
From Ancient Components and Recent Expansion in the Eurasian Heartland: Insights into the Revised Phylogeny of Y-Chromosomes from Central Asia (2022) · cites this paper as [51]
Self-check
Percentages, sums and reported differences re-computed from the paper’s own numbers.
Each contradiction between two passages listed here was confirmed by an independent check.
Rated minor: it would not touch a result — a value no result rests on, a p-value that stays on the same side of the significance level, or a conflict that is clerical, resolved elsewhere in the paper, or outside its own findings.
In the paper
§ Dispersals of the Siberian Y-chromosome haplogroup Q in Eurasia > Results > Time estimates for haplogroup Q
“the three genealogical mutation rates had approximately similar results”
§ Dispersals of the Siberian Y-chromosome haplogroup Q in Eurasia > Results > Time estimates for haplogroup Q
“| Q1a2a1-L54 (Yenisei basin) | 10.4/9.2 | 2.5/3.4 | 2.4/3.3 | 0.3/0.4 |”
Citations
Cites
Ancient human genome sequence of an extinct Palaeo-Eskimo
Rasmussen, M., Li, Y., Lindgreen, S., Pedersen, J. S., Albrechtsen, A., Moltke, I., Metspalu, M., Metspalu, E., Kivisild, T., Gupta, R., et al. (2010) · Nature · doi:10.1038/nature08835 · Cited by 849
Y chromosome sequence variation and the history of human populations
Underhill, P. A., Shen, P., Lin, A. A., Jin, L., Passarino, G., Yang, W. H., Kauffman, E., Bonné-Tamir, B., Bertranpetit, J., Francalacci, P., et al. (2000) · Nature Genetics · doi:10.1038/81685 · Cited by 715
New binary polymorphisms reshape and increase resolution of the human Y chromosomal haplogroup tree
Karafet, T. M., Mendez, F. L., Meilerman, M. B., Underhill, P. A., Zegura, S. L., & Hammer, M. F. (2008) · Genome Research · doi:10.1101/gr.7172008 · Cited by 710
Winkler, T. W., Justice, A. E., Graff, M., Barata, L., Feitosa, M. F., Chu, S. H., Czajkowski, J., Esko, T., Fall, T., Kilpeläinen, T. O., et al. (2015) · PLoS Genetics · doi:10.1371/journal.pgen.1005378 · Cited by 689
The genome of a Late Pleistocene human from a Clovis burial site in western Montana
Rasmussen, M., Anzick, S. L., Waters, M. R., Skoglund, P., DeGiorgio, M., Stafford, T. W., Rasmussen, S., Moltke, I., Albrechtsen, A., Doyle, S. M., et al. (2014) · Nature · doi:10.1038/nature13025 · Cited by 562
Genomic evidence for the Pleistocene and recent population history of Native Americans
Raghavan, M., Steinrücken, M., Harris, K., Schiffels, S., Rasmussen, S., DeGiorgio, M., Albrechtsen, A., Valdiosera, C., Ávila-Arcos, M. C., Malaspinas, A.-S., et al. (2015) · Science · doi:10.1126/science.aab3884 · Cited by 540
Ancient DNA from the First European Farmers in 7500-Year-Old Neolithic Sites
Haak, W., Forster, P., Bramanti, B., Matsumura, S., Brandt, G., Tänzer, M., Villems, R., Renfrew, C., Gronenborn, D., Alt, K. W., et al. (2005) · Science · doi:10.1126/science.1118725 · Cited by 536
Genetic Discontinuity Between Local Hunter-Gatherers and Central Europe’s First Farmers
Bramanti, B., Thomas, M. G., Haak, W., Unterlaender, M., Jores, P., Tambets, K., Antanaitis-Jacobs, I., Haidle, M. N., Jankauskas, R., Kind, C.-J., et al. (2009) · Science · doi:10.1126/science.1176869 · Cited by 504
Анатольевич, Ж. Л., Underhill, P. A., Cinnioğlu, C., Kayser, M., Morar, B., Kivisild, T., Scozzari, R., Cruciani, F., Destro‐Bisol, G., Spedini, G., et al. (2004) · The American Journal of Human Genetics · doi:10.1086/380911 · Cited by 394
Ancient DNA from European Early Neolithic Farmers Reveals Their Near Eastern Affinities
Haak, W., Balanovsky, O., Sanchez, J. J., Koshel, S., Zaporozhchenko, V., Adler, C. J., Der Sarkissian, C. S. I., Brandt, G., Schwarz, C., Nicklisch, N., et al. (2010) · PLoS Biology · doi:10.1371/journal.pbio.1000536 · Cited by 363
Cited by
Wang, Q., Zhao, J., Ren, Z., Sun, J., He, G., Guo, J., Zhang, H., Ji, J., Liu, Y., Yang, M., et al. (2021) · Frontiers in Genetics · doi:10.3389/fgene.2020.618614 · Cited by 53
Self-citationWang, M., Huang, Y., Liu, K., Wang, Z., Zhang, M., Yuan, H., Duan, S., Wei, L., Yao, H., Sun, Q., et al. (2024) · Molecular Biology and Evolution · doi:10.1093/molbev/msae122 · Cited by 52
Self-citationClaerhout, S., Verstraete, P., Warnez, L., Vanpaemel, S., Larmuseau, M., & Decorte, R. (2021) · PLoS Genetics · doi:10.1371/journal.pgen.1009758 · Cited by 47
Keyser, C., Zvénigorosky, V., Gonzalez, A., Fausser, J., Jagorel, F., Gérard, P., Turbat, T., Duchesne, S., Crubézy, É., & Ludes, B. (2020) · Human Genetics · doi:10.1007/s00439-020-02209-4 · Cited by 33
Paternal origin of Paleo-Indians in Siberia: Insights from Y-chromosome sequences
Wei, L.-H., Wang, L.-X., Wen, S.-Q., Yan, S., Canada, R., Gurianov, V., Huang, Y.-Z., Mallick, S., Biondo, A., O’Leary, A., et al. (2018) · European Journal of Human Genetics · doi:10.1038/s41431-018-0211-6 · Cited by 31
Self-citation
Metadata
- Authors
- Huang, Y.-Z., Pamjav, H., Flegontov, P., Stenzl, V., Wen, S.-Q., Tong, X.-Z., Wang, C.-C., Wang, L.-X., Wei, L.-H., Gao, J.-Y., Jin, L., & Li, H.
- Affiliations
- Fudan University (CN)
- Russian Academy of Sciences (RU)
- Policie České republiky - Kriminalistický ústav (CZ)
- Xiamen University (CN)
- Institut National des Langues et Civilisations Orientales (FR)
- Corresponding author
- Li, Hui
- Venue
- Molecular Genetics and Genomics
- Published
- 2017-09-07
- Volume
- 293
- Issue
- 1
- Pages
- 107-117
- ISSN
- 1617-4623 (ISSN-L)
- 1617-4615
- PMC
- PMC5846874
- OpenAlex
- W2751540482
- Semantic Scholar
- 8347f24eed1c1bec583b5c8b2d1978864db653c9
- Cited by
- 34
- References
- 87
- Citations by year
- 2026: 3 · 2025: 3 · 2024: 5 · 2023: 3 · 2022: 5 · 2021: 7 · 2020: 4 · 2019: 2 · 2018: 2
- FWCI
- 1.24
- Type
- journal article
- Language
- en
- Open access
- hybrid
- doi.org
- Licence
- Locations
- Molecular Genetics and Genomics (publishedVersion, cc-by)
- PubMed (publishedVersion)
- PubMed Central (publishedVersion, cc-by)
- Funders
- National Natural Science Foundation of China (31222030, 31671297, 31271338)
- MOE Scientific Research Project (113022A)
- Shanghai Shuguang Project (14SG05)
- Ministry of Science and Technology of China (2016YFC0900300)
- Topics
- Life Sciences › Biochemistry, Genetics and Molecular Biology › Genetics › Forensic and Genetic Research
- Life Sciences › Biochemistry, Genetics and Molecular Biology › Genetics › Genetic diversity and population structure
- Social Sciences › Anthropology › Pleistocene-Era Hominins and Archaeology
- Keywords
- Central Asia, Southern Siberia, Neolithic migration, Beringia, migration to Africa, single nucleotide polymorphisms
- MeSH terms
- Asia, China, Genetics, Population, Haplotypes, Humans, Phylogeny, Siberia, Microsatellite Repeats, Polymorphism, Single Nucleotide, Chromosomes, Human, Y, Human Migration
About these checks
Registry, retraction, Cites and statistics results are computed, not judged, with one exception: a printed reference that no index lists is read once by a model before it counts as a citation error. Claims are extracted by a model and kept only when their quote appears verbatim in the text; each cited source is then checked, with a model’s help, for whether it says what the claim relies on. Those verdicts can be wrong — read the claim’s quote and the cited source before relying on one.
A language model drew the claims from the paper on 2026-11-12, under version 3 of the claim definition (model deepseek-v4.1-flash, prompt extract-v3).
A second model labelled each claim on 2026-11-12 (model jev-1.13-20260917, definition revision gold-guideline-v0.2).
Statistics and arithmetic are recomputed, not judged.
Confidence bands are shown only for fields calibrated on our annotated test set. None is calibrated yet, so no band is shown.
What counts as a claim ›How we measure confidence ›How we check this ›
Are you an author, or do you see a problem with this page? Request a review
