

The DOI matches its Crossref record; 73 of the 77 references it cites were found in a registry or an index.
Lifespan Dispersion in Times of Life Expectancy Fluctuation: The Case of Central and Eastern Europe
Open accessAbstract
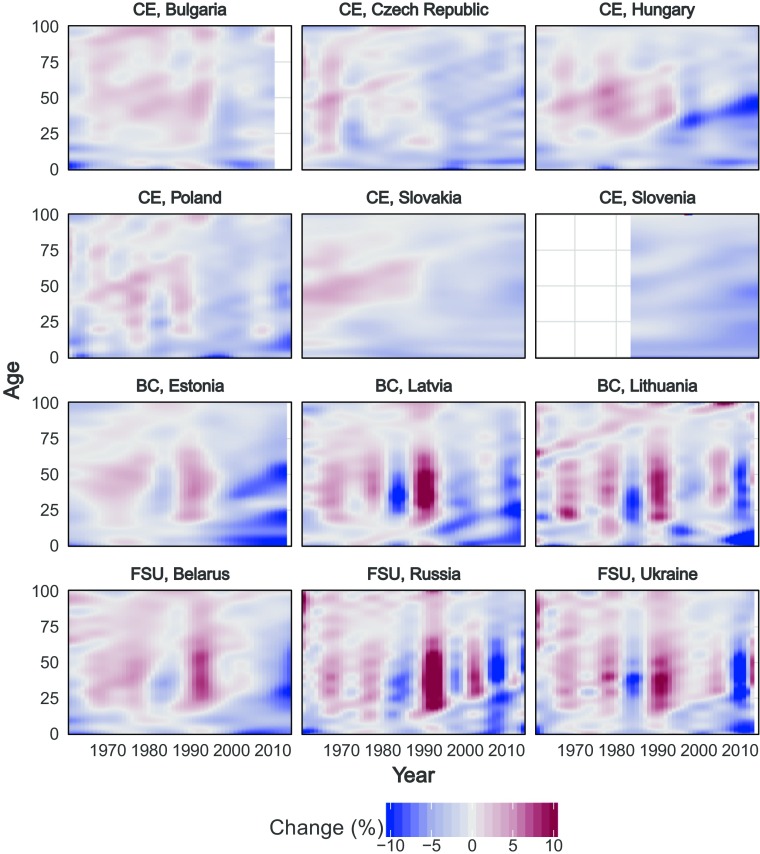
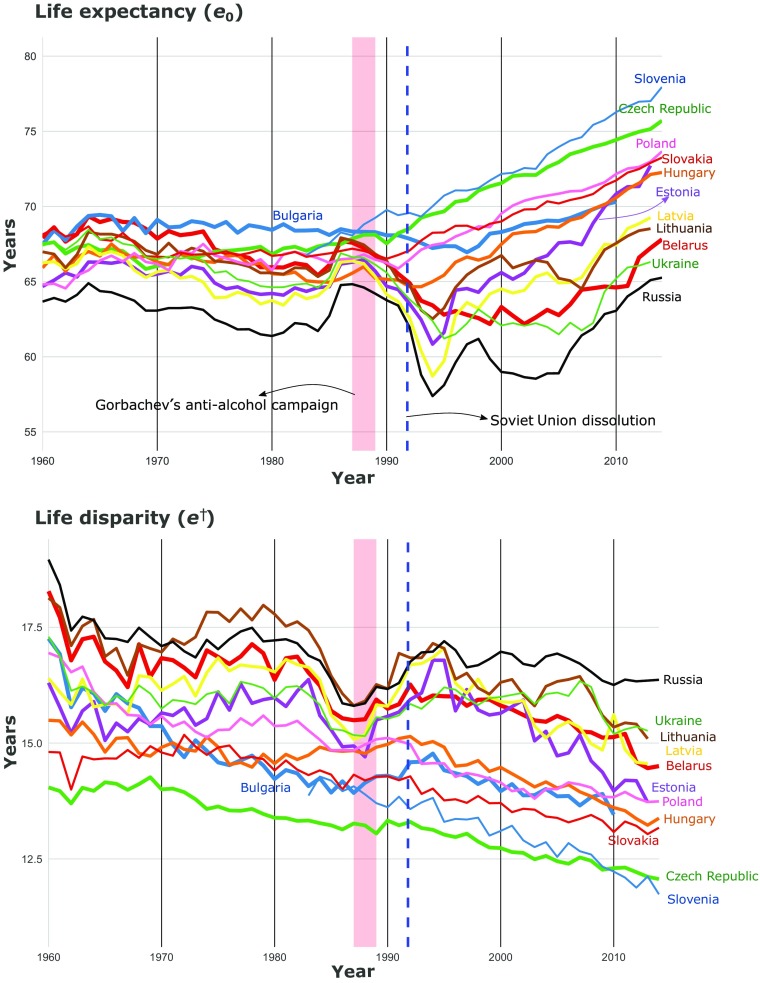
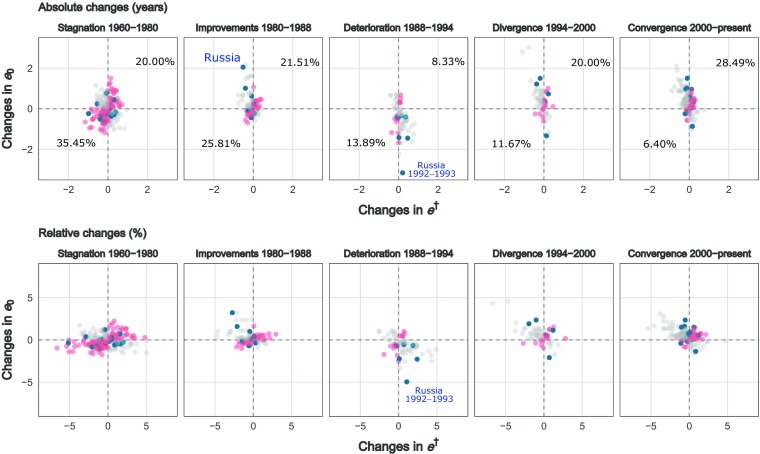
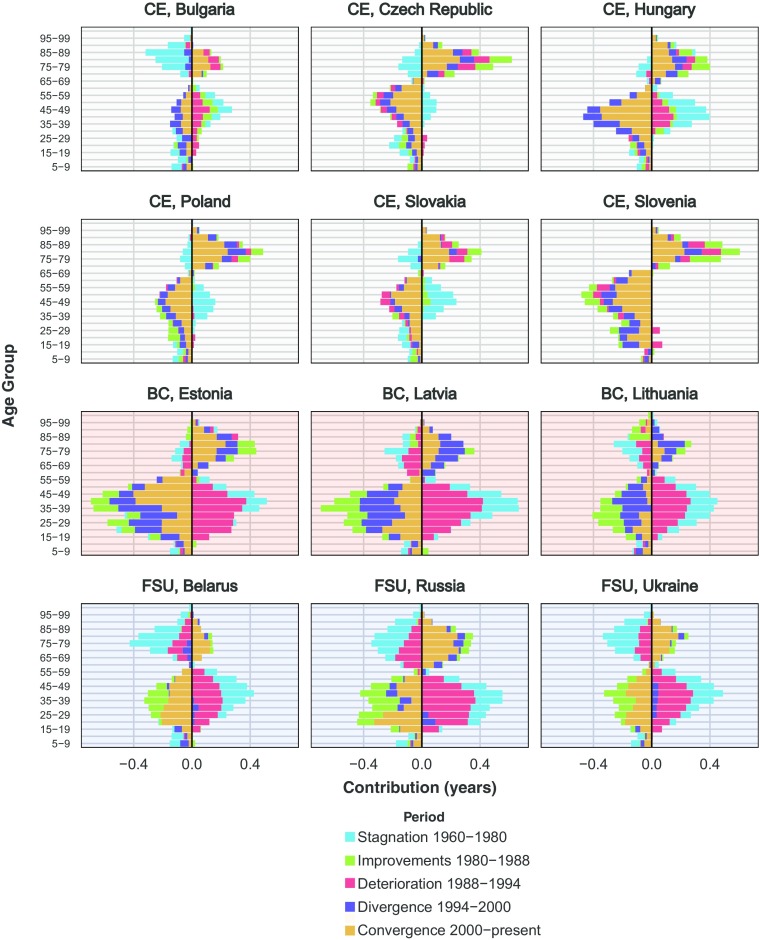
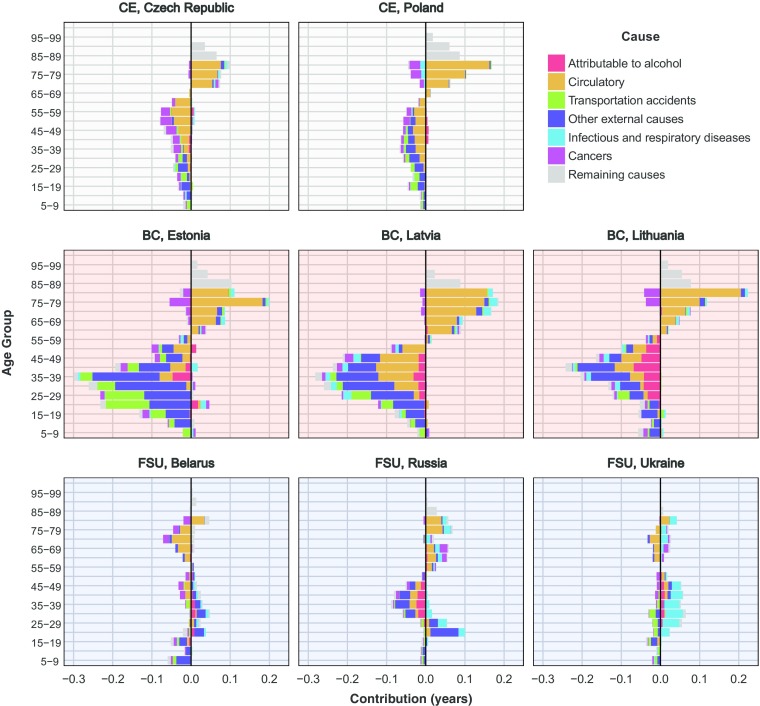
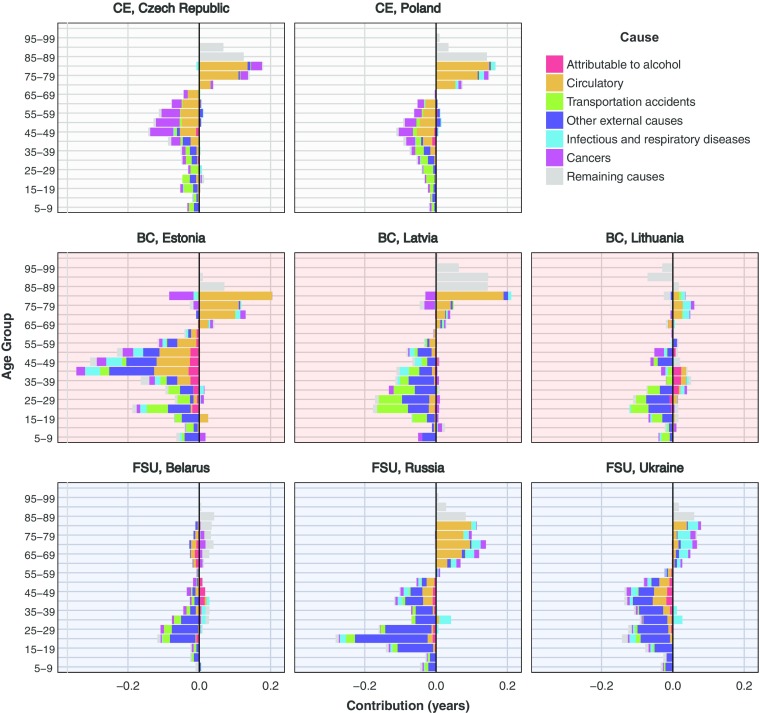
Central and Eastern Europe (CEE) have experienced considerable instability in mortality since the 1960s. Long periods of stagnating life expectancy were followed by rapid increases in life expectancy and, in some cases, even more rapid declines, before more recent periods of improvement. These trends have been well documented, but to date, no study has comprehensively explored trends in lifespan variation. We improved such analyses by incorporating life disparity as a health indicator alongside life expectancy, examining trends since the 1960s for 12 countries from the region. Generally, life disparity was high and fluctuated strongly over the period. For nearly 30 of these years, life expectancy and life disparity varied independently of each other, largely because mortality trends ran in opposite directions over different ages. Furthermore, we quantified the impact of large classes of diseases on life disparity trends since 1994 using a newly harmonized cause-of-death time series for eight countries in the region. Mortality patterns in CEE countries were heterogeneous and ran counter to the common patterns observed in most developed countries. They contribute to the discussion about life expectancy disparity by showing that expansion/compression levels do not necessarily mean lower/higher life expectancy or mortality deterioration/improvements.
Overview
The claims and statistics of this paper haven’t been checked yet.
Run the check — free, no account needed. It reads the open-access text and checks the sources it cites.
Integrity signals
Registry
Cites
Statistics
Figures
Verification
Claims the paper makes
The claims and statistics of this paper haven’t been checked yet.
Run the check — free, no account needed. It reads the open-access text and checks the sources it cites.
Claims other papers make about this one
Each is checked against this paper’s own text: does it say what the citing paper says it does?
In the citing paper
“These patterns may reflect the continued impacts of the atypical mortality transitions and a delayed cardiovascular revolution in Eastern countries compared with Western Europe,12 whereby greater co-morbidities and vulnerabilities in population health are present at these ages.”
From Quantifying impacts of the COVID-19 pandemic through life-expectancy losses: a population-level study of 29 countries (2022) · cites this paper as [12]
Self-check
Percentages, sums and reported differences re-computed from the paper’s own numbers.
The self-check needs the paper’s full text.
Citations
Cites
Socioeconomic Inequalities in Health in 22 European Countries
Mackenbach, J. P., Stirbu, I., Roskam, A.-J. R., Schaap, M. M., Menvielle, G., Leinsalu, M., & Kunst, A. E. (2008) · New England Journal of Medicine · doi:10.1056/nejmsa0707519 · Cited by 3,289
The world health report 2000 - Health systems: improving performance
Reinhardt, U., & Cheng, T.-M. (2000) · Europe PMC (PubMed Central) · doi:10.1590/s0042-96862000000800020 · Cited by 3,218
Rising morbidity and mortality in midlife among white non-Hispanic Americans in the 21st century
Case, A., & Deaton, A. (2015) · Proceedings of the National Academy of Sciences · doi:10.1073/pnas.1518393112 · Cited by 2,759
The relation between different dimensions of alcohol consumption and burden of disease: an overview
Rehm, J., Baliunas, D., Borges, G. L. G., Graham, K., Irving, H., Kehoe, T., Parry, C. D., Patra, J., Popova, S., Poznyak, V., et al. (2010) · Addiction · doi:10.1111/j.1360-0443.2010.02899.x · Cited by 1,174
Rehm, J., Room, R., Graham, K., Monteiro, M., Gmel, G., & Sempos, C. T. (2003) · Addiction · doi:10.1046/j.1360-0443.2003.00467.x · Cited by 995
Huge variation in Russian mortality rates 1984–94: artefact, alcohol, or what?
Leon, D. A., Chenet, L., Школьников, В. М., Zakharov, S., Shapiro, J., Rakhmanova, G., Vassin, S., & McKee, M. (1997) · The Lancet · doi:10.1016/s0140-6736(97)03360-6 · Cited by 780
Rectangularization revisited: Variability of age at death within human populations*
Wilmoth, J. R., & Horiuchi, S. (1999) · Demography · doi:10.2307/2648085 · Cited by 449
Zaridze, D. G., Brennan, P., Boreham, J., Boroda, A. M., Karpov, R. S., Lazarev, A. F., Конобеевская, И. Н., Igitov, V., Terechova, T., Boffetta, P., et al. (2009) · The Lancet · doi:10.1016/s0140-6736(09)61034-5 · Cited by 449
East-West mortality divide and its potential explanations: proposed research agenda
Bobák, M., & Marmot, M. G. (1996) · BMJ · doi:10.1136/bmj.312.7028.421 · Cited by 398
Comparing alcohol consumption in central and eastern Europe to other European countries
Popova, S., Rehm, J., Patra, J., & Zatonski, W. (2007) · Alcohol and Alcoholism · doi:10.1093/alcalc/agl124 · Cited by 373
Research works printed but not linked: 6
- Bellis, 2009, Off measure: How we underestimate the amount we drink
- Kingkade, 2001, Infant mortality in Eastern Europe and the former Soviet Union before and after the breakup
- Meslé, 2000, Reversal of mortality decline: The case of contemporary Russia, World Health Statistics Quarterly, 51, 191
- R Core Team, 2000, R language definition
- Rau, 2013, Rates of mortality improvement on the lexis surface
- UNICEF, 2003, Social monitor 2003
Cited by
Sorted by citations
Aburto, J. M., Schöley, J., Kashnitsky, I., Zhang, L., Rahal, C., Missov, T. I., Mills, M. C., Dowd, J. B., & Kashyap, R. (2022) · International Journal of Epidemiology · doi:10.1093/ije/dyab207 · Cited by 531
Self-citationLife expectancy changes since COVID-19
Schöley, J., Aburto, J. M., Kashnitsky, I., Kniffka, M. S., Zhang, L., Jaadla, H., Dowd, J. B., & Kashyap, R. (2022) · Nature Human Behaviour · doi:10.1038/s41562-022-01450-3 · Cited by 282
Self-citationDynamics of life expectancy and life span equality
Aburto, J. M., Villavicencio, F., Basellini, U., Kjærgaard, S., & Vaupel, J. W. (2020) · Proceedings of the National Academy of Sciences · doi:10.1073/pnas.1915884117 · Cited by 254
Self-citationSignificant impacts of the COVID-19 pandemic on race/ethnic differences in US mortality
Aburto, J. M., Tilstra, A. M., Floridi, G., & Dowd, J. B. (2022) · Proceedings of the National Academy of Sciences · doi:10.1073/pnas.2205813119 · Cited by 99
Self-citationThe long lives of primates and the ‘invariant rate of ageing’ hypothesis
Colchero, F., Aburto, J. M., Archie, E. A., Boesch, C., Breuer, T., Campos, F. A., Collins, A., Conde, D. A., Cords, M., Crockford, C., et al. (2021) · Nature Communications · doi:10.1038/s41467-021-23894-3 · Cited by 94
Self-citation
Metadata
- Authors
- Aburto, J. M., & van Raalte, A.
- Affiliations
- University of Southern Denmark (DK)
- Max Planck Institute for Demographic Research, Rostock, Germany
- Corresponding author
- Aburto, José Manuel
- ORCID
- Aburto, José Manuel
- Venue
- Demography
- Publisher
- Duke University Press
- Published
- 2018-11-12
- Volume
- 55
- Issue
- 6
- Pages
- 2071-2096
- ISSN
- 0070-3370 (ISSN-L)
- 1533-7790
- PMC
- PMC6290692
- OpenAlex
- W2786704998
- Cited by
- 133
- References
- 77
- Citations by year
- 2026: 17 · 2025: 10 · 2024: 27 · 2023: 8 · 2022: 31 · 2021: 14 · 2020: 13 · 2019: 9 · 2018: 3
- FWCI
- 20.09
- Type
- journal article
- Language
- en
- Open access
- hybrid
- doi.org
- Licence
- Locations
- Demography (publishedVersion, cc-by)
- Europe PMC (PubMed Central) (publishedVersion, cc-by)
- PubMed Central (publishedVersion, cc-by)
- PubMed (publishedVersion)
- University of Southern Denmark Research Portal (University of Southern Denmark) (publishedVersion, cc-by)
- RePEc: Research Papers in Economics (submittedVersion)
- MPG.PuRe (Max Planck Society) (submittedVersion)
- Funders
- Max Planck Institute for Demographic Research
- Topics
- Social Sciences › Demography › Insurance, Mortality, Demography, Risk Management
- Social Sciences › Health › Health disparities and outcomes
- Social Sciences › Economics, Econometrics and Finance › Economics and Econometrics › Global Health Care Issues
- Keywords
- life expectancy, mortality trends, age-specific mortality, health disparities, Central and Eastern Europe
- MeSH terms
- Aging, Europe, Eastern, Female, Humans, Life Expectancy, Longevity, Male, Mortality, Databases, Factual
About these checks
Registry, retraction, Cites and statistics results are computed, not judged, with one exception: a printed reference that no index lists is read once by a model before it counts as a citation error. Claims are extracted by a model and kept only when their quote appears verbatim in the text; each cited source is then checked, with a model’s help, for whether it says what the claim relies on. Those verdicts can be wrong — read the claim’s quote and the cited source before relying on one.
Statistics and arithmetic are recomputed, not judged.
Confidence bands are shown only for fields calibrated on our annotated test set. None is calibrated yet, so no band is shown.
What counts as a claim ›How we measure confidence ›How we check this ›
Are you an author, or do you see a problem with this page? Request a review
