

The DOI matches its Crossref record; 19 of the 21 references it cites were found in a registry or an index.
Visualizing the evolution of abnormal metabolic networks in the brain using PET
Open accessAbstract
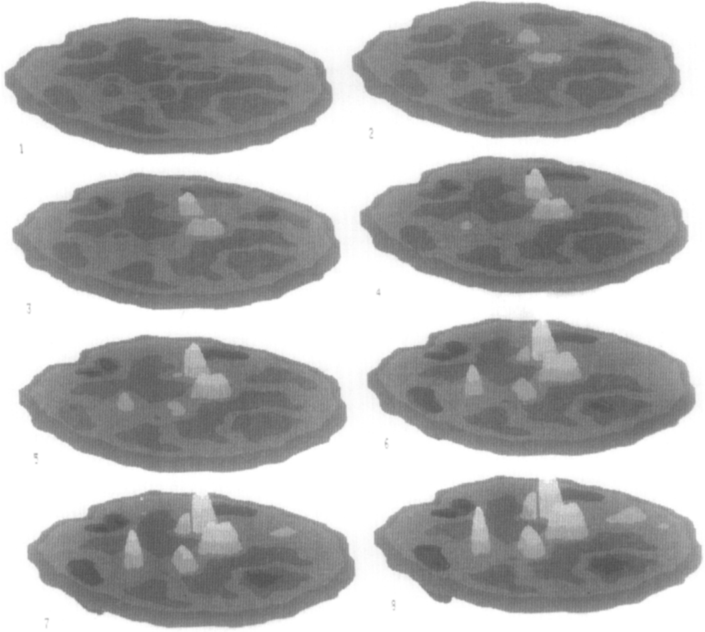
By applying novel statistical methods and visualization techniques to PET data obtained from combined groups of patients and normals, we are able to illustrate topographic covariance profiles unique to neurodegenerative disorders such as Parkinson's Disease at various stages of progression. Each profile represents a neuroanatomical network of metabolically covarying regions. The expression of the profile in each patient is characterized by a subject score which can correlate with independent clinical disease severity measures. To visualize these profiles, a semi-automatic routine is used (3D) animation of the metabolic topography as it evolves from initial to final stages of the disease.
Overview
The claims and statistics of this paper haven’t been checked yet.
Free: it reads the open-access text and checks the first 5 claims that cite a source we can check. Create a free account to check every claim.
Integrity signals
Registry
Cites
Statistics
Figures



Verification
Claims the paper makes
The claims and statistics of this paper haven’t been checked yet.
Free: it reads the open-access text and checks the first 5 claims that cite a source we can check. Create a free account to check every claim.
Claims other papers make about this one
Each is checked against this paper’s own text: does it say what the citing paper says it does?
In the citing paper
“Indeed, positron emission tomography (PET) in interferon (IFN)-alpha-treated patients revealed increased glucose metabolism in the basal ganglia, similar to Parkinson’ s disease (Eidelberg et al., 1994, Spetsieris et al., 1995, Mentis et al., 2002), where it is believed to reflect increased oscillatory burst activity in relevant basal ganglia nuclei secondary to the loss of inhibitory nigral DA”
From Inflammatory cytokines in depression: neurobiological mechanisms and therapeutic implications (2013) · cites this paper as Spetsieris et al., 1995
Self-check
Percentages, sums and reported differences re-computed from the paper’s own numbers.
The self-check needs the paper’s full text.
Citations
Cites
Phelps, M. E., Huang, S. C., Hoffman, E. J., Selin, C., Sokoloff, L., & Kuhl, D. E. (1979) · Annals of Neurology · doi:10.1002/ana.410060502 · Cited by 2,418
The Relationship between Global and Local Changes in PET Scans
Friston, K. J., Frith, C. D., Liddle, P. F., Dolan, R. J., Lammertsma, A. A., & Frackowiak, R. S. J. (1990) · Journal of Cerebral Blood Flow & Metabolism · doi:10.1038/jcbfm.1990.88 · Cited by 858
The metabolic topography of parkinsonism
Eidelberg, D., Moeller, J. R., Dhawan, V., Spetsieris, P., Takikawa, S., Ishikawa, T., Chaly, T., Robeson, W., Margouleff, D., Przedborski, S., et al. (1994) · Journal of Cerebral Blood Flow & Metabolism · doi:10.1038/jcbfm.1994.99 · Cited by 455
Self-citationThe metabolic topography of normal aging
Moeller, J. R., Ishikawa, T., Dhawan, V., Spetsieris, P., Mandel, F., Alexander, G. E., Grady, C., Pietrini, P., & Eidelberg, D. (1996) · Journal of Cerebral Blood Flow & Metabolism · doi:10.1097/00004647-199605000-00005 · Cited by 254
Self-citationThe metabolic pathology of the AIDS dementia complex
Rottenberg, D. A., Moeller, J. R., Strother, S. C., Sidtis, J. J., Navia, B. A., Dhawan, V., Ginos, J. Z., & Price, R. W. (1987) · Annals of Neurology · doi:10.1002/ana.410220605 · Cited by 236
Self-citationTakikawa, S., Dhawan, V, Spetsieris, P., Robeson, W., Chaly, T., Dahl, R., Margouleff, D., & Eidelberg, D. (1993) · Radiology · doi:10.1148/radiology.188.1.8511286 · Cited by 208
Self-citationEidelberg, D., Moeller, J. R., Dhawan, V., Sidtis, J. J., Ginos, J. Z., Strother, S. C., Cedarbaum, J., Greene, P., Fahn, S., & Rottenberg, D. A. (1990) · Movement Disorders · doi:10.1002/mds.870050304 · Cited by 204
Self-citationMoeller, J. R., & Strother, S. C. (1991) · Journal of Cerebral Blood Flow & Metabolism · doi:10.1038/jcbfm.1991.47 · Cited by 183
Self-citationThe metabolic topography of idiopathic torsion dystonia
Eidelberg, D., Moeller, J. R., Ishikawa, T., Dhawan, V., Spetsieris, P., Przedborski, S., & Fahn, S. (1995) · Brain · doi:10.1093/brain/118.6.1473 · Cited by 174
Self-citationAlexander, G. E., & Moeller, J. R. (1994) · Human Brain Mapping · doi:10.1002/hbm.460020108 · Cited by 159
Self-citation
Research works printed but not linked: 1
- Eidelberg, 1994, Detection of early Parkinson's disease with 18F-fluorodeoxyglucose and PET, J. Nucl. Med., 10P
Cited by
Inflammatory cytokines in depression: neurobiological mechanisms and therapeutic implications
Felger, J. C., & Lotrich, F. E. (2013) · Neuroscience · doi:10.1016/j.neuroscience.2013.04.060 · Cited by 1,180
Haroon, E., Raison, C. L., & Miller, A. H. (2012) · Neuropsychopharmacology · doi:10.1038/npp.2011.205 · Cited by 1,000
“…changes in the basal ganglia found in patients with Parkinson’s disease, and are believed to reflect increased oscillatory burst activity in relevant basal ganglia nuclei secondary to DA depletion (Eidelberg et al, 1994; Spetsieris et al, 1995; Wichmann and DeLong, 1999; Mentis et al, 2002).”
BackgroundInflammation Effects on Motivation and Motor Activity: Role of Dopamine
Felger, J. C., & Treadway, M. T. (2017) · Neuropsychopharmacology · doi:10.1038/npp.2016.143 · Cited by 442
Imaging the Role of Inflammation in Mood and Anxiety-related Disorders
Felger, J. C. (2018) · Current Neuropharmacology · doi:10.2174/1570159x15666171123201142 · Cited by 427
Felger, J. C., & Miller, A. H. (2012) · Frontiers in Neuroendocrinology · doi:10.1016/j.yfrne.2012.09.003 · Cited by 391
Metadata
- Authors
- Spetsieris, P. G., Moeller, J. R., Dhawan, V., Ishikawa, T., & Eidelberg, D.
- Affiliations
- Cornell University (US)
- Columbia University (US)
- Corresponding author
- Spetsieris, Phoebe G
- Venue
- Computerized Medical Imaging and Graphics
- Publisher
- Elsevier BV
- Published
- 1995-05
- Volume
- 19
- Issue
- 3
- Pages
- 295-306
- ISSN
- 0730-4862 (ISSN-L)
- 0895-6111
- OpenAlex
- W1984439450
- Cited by
- 23
- References
- 21
- Citations by year
- 2023: 2 · 2018: 1 · 2017: 1 · 2016: 2 · 2013: 2 · 2012: 1
- FWCI
- 0.43
- Type
- journal article
- Language
- en
- Open access
- hybrid
- doi.org
- Licence
- cc-by-nc-nd
- www.elsevier.com/tdm/userlicense/1.0/ (tdm)
- www.elsevier.com/legal/tdmrep-license (tdm)
- creativecommons.org/licenses/by-nc-nd/4.0/ (vor, 1718 d)
- Locations
- Computerized Medical Imaging and Graphics (publishedVersion, cc-by-nc-nd)
- PubMed (publishedVersion)
- Topics
- Life Sciences › Neuroscience › Cognitive Neuroscience › Functional Brain Connectivity Studies
- Health Sciences › Medicine › Radiology, Nuclear Medicine and Imaging › Medical Imaging Techniques and Applications
- Health Sciences › Medicine › Psychiatry and Mental health › Dementia and Cognitive Impairment Research
- Keywords
- brain metabolic network, positron emission tomography, Parkinson's disease, neurodegenerative diseases, disease progression, 3D animation, disease severity
- MeSH terms
- Adult, Aged, Aged, 80 and over, Aging, Algorithms, Brain, Brain Diseases, Deoxyglucose, Female, Fluorine Radioisotopes, Humans, Image Enhancement, Image Processing, Computer-Assisted, Male, Middle Aged, Nerve Degeneration, Nerve Net, Parkinson Disease, Tomography, Emission-Computed, Disease Progression, Fluorodeoxyglucose F18
About these checks
Registry, retraction, Cites and statistics results are computed, not judged, with one exception: a printed reference that no index lists is read once by a model before it counts as a citation error. Claims are extracted by a model and kept only when their quote appears verbatim in the text; each cited source is then checked, with a model’s help, for whether it says what the claim relies on. Those verdicts can be wrong — read the claim’s quote and the cited source before relying on one.
Statistics and arithmetic are recomputed, not judged.
Confidence bands are shown only for fields calibrated on our annotated test set. None is calibrated yet, so no band is shown.
What counts as a claim ›How we measure confidence ›How we check this ›
Are you an author, or do you see a problem with this page? Request a review
How to cite
Cite CoChat for the checks on this page, and the paper for its own findings.
- This page
- CoChat. (2026). Citation check: Visualizing the evolution of abnormal metabolic networks in the brain using PET. https://app.cochat.ai/papers/10.1016/0895-6111(95)00011-e
- The paper
- Spetsieris, P. G., Moeller, J. R., Dhawan, V., Ishikawa, T., & Eidelberg, D. (1995). Visualizing the evolution of abnormal metabolic networks in the brain using PET. Computerized Medical Imaging and Graphics. https://doi.org/10.1016/0895-6111(95)00011-e
Data sources
Bibliographic data: Semantic Scholar, OpenAlex, Crossref.
Contains information from the Semantic Scholar Academic Graph Datasets, made available under the ODC Attribution License (ODC-BY 1.0).
Semantic Scholar’s data is described in: Kinney, R., et al. (2023). The Semantic Scholar Open Data Platform. arXiv:2301.10140.
