

The DOI matches its Crossref record; 38 of the 39 references it cites were found in a registry or an index.
The Life History of 21 Breast Cancers
Open accessAbstract
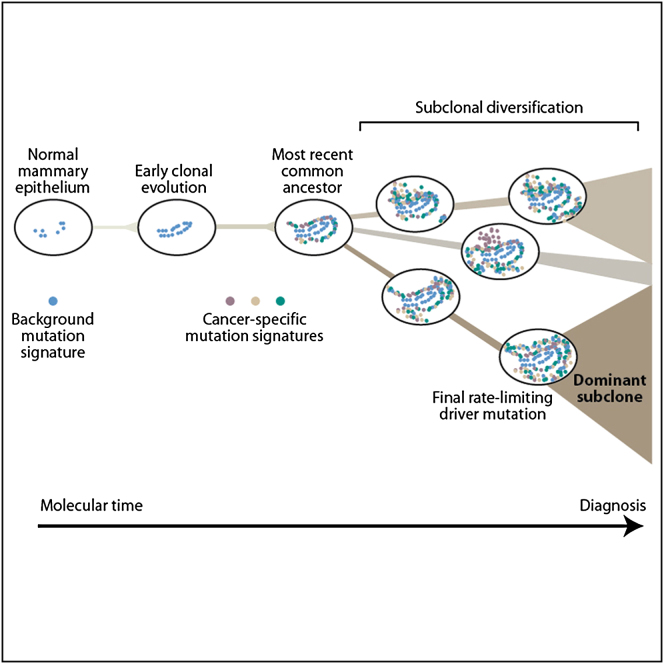
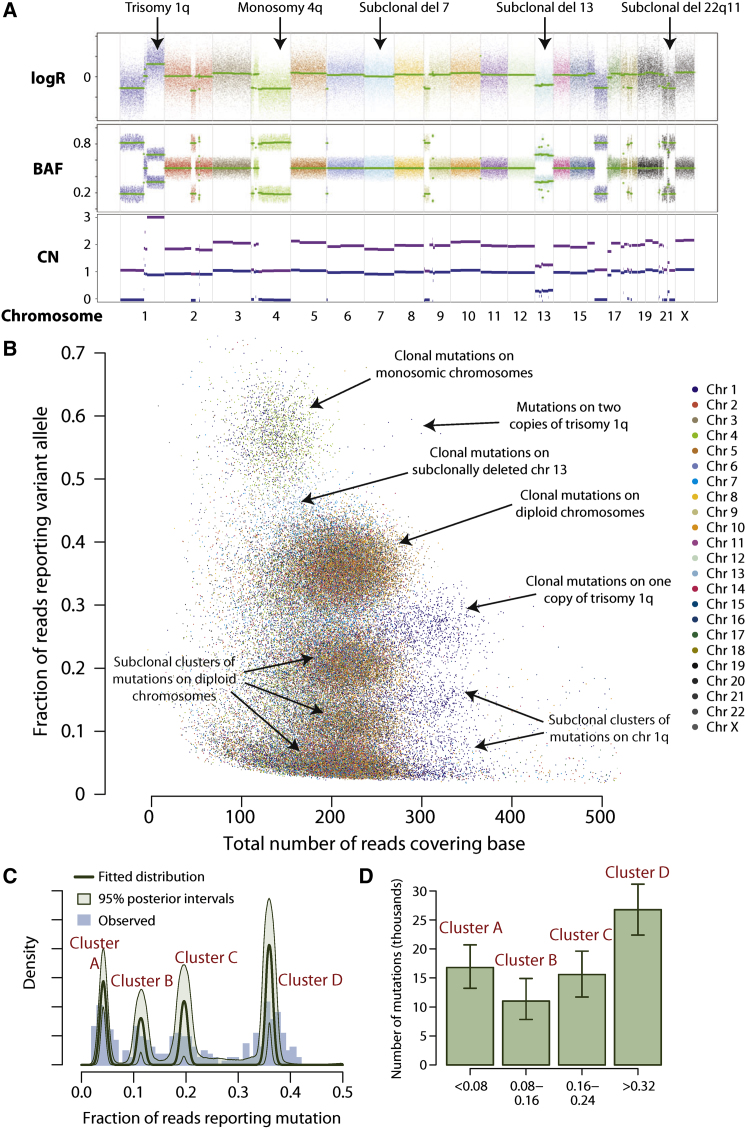
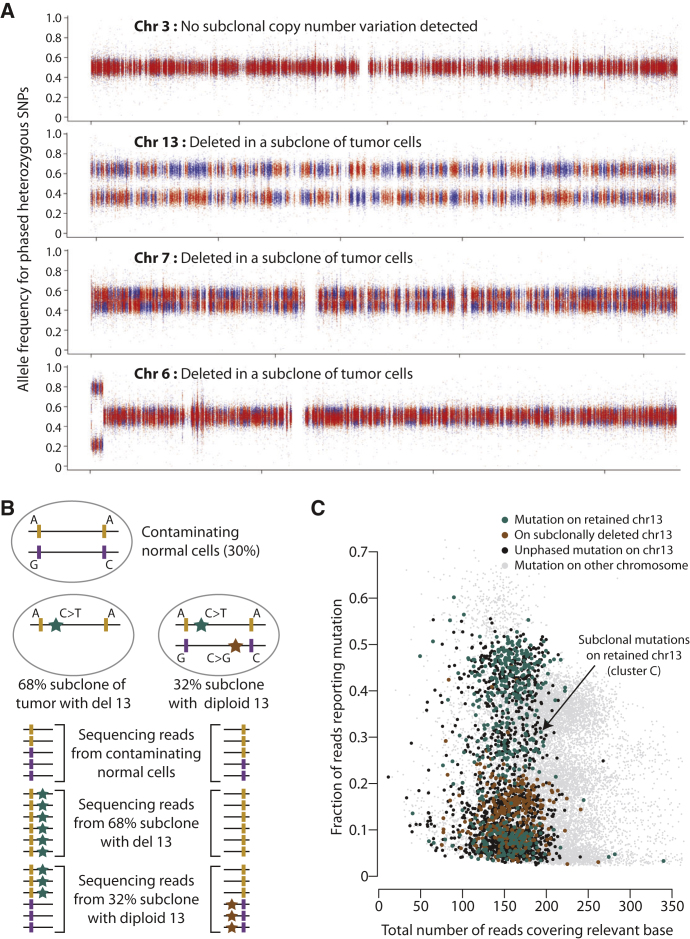
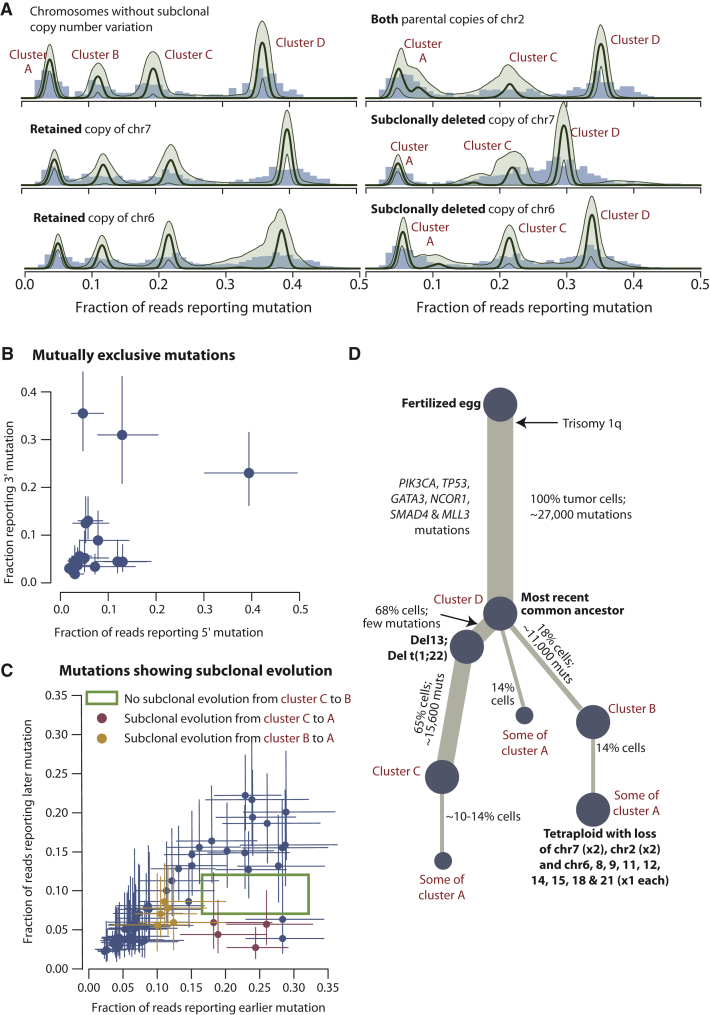
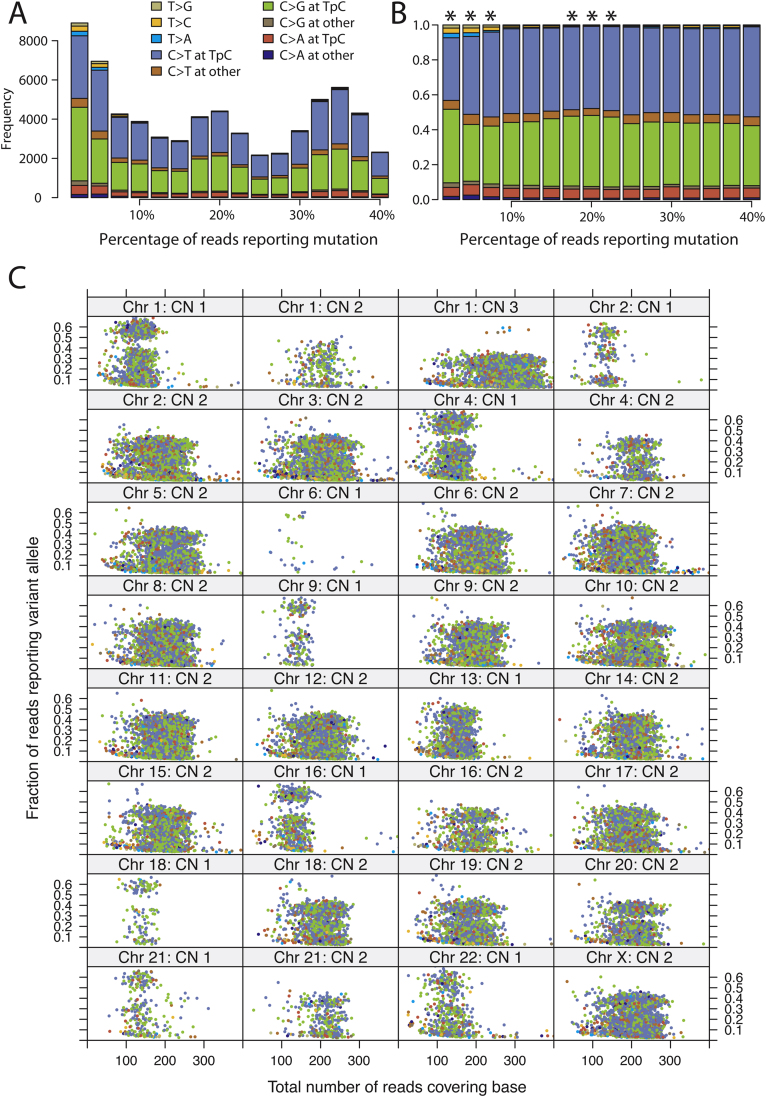
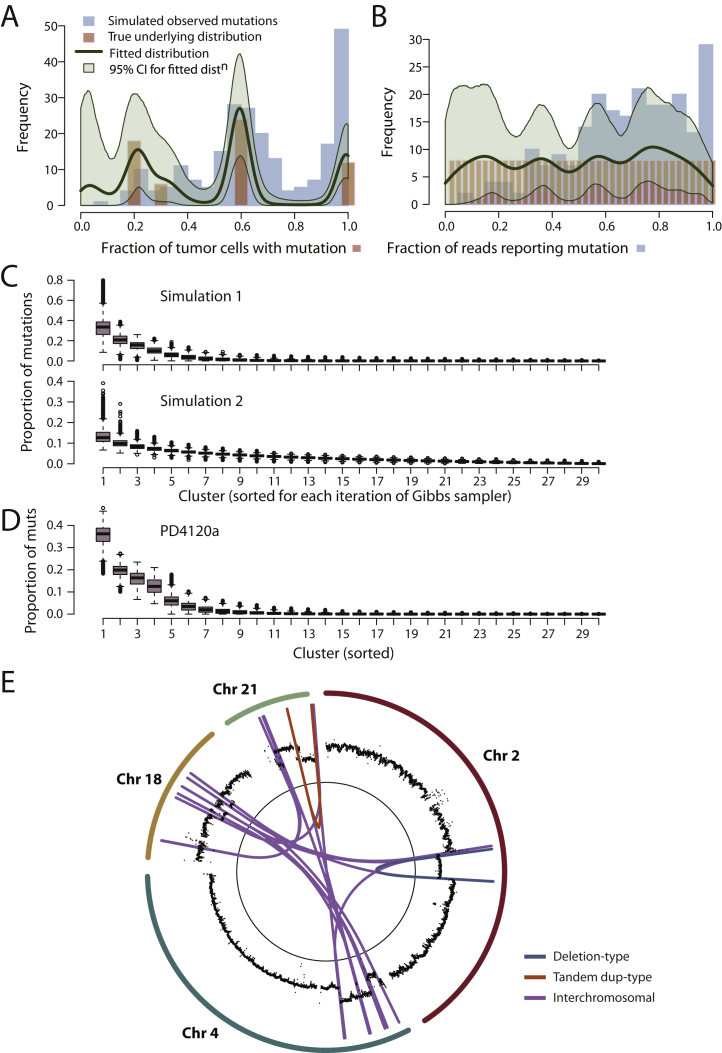
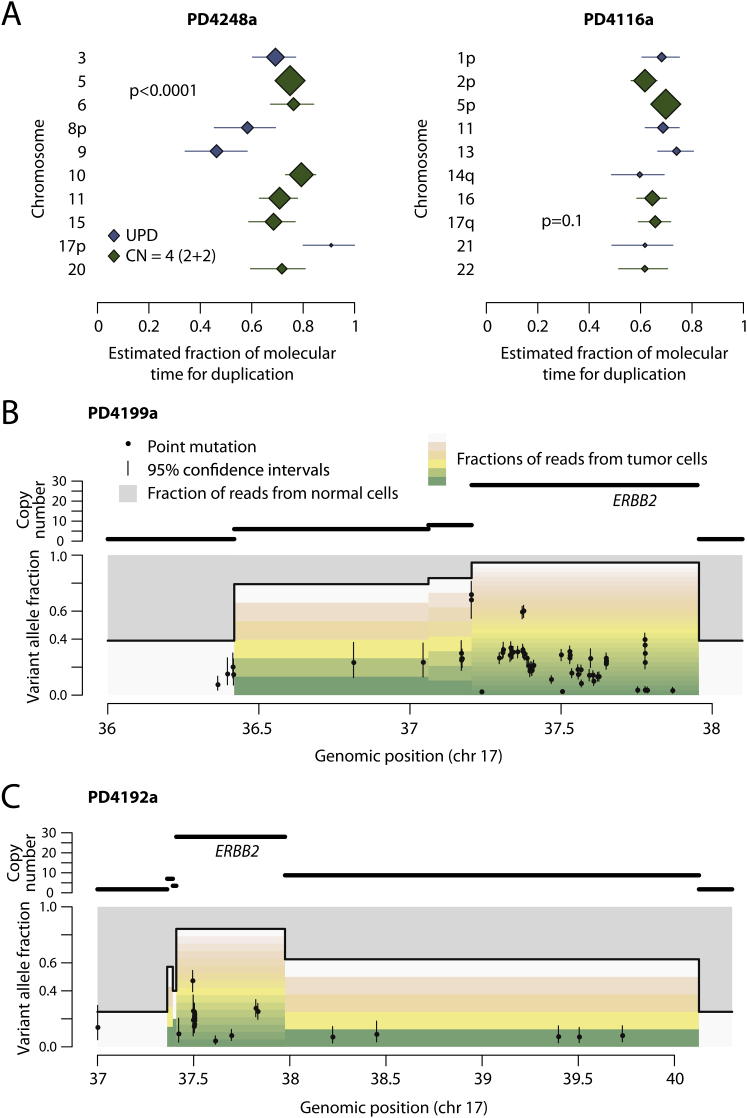
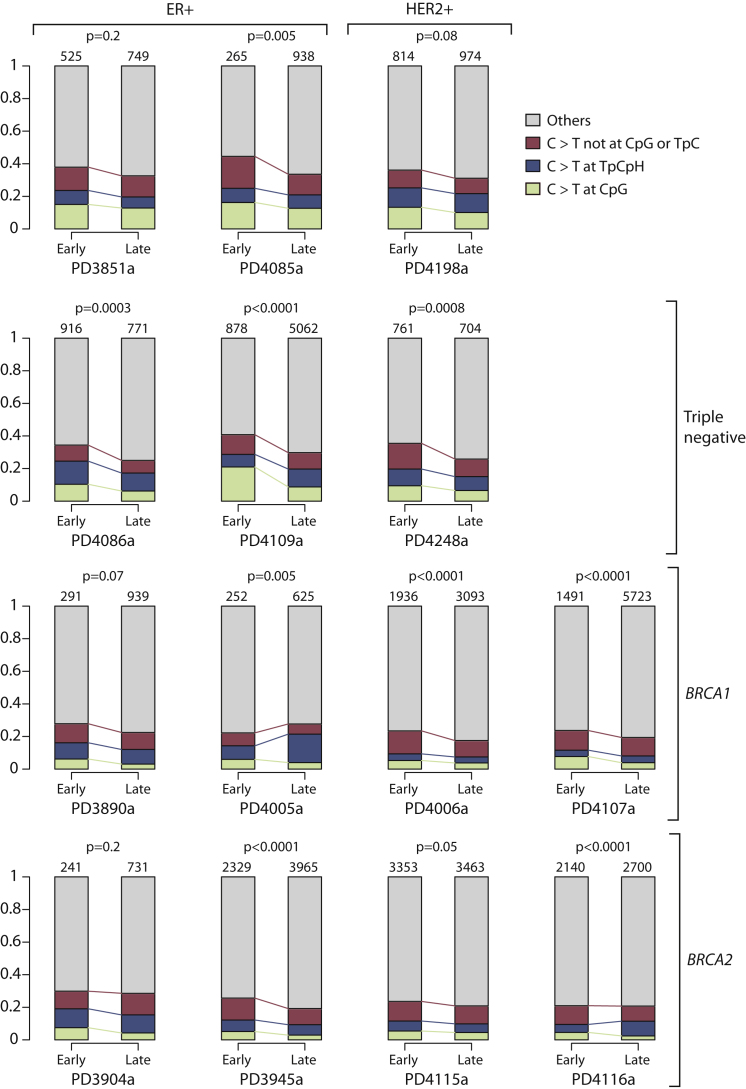
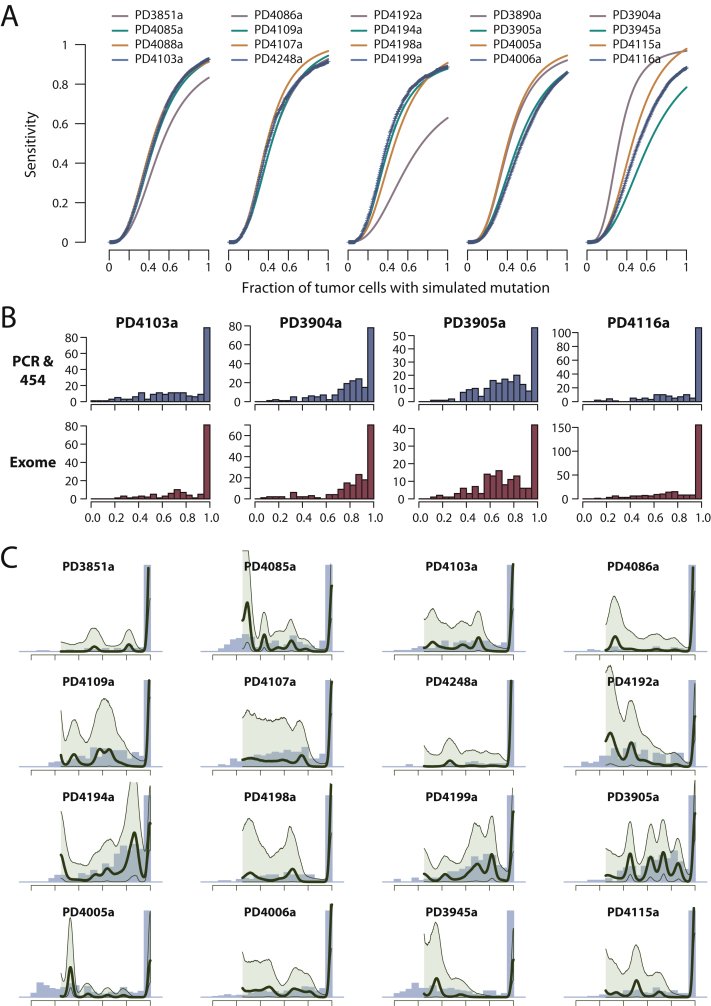
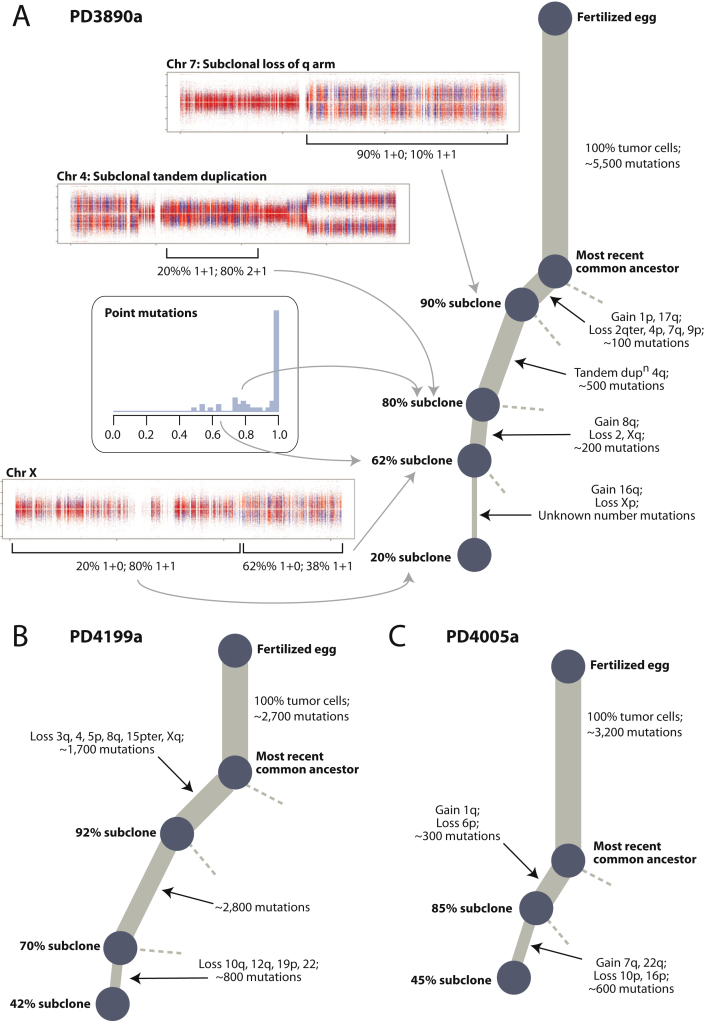
Cancer evolves dynamically as clonal expansions supersede one another driven by shifting selective pressures, mutational processes, and disrupted cancer genes. These processes mark the genome, such that a cancer's life history is encrypted in the somatic mutations present. We developed algorithms to decipher this narrative and applied them to 21 breast cancers. Mutational processes evolve across a cancer's lifespan, with many emerging late but contributing extensive genetic variation. Subclonal diversification is prominent, and most mutations are found in just a fraction of tumor cells. Every tumor has a dominant subclonal lineage, representing more than 50% of tumor cells. Minimal expansion of these subclones occurs until many hundreds to thousands of mutations have accumulated, implying the existence of long-lived, quiescent cell lineages capable of substantial proliferation upon acquisition of enabling genomic changes. Expansion of the dominant subclone to an appreciable mass may therefore represent the final rate-limiting step in a breast cancer's development, triggering diagnosis.
Overview
The claims and statistics of this paper haven’t been checked yet.
Run the check — free, no account needed. It reads the open-access text and checks the sources it cites.
Integrity signals
Registry
Cites
Statistics
Figures
Verification
Claims the paper makes
The claims and statistics of this paper haven’t been checked yet.
Run the check — free, no account needed. It reads the open-access text and checks the sources it cites.
Claims other papers make about this one
Each is checked against this paper’s own text: does it say what the citing paper says it does?
The source backs part of the claim, not all of it — or backs it for a different population, condition or comparison.
In the citing paper
“Cancer whole genome sequencing (WGS) is now feasible, with thousands of matched tumor-normal pairs successfully sequenced to date, revealing novel biological insights2–4.”
From Whole-genome sequencing of triple-negative breast cancers in a population-based clinical study (2019) · cites this paper as [3]
Experimental — accuracy not yet measured
Self-check
Percentages, sums and reported differences re-computed from the paper’s own numbers.
The self-check needs the paper’s full text.
Citations
Cites
Hallmarks of Cancer: The Next Generation
Hanahan, D., & Weinberg, R. A. (2011) · Cell · doi:10.1016/j.cell.2011.02.013 · Cited by 66,590
A map of human genome variation from population-scale sequencing.
The 1000 Genomes Project Consortium (2010) · Nature · doi:10.1038/nature09534 · Cited by 7,877
The landscape of somatic copy-number alteration across human cancers
Beroukhim, R., Mermel, C. H., Porter, D., Wei, G., Raychaudhuri, S., Donovan, J., Barretina, J., Boehm, J. S., Dobson, J., Urashima, M., et al. (2010) · Nature · doi:10.1038/nature08822 · Cited by 4,017
Core Signaling Pathways in Human Pancreatic Cancers Revealed by Global Genomic Analyses
Jones, S., Zhang, X., Parsons, D. W., Lin, J. C.-H., Leary, R. J., Angenendt, P., Mankoo, P., Carter, H., Kamiyama, H., Jimeno, A., et al. (2008) · Science · doi:10.1126/science.1164368 · Cited by 3,969
Howie, B. N., Donnelly, P., & Marchini, J. (2009) · PLoS Genetics · doi:10.1371/journal.pgen.1000529 · Cited by 3,928
Stratton, M. R., Campbell, P. J., & Futreal, P. A. (2009) · Nature · doi:10.1038/nature07943 · Cited by 3,625
Self-citationCancer stem cells in solid tumours: accumulating evidence and unresolved questions
Visvader, J. E., & Lindeman, G. J. (2008) · Nature reviews. Cancer · doi:10.1038/nrc2499 · Cited by 3,501
Patterns of somatic mutation in human cancer genomes
Greenman, C. D., Stephens, P., Smith, R., Dalgliesh, G. L., Hunter, C., Bignell, G. R., Davies, H. R., Teague, J. W., Butler, A. P., Stevens, C., et al. (2007) · Nature · doi:10.1038/nature05610 · Cited by 3,143
Self-citationTumour evolution inferred by single-cell sequencing
Navin, N., Kendall, J., Troge, J., Andrews, P., Rodgers, L., McIndoo, J., Cook, K., Stepansky, A., Levy, D., Esposito, D., et al. (2011) · Nature · doi:10.1038/nature09807 · Cited by 2,598
Distant metastasis occurs late during the genetic evolution of pancreatic cancer
Yachida, S., Jones, S., Bozic, I., Antal, T., Leary, R., Fu, B., Kamiyama, M., Hruban, R. H., Eshleman, J. R., Nowak, M. A., et al. (2010) · Nature · doi:10.1038/nature09515 · Cited by 2,502
Research works printed but not linked: 3
- 1000 Genomes Project Consortium. (2010). A map of human genome variation from population-scale sequencing. Nature 467, 1061–1073. · DOI · Paper page
- Greenman, C.D., Pleasance, E.D., Newman, S., Yang, F., Fu, B., Nik-Zainal, S., Jones, D., Lau, K.W., Carter, N., Edwards, P.A., et al. (2012). Estimation of rearrangement phylogeny for cancer genomes. Genome Res. 22, 346–361. · DOI
- Van Loo, P., Nordgard, S.H., Lingjærde, O.C., Russnes, H.G., Rye, I.H., Sun, W., Weigman, V.J., Marynen, P., Zetterberg, A., Naume, B., et al. (2010). Allele-specific copy number analysis of tumors. Proc. Natl. Acad. Sci. USA 107, 16910–16915. · DOI
Cited by
Sorted by citations
Items 901–1,000 of 1,000
SABR in oligometastatic breast cancer: Current status and future directions
Stewart, R., White, M. A., Tan, J., Siva, S., Karroum, L., & David, S. (2021) · The Breast · doi:10.1016/j.breast.2021.10.009 · Cited by 11
Genomic analysis and selected molecular pathways in rare cancers
Liu, S. V., Lenkiewicz, E., Evers, L., Holley, T., Kiefer, J., Ruiz, C. F., Glatz, K., Bubendorf, L., Demeure, M. J., Eng, C., et al. (2012) · Physical Biology · doi:10.1088/1478-3975/9/6/065004 · Cited by 11
Dendrimer‐Based Signal Amplification of Click‐Labelled DNA in Situ
Raddaoui, N., Stazzoni, S., Möckl, L., Viverge, B., Geiger, F., Engelke, H., Bräuchle, C., & Carell, T. (2017) · ChemBioChem · doi:10.1002/cbic.201700209 · Cited by 11
Phylogenetic Quantification of Intratumor HeterogeneityPreprint
Watkins, T. B. K., & Schwarz, R. F. (2017) · Cold Spring Harbor Perspectives in Medicine · doi:10.1101/cshperspect.a028316 · Cited by 10
Computational validation of clonal and subclonal copy number alterations from bulk tumour sequencingPreprint
Antonello, A., Bergamin, R., Calonaci, N., Househam, J., Milite, S., Williams, M. J., Anselmi, F., d’Onofrio, A., Sundaram, V., Sosinsky, A., et al. (2021) · bioRxiv (Cold Spring Harbor Laboratory) · doi:10.1101/2021.02.13.429885 · Cited by 11
Copy Number Analysis Reveal Genetic Risks of Penile Cancer
Yu, Y., Gao, C., Chen, Y., Wang, M., Zhang, J., Ma, X., Liu, S., Yuan, H., Li, Z., & Niu, H. (2020) · Frontiers in Oncology · doi:10.3389/fonc.2020.596261 · Cited by 10
The molecular map of CLL and Richter's syndrome
Sud, A., Parry, E. M., & Wu, C. J. (2024) · Seminars in Hematology · doi:10.1053/j.seminhematol.2024.01.009 · Cited by 10
FGFR4-driven plasticity in breast cancer progression and resistance to therapy
Braun, M., Piasecka, D., Sądej, R., & Romanska, H. (2024) · British Journal of Cancer · doi:10.1038/s41416-024-02658-y · Cited by 9
Heterogeneity and evolution of DNA mutation rates in microsatellite stable colorectal cancer
Grassi, E., Vurchio, V., Cresswell, G. D., Catalano, I., Lupo, B., Sassi, F. P., Galimi, F., Borgato, S., Ferri, M., Viviani, M., et al. (2025) · Science Translational Medicine · doi:10.1126/scitranslmed.ado1641 · Cited by 11
Clone copy number diversity is linked to survival in lung cancer
Pawlik, P., Grigoriadis, K., Bunkum, A., Coggan, H., Frankell, A. M., Martínez‐Ruiz, C., Karasaki, T., Huebner, A., Rowan, A., Fisher, J., et al. (2025) · Nature · doi:10.1038/s41586-025-09398-w · Cited by 10
The genomic map of breast cancer: which roads lead to better targeted therapies?
Balko, J. M., Stricker, T. P., & Arteaga, C. L. (2013) · Breast Cancer Research · doi:10.1186/bcr3435 · Cited by 10
An Improved Binary Differential Evolution Algorithm to Infer Tumor Phylogenetic Trees
Liang, Y., Liao, B., & Zhu, W. Q. (2017) · BioMed Research International · doi:10.1155/2017/5482750 · Cited by 10
Defining the origin, evolution, and immune composition of SDH-deficient renal cell carcinoma
Neves, J. B., Roberts, K., Sivakumaran, S., Sheikh, S. E., Tran‐Dang, M., Horsfield, C. J., Mumtaz, F., Campbell, P. J., Stauss, H. J., Tran, M. G. B., et al. (2022) · iScience · doi:10.1016/j.isci.2022.105389 · Cited by 11
Self-citationRao, S. R., Verrill, C. L., Cerundolo, L., Alham, N. K., Kaya, Z., O’Hanlon, M., Hayes, A. A., Lambert, A. G., James, M., Tullis, I. D. C., et al. (2024) · Genome Medicine · doi:10.1186/s13073-024-01302-x · Cited by 10
Self-citationRida, P. C. G., Cantuaria, G. H., Reid, M. D., Küçük, Ö., & Aneja, R. (2015) · Cancer and Metastasis Reviews · doi:10.1007/s10555-015-9590-0 · Cited by 10
Recurrent Gene Mutations in CLL
Martínez‐Trillos, A., Quesada, V., Villamor, N., Puente, X. S., López-Otı́n, C., & Campo, E. (2013) · Advances in experimental medicine and biology · doi:10.1007/978-1-4614-8051-8_4 · Cited by 11
Matsumura, S., Fujita, Y., Yamane, M., Morita, O., & Honda, H. (2018) · Scientific Reports · doi:10.1038/s41598-018-27755-w · Cited by 10
Magnes, T., Wagner, S. M., Thorner, A. R., Neureiter, D., Klieser, E., Rinnerthaler, G., Weiß, L., Huemer, F., Schlick, K., Zaborsky, N., et al. (2021) · Cancers · doi:10.3390/cancers13040650 · Cited by 10
Fan, C., Lü, W., Li, K., Zhao, C., Wang, F., Ding, G., & Wang, J. (2021) · Cancer Biomarkers · doi:10.3233/cbm-203222 · Cited by 10
Multiregional genetic evolution of metastatic uveal melanoma
Rodriguez, D. A., Yang, J., Durante, M. A., Shoushtari, A. N., Moschos, S. J., Wrzeszczyński, K. O., Harbour, J. W., & Carvajal, R. D. (2021) · npj Genomic Medicine · doi:10.1038/s41525-021-00233-5 · Cited by 10
Kuiken, H. J., Dhakal, S., Selfors, L. M., Friend, C. M., Zhang, T., Callari, M., Schackmann, R. C. J., Gray, G. K., Crowdis, J. P., Bhang, H.-E. C., et al. (2021) · Oncogene · doi:10.1038/s41388-021-02075-y · Cited by 9
Mai, Z., Liu, Q., Wang, X., Xie, J., Yuan, J., Zhong, J., Fang, S., Xie, X., Yang, H., Wen, J., et al. (2021) · Cancers · doi:10.3390/cancers13236084 · Cited by 11
SeqControl: process control for DNA sequencing
Chong, L. C., Albuquerque, M. A., Harding, N., Caloian, C., Chan-Seng-Yue, M., de Borja, R., Fraser, M., Denroche, R., Beck, T., van der Kwast, T., et al. (2014) · Nature Methods · doi:10.1038/nmeth.3094 · Cited by 10
Intratumor heterogeneity index of breast carcinomas based on DNA methylation profiles
Campoy, E., Branham, M. T., Mayorga, L. S., & Roqué, M. (2019) · BMC Cancer · doi:10.1186/s12885-019-5550-3 · Cited by 10
Issues in clinical research for metastatic breast cancer
Doğan, S., André, F., & Arnedos, M. (2013) · Current Opinion in Oncology · doi:10.1097/cco.0000000000000018 · Cited by 10
Cancer detection using whole-genome sequencing of cell free DNA
Leary, R. J., Sausen, M., Diaz, L. A., & Velculescu, V. E. (2013) · Oncotarget · doi:10.18632/oncotarget.1183 · Cited by 10
Reference bias in the Illumina Isaac aligner
Cornish, A. J., Chubb, D., Frangou, A., Hoang, P. H., Kaiser, M., Wedge, D. C., & Houlston, R. S. (2020) · Bioinformatics · doi:10.1093/bioinformatics/btaa514 · Cited by 10
Self-citationOncotree2vec — a method for embedding and clustering of tumor mutation trees
Baciu-Drăgan, M.-A., & Beerenwinkel, N. (2024) · Bioinformatics · doi:10.1093/bioinformatics/btae214 · Cited by 7
Luo, C., Liu, Y. H., & Zhou, X. (2024) · Nature Communications · doi:10.1038/s41467-024-51282-0 · Cited by 8
Cancer stem cells: Masters of all traits
Leck, L. Y. W., El-Aziz, Y. S. A., McKelvey, K. J., Park, K. C., Sahni, S., Lane, D. J. R., Skoda, J., & Jansson, P. J. (2024) · Biochimica et Biophysica Acta (BBA) - Molecular Basis of Disease · doi:10.1016/j.bbadis.2024.167549 · Cited by 9
Triplet therapy for metastatic castration‐sensitive prostate cancer: Rationale and clinical evidence
Suzuki, H., Akamatsu, S., Shiota, M., Kakiuchi, H., & Kimura, T. (2024) · International Journal of Urology · doi:10.1111/iju.15647 · Cited by 9
Meléndez-Flórez, M. P., Ortega‐Recalde, O., Rangel, N., & Rondón‐Lagos, M. (2025) · Cancers · doi:10.3390/cancers17071222 · Cited by 12
High-resolution detection of copy number alterations in single cells with HiScanner
Zhao, Y., Luquette, L. J., Veit, A. D., Wang, X., Xi, R., Viswanadham, V., Zhang, Y., Shao, D. D., Walsh, C. A., Yang, H. W., et al. (2025) · Nature Communications · doi:10.1038/s41467-025-60446-5 · Cited by 8
Jiang, W., Ding, Y., Shen, Y., Fan, L., Zhou, L., Li, Z., Zheng, Y., Zhao, P., Liu, L., Tong, Z., et al. (2016) · Oncotarget · doi:10.18632/oncotarget.14018 · Cited by 10
Lin, X., Hua, Y., Gu, S., Lv, L., Li, X., Pin, C., Dai, P., Hu, Y., Liu, A., & Li, J. (2021) · BMC Genomics · doi:10.1186/s12864-021-07696-x · Cited by 9
Hasaart, K., Manders, F., Ubels, J., Verheul, M., van Roosmalen, M. J., Groenen, N. M., Oka, R., Kuijk, E., Lopes, S. M. C. D. S., & van Boxtel, R. (2022) · iScience · doi:10.1016/j.isci.2022.103736 · Cited by 10
AmplificationTimeR: an R package for timing sequential amplification events
Jakobsdottir, G. M., Dentro, S. C., Bristow, R. G., & Wedge, D. C. (2024) · Bioinformatics · doi:10.1093/bioinformatics/btae281 · Cited by 8
Self-citationLi, Y., Zhu, R., Jin, J., Guo, H., Zhang, J., He, Z., Liang, T., & Guo, L. (2024) · International Journal of Molecular Sciences · doi:10.3390/ijms25126744 · Cited by 11
Kim, K., Yang, W., Lee, K. S., Bang, H., Jang, K., Kim, S. C., Yang, J. O., Park, S.-J., Park, K., & Choi, J. K. (2015) · Nucleic Acids Research · doi:10.1093/nar/gkv532 · Cited by 9
GoIFISH: a system for the quantification of single cell heterogeneity from IFISH images
Trinh, A. C., Rye, I. H., Almendro, V., Helland, Å., Russnes, H. G., & Markowetz, F. M. (2014) · Genome biology · doi:10.1186/preaccept-1235790177128836 · Cited by 8
Lopez, J. S., Harris, S., Roda, D., & Yap, T. A. (2015) · Translational Oncogenomics · doi:10.4137/tog.s30533 · Cited by 9
Dorri, F., Jewell, S., Bouchard‐Côté, A., & Shah, S. P. (2019) · Communications Biology · doi:10.1038/s42003-019-0291-z · Cited by 9
Robinson-Foulds Reticulation Networks
Markin, A., Anderson, T. K., Vadali, V. S. K. T., & Eulenstein, O. (2019) · ACM International Conference on Bioinformatics, Computational Biology, and Health Informatics (ACM-BCB) · doi:10.1145/3307339.3342151 · Cited by 9
Zhu, Q., Tekpli, X., Troyanskaya, O. G., & Kristensen, V. N. (2019) · Bioinformatics · doi:10.1093/bioinformatics/btz709 · Cited by 9
Synthesis, characterization and cytotoxic studies of novel 1,2,4-triazole-azomethine conjugates
Mahar, J., Saeed, A., Chaudhry, G.-E.-S., Irfan, M., Channar, P. A., Faisal, M., & Larik, F. A. (2019) · Journal of the Iranian Chemical Society · doi:10.1007/s13738-019-01826-9 · Cited by 9
Cassidy, J. W., & Bruna, A. (2017) · Elsevier eBooks · doi:10.1016/b978-0-12-804010-2.00004-7 · Cited by 9
Vavoulis, D. V., Cutts, A., Taylor, J. C., & Schuh, A. (2020) · Bioinformatics · doi:10.1093/bioinformatics/btaa672 · Cited by 9
Copy number-aware deconvolution of tumor-normal DNA methylation profilesPreprint
Cadieux, E. L., Mensah, N., Castignani, C., Tanić, M., Wilson, G. A., Dietzen, M., Dhami, P., Vaikkinen, H., Verfaillie, A., Cotobal, C., et al. (2020) · bioRxiv (Cold Spring Harbor Laboratory) · doi:10.1101/2020.11.03.366252 · Cited by 9
The APOBEC3A deaminase drives episodic mutagenesis in cancer cellsPreprint
Petljak, M., Chu, K., Dananberg, A., Bergstrom, E. N., von Morgen, P., Alexandrov, L. B., Stratton, M. R., & Maciejowski, J. (2021) · bioRxiv (Cold Spring Harbor Laboratory) · doi:10.1101/2021.02.14.431145 · Cited by 9
Self-citationA spatiotemporal cancer cell trajectory underlies glioblastoma heterogeneity
de Jong, G., Memi, F., Gracia, T., Lazareva, O., Gould, O., Solomou, G., Aivazidis, A., Dave, M., Zhang, Q., Jensen, M., et al. (2026) · Nature · doi:10.1101/2025.05.13.653495 · Cited by 10
Detecting and quantifying clonal selection in somatic stem cells
Körber, V., Jakobsen, N. A., Ansari‐Pour, N., Moore, R., Claudino, N., Metzner, M., Thielecke, E., Esau, F., Usukhbayar, B., Salazar, M. A., et al. (2025) · Nature Genetics · doi:10.1038/s41588-025-02217-y · Cited by 14
Natural History of Germline BRCA1 Mutated and BRCA Wild-type Triple-negative Breast Cancer
Gardi, N., Chaubal, R., Parab, P. A., Pachakar, S., Kulkarni, S. S., Shet, T. M., Joshi, S. P., Kembhavi, Y., Chandrani, P., Quist, J., et al. (2024) · Cancer Research Communications · doi:10.1158/2767-9764.crc-23-0277 · Cited by 8
Bonni, S., Brindley, D. N., Chamberlain, M. D., Baghbadorani, N. D., Freywald, A., Hemmings, D. G., Hombach‐Klonisch, S., Klonisch, T. C., Raouf, A., Shemanko, C. S., et al. (2024) · Cancers · doi:10.3390/cancers16050911 · Cited by 12
Mutational landscape of inflammatory breast cancer
Bertucci, F., Lerebours, F., Ceccarelli, M., Guillé, A., Syed, N., Finetti, P., Adélaı̈de, J., Laere, S. V., Gonçalvès, A., Viens, P., et al. (2024) · Journal of Translational Medicine · doi:10.1186/s12967-024-05198-4 · Cited by 11
Prediction of early breast cancer patient survival using ensembles of hypoxia signatures
Gong, I. Y., Fox, N. S., Huang, V., & Boutros, P. C. (2018) · PLoS ONE · doi:10.1371/journal.pone.0204123 · Cited by 8
Hong, M. K. H., Sapre, N., Phal, P. M., Macintyre, G., Chin, X., Pedersen, J. S., Ryan, A., Kerger, M., Costello, A. J., Corcoran, N. M., et al. (2013) · Clinical & Experimental Metastasis · doi:10.1007/s10585-013-9617-2 · Cited by 8
Exact, time-independent estimation of clone size distributions in normal and mutated cells
Roshan, A., Jones, P. H., & Greenman, C. (2014) · Journal of The Royal Society Interface · doi:10.1098/rsif.2014.0654 · Cited by 8
Self-citationRareVar: A Framework for Detecting Low-Frequency Single-Nucleotide Variants
Hao, Y., Xuei, X., Li, L., Nakshatri, H., Edenberg, H. J., & Liu, Y. (2017) · Journal of Computational Biology · doi:10.1089/cmb.2017.0057 · Cited by 8
Clarke, M. A., Woodhouse, S., Piterman, N., Hall, B. A., & Fisher, J. (2019) · Computational biology · doi:10.1007/978-3-030-17297-8_5 · Cited by 8
Treviño, V. (2019) · Molecular Genetics & Genomic Medicine · doi:10.1002/mgg3.810 · Cited by 8
Quantification of within-sample genetic heterogeneity from SNP-array data
Martinez, P., Kimberley, C., Birkbak, N. J., Marquard, A. M., Szállási, Z., & Graham, T. A. (2017) · Scientific Reports · doi:10.1038/s41598-017-03496-0 · Cited by 8
Reply: Is the evolution of tumors Darwinian or non-Darwinian?
Williams, M. J., Werner, B., Barnes, C. P., Graham, T. A., & Sottoriva, A. (2018) · National Science Review · doi:10.1093/nsr/nwx131 · Cited by 8
Funnell, T., Zhang, A., Shiah, Y.-J., Grewal, D. S., Lesurf, R., McKinney, S. E., Bashashati, A., Wang, Y. K., Boutros, P. C., & Shah, S. P. (2018) · bioRxiv (Cold Spring Harbor Laboratory) · doi:10.1101/267500 · Cited by 8
A Computational Framework To Infer The Order Of Accumulating Mutations In Individual TumorsPreprint
Ramazzotti, D., De Sano, L., Caravagna, G., Graudenzi, A., & Antoniotti, M. (2017) · BOA (University of Milano-Bicocca) · doi:10.1101/132183
Concurrent L1 retrotransposition events promote reciprocal translocations in human tumorigenesis
Zumalave, S., Santamarina, M., Espasandín, N. P., Zamora, J., García‐Souto, D., Temes, J., Baker, T. M., Rodríguez‐Castro, J., Otero, P., Pequeño‐Valtierra, A., et al. (2026) · Science · doi:10.1126/science.aee4513 · Cited by 13
Lei, Y. L., Lui, V. W. Y., Grandis, J. R., & Egloff, A. M. (2014) · PLoS ONE · doi:10.1371/journal.pone.0085619 · Cited by 7
Clonal tracking in cancer and metastasis
Aalam, S. M. M., Nguyen, L. V., Ritting, M. L., & Kannan, N. (2023) · Cancer and Metastasis Reviews · doi:10.1007/s10555-023-10149-4 · Cited by 8
Rethinking cancer initiation: The role of large‐scale mutational events
Shah, A. (2023) · Genes Chromosomes and Cancer · doi:10.1002/gcc.23213 · Cited by 8
Clonal expansion in normal tissues
Maeda, H., & Kakiuchi, N. (2024) · Cancer Science · doi:10.1111/cas.16183 · Cited by 7
Orchard: Building large cancer phylogenies using stochastic combinatorial search
Kulman, E., Kuang, R., & Morris, Q. (2024) · PLoS Computational Biology · doi:10.1371/journal.pcbi.1012653 · Cited by 7
Ultradeep analysis of tumor heterogeneity in regions of somatic hypermutation
Spence, J. M., Spence, J. P., Abumoussa, A. L., & Burack, R. (2015) · Genome Medicine · doi:10.1186/s13073-015-0147-1 · Cited by 7
New generation of breast cancer clinical trials implementing molecular profiling
Zardavas, D., Zardavas, D., Piccart, M. J., & Piccart, M. J. (2016) · Cancer Biology and Medicine · doi:10.20892/j.issn.2095-3941.2015.0099 · Cited by 7
Boniolo, G., & Campaner, R. (2019) · European Journal for Philosophy of Science · doi:10.1007/s13194-019-0257-5 · Cited by 7
Xiang, D., Tao, L., & Li, Z. (2019) · Journal of Visualized Experiments · doi:10.3791/59502 · Cited by 7
Posterior Contraction Rates of the Phylogenetic Indian Buffet Processes
Chen, M., Gao, C., & Zhao, H. (2015) · Bayesian Analysis · doi:10.1214/15-ba958 · Cited by 11
Górecki, P., Paszek, J., & Eulenstein, O. (2014) · Lecture notes in computer science · doi:10.1007/978-3-319-08171-7_19 · Cited by 7
Identification of Allelic Imbalance with a Statistical Model for Subtle Genomic Mosaicism
Xia, R., Vattathil, S., & Scheet, P. A. (2014) · PLoS Computational Biology · doi:10.1371/journal.pcbi.1003765 · Cited by 7
DiNAMO: highly sensitive DNA motif discovery in high-throughput sequencing data
Saad, C., Noé, L., Richard, H., Leclerc, J., Buisine, M., Touzet, H., & Figeac, M. (2018) · BMC Bioinformatics · doi:10.1186/s12859-018-2215-1 · Cited by 7
Mutagenicity Profile Induced by UVB Light in Human Xeroderma Pigmentosum Group C Cells†
Ruiz, N. Q., Corradi, C., Moreno, N. C., de Souza, T. A., Castro, L. P., Rocha, C. R. R., & Menck, C. F. M. (2021) · Photochemistry and Photobiology · doi:10.1111/php.13516 · Cited by 8
Stachler, M. D., Bao, C., Tourdot, R. W., Brunette, G. J., Stewart, C., Sun, L., Baba, H., Watanabe, M., Agoston, A., Jajoo, K., et al. (2021) · bioRxiv (Cold Spring Harbor Laboratory) · doi:10.1101/2021.03.26.437288 · Cited by 7
Genome-wide mutational signatures of immunological diversification in normal lymphocytesPreprint
Machado, H. E., Mitchell, E., Øbro, N. F., Kübler, K., Davies, M., Maura, F., Leongamornlert, D. A., Sanders, M. A., Cagan, A., McDonald, C., et al. (2021) · bioRxiv (Cold Spring Harbor Laboratory) · doi:10.1101/2021.04.29.441939 · Cited by 7
Self-citationSynchronous L1 retrotransposition events promote chromosomal crossover early in human tumorigenesisPreprint
Zumalave, S., Santamarina, M., Espasandín, N. P., García‐Souto, D., Temes, J., Baker, T. M., Pequeño‐Valtierra, A., Otero, I., Rodríguez‐Castro, J., Oitabén, A., et al. (2024) · bioRxiv (Cold Spring Harbor Laboratory) · doi:10.1101/2024.08.27.596794 · Cited by 8
Deciphering lung adenocarcinoma evolution and the role of LINE-1 retrotranspositionPreprint
Zhang, T., Zhao, W., Wirth, C., Díaz‐Gay, M., Yin, J., Cecati, M., Marchegiani, F., Hoang, P. H., Leduc, C., Baine, M. K., et al. (2025) · bioRxiv (Cold Spring Harbor Laboratory) · doi:10.1101/2025.03.14.643063 · Cited by 7
Self-citationJoint inference of cell lineage and mitochondrial evolution from single-cell sequencing data
Sashittal, P., Chen, V., Pasarkar, A. P., & Raphael, B. J. (2024) · Bioinformatics · doi:10.1093/bioinformatics/btae231 · Cited by 7
Saoud, C., Gundem, G., Domenico, D., Ossa, J. A., Reed, D. R., Vaynrub, M., Papaemmanouil, E., Bale, T., & Linos, K. D. (2025) · Genes Chromosomes and Cancer · doi:10.1002/gcc.70025 · Cited by 7
DNA Methylation Epitypes of Burkitt Lymphoma with Distinct Molecular and Clinical Features
Thomas, N., García-Prieto, C. A., Dreval, K., Hilton, L. K., Abramson, J. S., Bartlett, N. L., Bethony, J., Bowen, J., Bryan, A. C., Casper, C., et al. (2025) · Blood Cancer Discovery · doi:10.1158/2643-3230.bcd-24-0240 · Cited by 6
Bowes, A. L., Waise, S., Lesluyes, T., Butters, T., English, C., Yan, H., Verfaillie, A., Davies, C., Chen, J., Nye, E. L., et al. (2025) · Cancer Letters · doi:10.1016/j.canlet.2025.218173 · Cited by 6
McElderry, J. P., Zhang, T., Wei, Z., Hoang, P. H., Anyaso-Samuel, S., Sang, J., Khandekar, A., Hartman, C., Colón-Matos, F. J., Miraftab, M., et al. (2025) · Nature Communications · doi:10.1038/s41467-025-66780-y · Cited by 8
Self-citationInferring cancer type-specific patterns of metastatic spread using Metient
Koyyalagunta, D., Ganesh, K., & Morris, Q. (2025) · Nature Methods · doi:10.1038/s41592-025-02924-8 · Cited by 6
Examining the role of extrachromosomal DNA in lung cancer
Khandekar, A., Hoang, P. H., Luebeck, J., Díaz‐Gay, M., Zhao, W., McElderry, J. P., Hartman, C., Miraftab, M., Lee, O. W., Barnao, K. M., et al. (2026) · JNCI Journal of the National Cancer Institute · doi:10.1093/jnci/djag273 · Cited by 6
Self-citationManhattan Path-Difference Median Trees
Markin, A., & Eulenstein, O. (2016) · ACM International Conference on Bioinformatics, Computational Biology, and Health Informatics (ACM-BCB) · doi:10.1145/2975167.2975209 · Cited by 6
APOBEC3G protects the genome of human cultured cells and mice from radiation‐induced damage
Britan‐Rosich, E., Ma, J., Kotler, E., Hassan, F., Botvinnik, A., Smith, Y., Moshel, O., Nasereddin, A., Sharma, G., Pikarsky, E., et al. (2022) · FEBS Journal · doi:10.1111/febs.16673 · Cited by 5
On the patterns of genetic intra-tumor heterogeneity before and after treatment
Stein, A., & Werner, B. (2025) · Genetics · doi:10.1093/genetics/iyaf101 · Cited by 8
Ploidy-Seq: inferring mutational chronology by sequencing polyploid tumor subpopulations
Malhotra, A., Wang, Y., Waters, J., Chen, K., Meric‐Bernstam, F., Hall, I. M., & Navin, N. E. (2015) · Genome Medicine · doi:10.1186/s13073-015-0127-5 · Cited by 6
Consensus properties and their large-scale applications for the gene duplication problem
Moon, J., Lin, H. T., & Eulenstein, O. (2016) · Journal of Bioinformatics and Computational Biology · doi:10.1142/s0219720016420051 · Cited by 6
Felts, S. J., Tang, X., Willett, B., Keulen, V. P. V., Hansen, M. J., Kalari, K. R., & Pease, L. R. (2019) · Communications Biology · doi:10.1038/s42003-019-0460-0 · Cited by 6
Holistic cancer genome profiling for every patient
Nik‐Zainal, S., Memari, Y., & Davies, H. R. (2020) · Swiss Medical Weekly · doi:10.4414/smw.2020.20158 · Cited by 6
Self-citationQuantifying the influence of mutation detection on tumour subclonal reconstruction
Liu, L., Bhandari, V., Salcedo, A., Espiritu, S. M. G., Morris, Q., Kislinger, T., & Boutros, P. C. (2020) · RePEc: Research Papers in Economics · Cited by 6
Phylogenetic analysis of combined lobular and ductal carcinoma of the breast
Kobayashi, H., Nakai, T., Nakanishi, Y., Esumi, M., & Masuda, S. (2021) · Molecular Medicine Reports · doi:10.3892/mmr.2021.12357 · Cited by 6
Li, L., Dong, K., Wang, X., Zhang, M., Li, J., Nussler, A. K., Xiao, X., Wang, H., & Wu, Y. (2021) · Chinese Chemical Letters · doi:10.1016/j.cclet.2021.09.055 · Cited by 6
Metadata
- Authors
- Nik-Zainal, S., Van Loo, P., Wedge, D. C., Alexandrov, L. B., Greenman, C. D., Lau, K. W., Raine, K., Jones, D., Marshall, J., Ramakrishna, M., Shlien, A., Cooke, S. L., Hinton, J., Menzies, A., Stebbings, L. A., Leroy, C., Jia, M., Rance, R., Mudie, L. J., Gamble, S. J., Stephens, P. J., McLaren, S., Tarpey, P. S., Papaemmanuil, E., Davies, H. R., Varela, I., McBride, D. J., Bignell, G. R., Leung, K., Butler, A. P., Teague, J. W., Martin, S., Jönsson, G., Mariani, O., Boyault, S., Miron, P., Fatima, A., Langerød, A., Aparicio, S. A. J. R., Tutt, A., Sieuwerts, A. M., Borg, Å., Thomas, G., Salomon, A. V., Richardson, A. L., Børresen-Dale, A.-L., Futreal, P. A., Stratton, M. R., & Campbell, P. J.
- Affiliations
- Wellcome Sanger Institute (GB)
- University of East Anglia (GB)
- King's College London (GB)
- Institut Curie (FR)
- Lyon 1 Université (FR)
- Dana-Farber Cancer Institute (US)
- Oslo University Hospital (NO)
- University of British Columbia (CA)
- Erasmus MC (NL)
- Lund University (SE)
- Brigham and Women's Hospital (US)
- University of Cambridge (GB)
- Corresponding author
- Campbell, Peter J.
- ORCID
- Wedge, David C.
- Alexandrov, Ludmil B.
- Lau, King Wai
- Raine, Keiran
- Jones, David
- Marshall, John
- Ramakrishna, Manasa
- Shlien, Adam
- Hinton, Jonathan
- Menzies, Andrew
- Jia, Mingming
- Tarpey, Patrick S.
- Papaemmanuil, Elli
- Davies, Helen R.
- Varela, Ignacio
- McBride, David J.
- Teague, Jon W.
- Martin, Sancha
- Jönsson, Goran
- Mariani, Odette
- Boyault, Sandrine
- Miron, Penelope
- Aparicio, Samuel A.J.R.
- Tutt, Andrew
- Sieuwerts, Anieta M.
- Borg, Åke
- Thomas, Gilles
- Richardson, Andrea L.
- Futreal, P. Andrew
- Stratton, Michael R.
- Campbell, Peter J.
- Venue
- Cell
- Publisher
- Elsevier BV
- Published
- 2012-05
- Volume
- 149
- Issue
- 5
- Pages
- 994-1007
- ISSN
- 0092-8674 (ISSN-L)
- PMC
- PMC3428864
- OpenAlex
- W2109991075
- Cited by
- 1,443
- References
- 39
- Citations by year
- 2026: 51 · 2025: 77 · 2024: 83 · 2023: 84 · 2022: 71 · 2021: 112 · 2020: 105 · 2019: 93 · 2018: 114 · 2017: 103 · 2016: 100 · 2015: 126 · 2014: 139 · 2013: 140 · 2012: 44
- FWCI
- 47.68
- Type
- journal article
- Language
- en
- Update notices
- erratum (2015-08-13)
- Open access
- hybrid
- doi.org
- Licence
- Locations
- Cell (publishedVersion, cc-by)
- Europe PMC (PubMed Central) (publishedVersion, cc-by)
- PubMed Central (publishedVersion, cc-by)
- PubMed (publishedVersion)
- ENLIGHTEN (Jurnal Bimbingan dan Konseling Islam) (acceptedVersion)
- UEA Digital Repository (University of East Anglia) (acceptedVersion)
- Research Portal (King's College London) (submittedVersion, other-oa)
- Lirias (KU Leuven) (submittedVersion)
- Lund University Publications (Lund University) (submittedVersion)
- Research Explorer (The University of Manchester) (submittedVersion)
- Apollo (University of Cambridge) (submittedVersion, cc-by)
- Apollo (cc-by)
- Funders
- Wellcome Trust (088340, 093867, WT088340MA, 098051)
- National Institute for Health and Care Research
- European Commission (242006)
- National Cancer Institute (CA 089393, P50CA089393)
- Topics
- Life Sciences › Biochemistry, Genetics and Molecular Biology › Cancer Research › Cancer Genomics and Diagnostics
- Health Sciences › Medicine › Oncology › Cancer Cells and Metastasis
- Life Sciences › Biochemistry, Genetics and Molecular Biology › Molecular Biology › Single-cell and spatial transcriptomics
- Keywords
- breast cancer, tumor evolution, clonal evolution, somatic mutations, mutational processes, clonal expansion, cancer genomics
- MeSH terms
- Algorithms, Breast Neoplasms, Cell Transformation, Neoplastic, Chromosome Aberrations, Female, Humans, Mutation, Point Mutation, Clonal Evolution
About these checks
Registry, retraction, Cites and statistics results are computed, not judged, with one exception: a printed reference that no index lists is read once by a model before it counts as a citation error. Claims are extracted by a model and kept only when their quote appears verbatim in the text; each cited source is then checked, with a model’s help, for whether it says what the claim relies on. Those verdicts can be wrong — read the claim’s quote and the cited source before relying on one.
Statistics and arithmetic are recomputed, not judged.
Confidence bands are shown only for fields calibrated on our annotated test set. None is calibrated yet, so no band is shown.
What counts as a claim ›How we measure confidence ›How we check this ›
Are you an author, or do you see a problem with this page? Request a review
