

The DOI matches its Crossref record; 21 of the 21 references it cites were found in a registry or an index.
Deep Profiling of Mouse Splenic Architecture with CODEX Multiplexed Imaging
Open accessPublished version of a preprint
Abstract
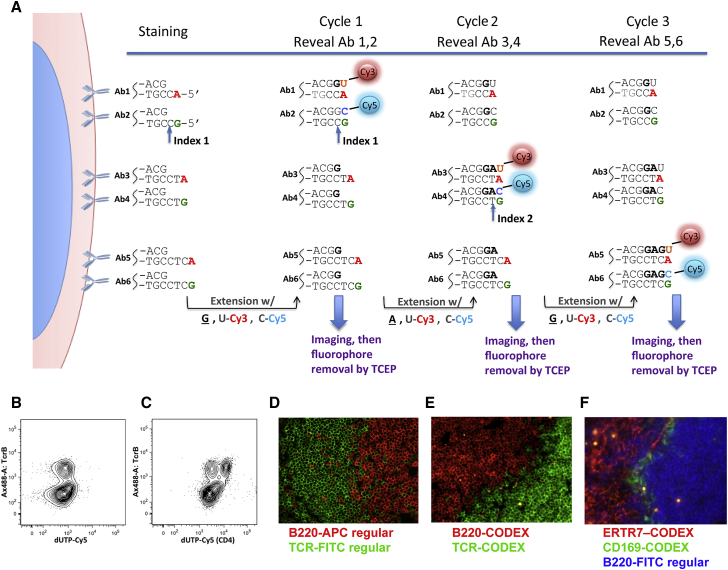
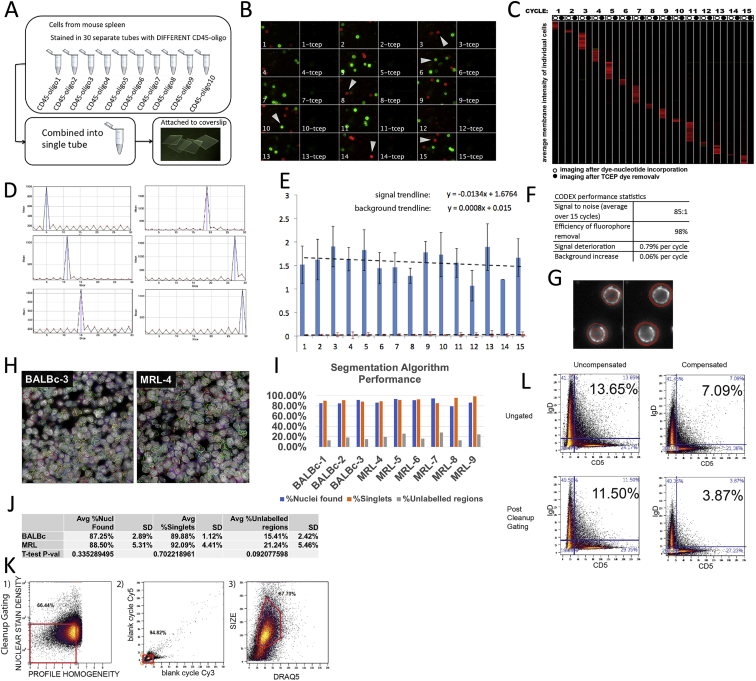
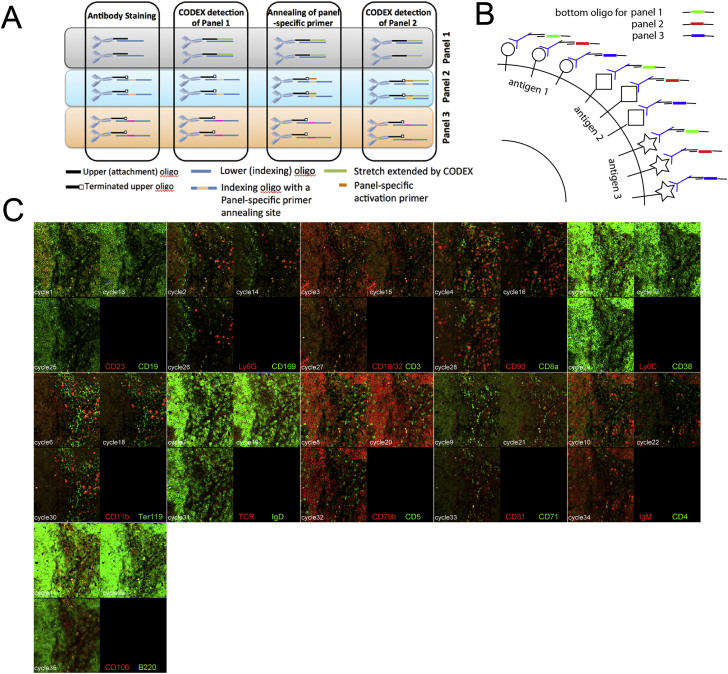
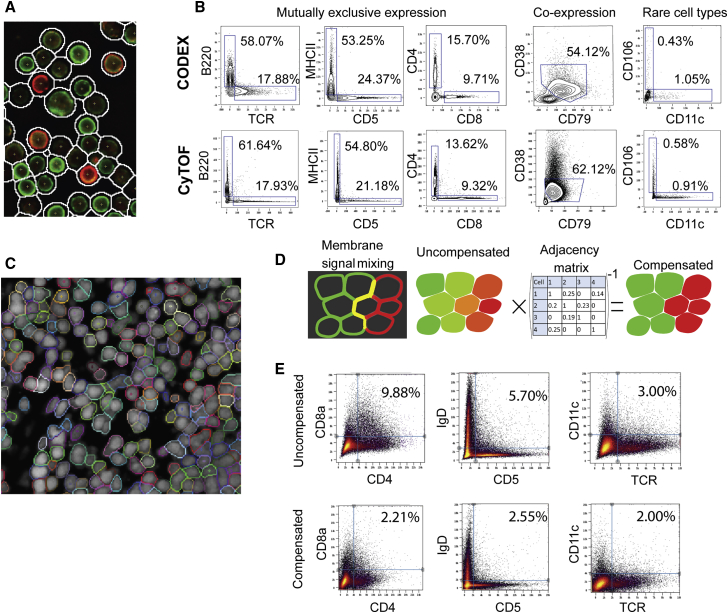
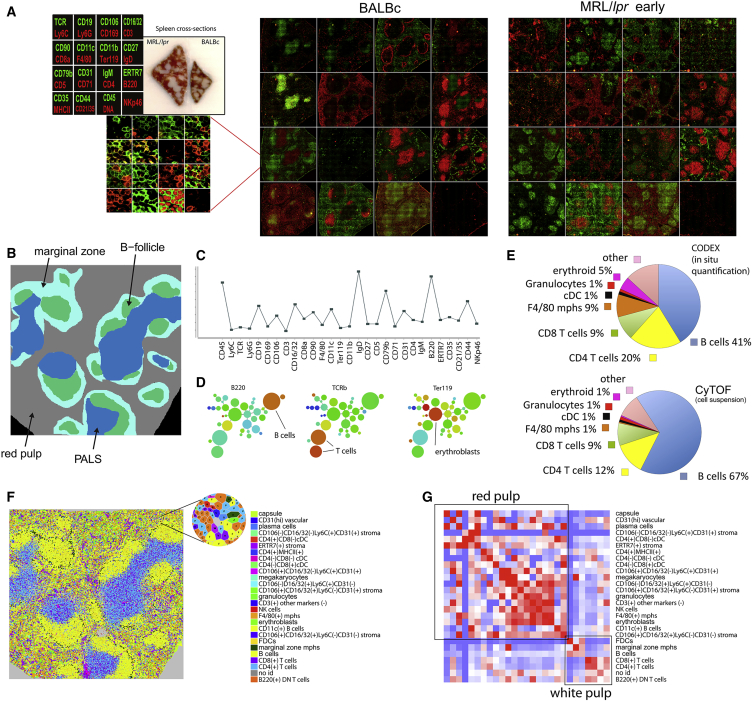
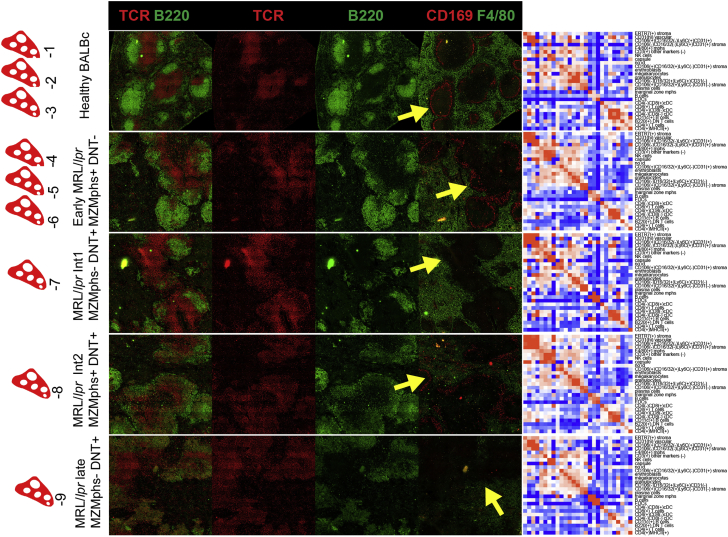
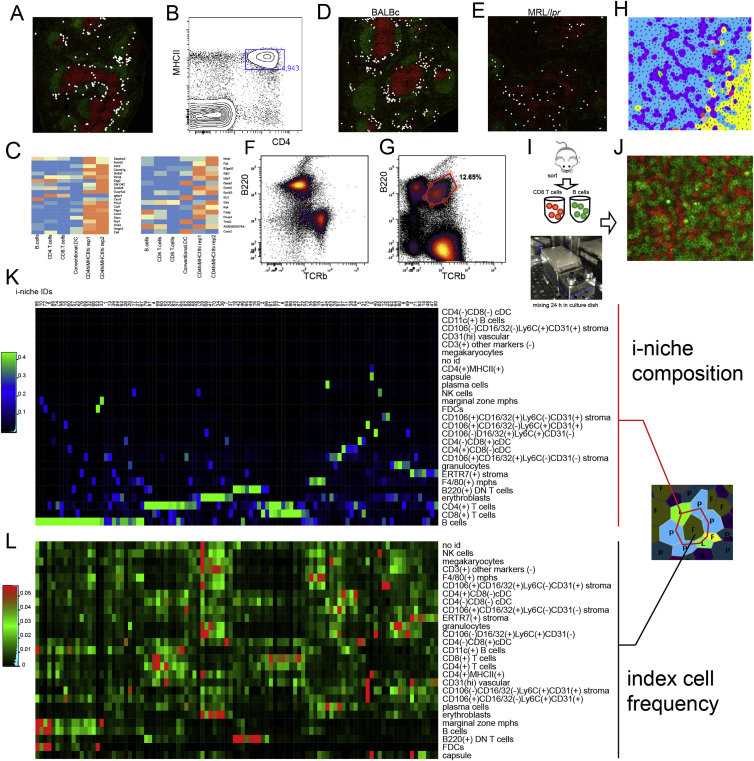
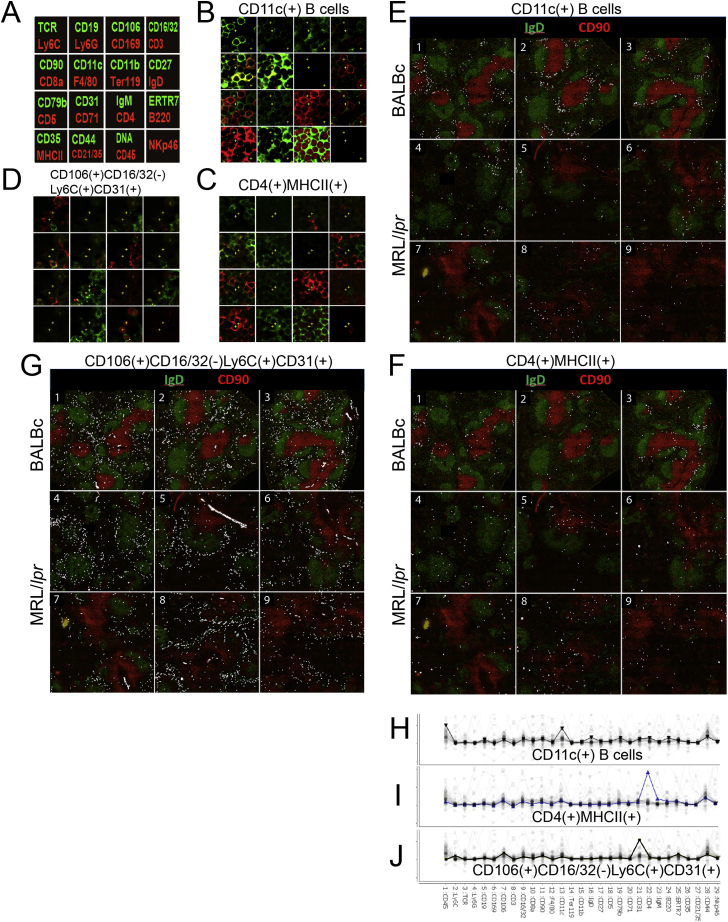
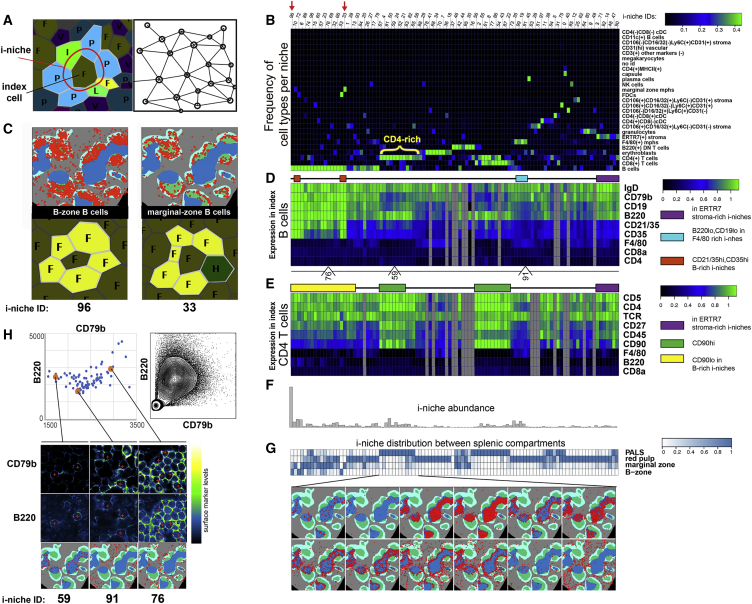
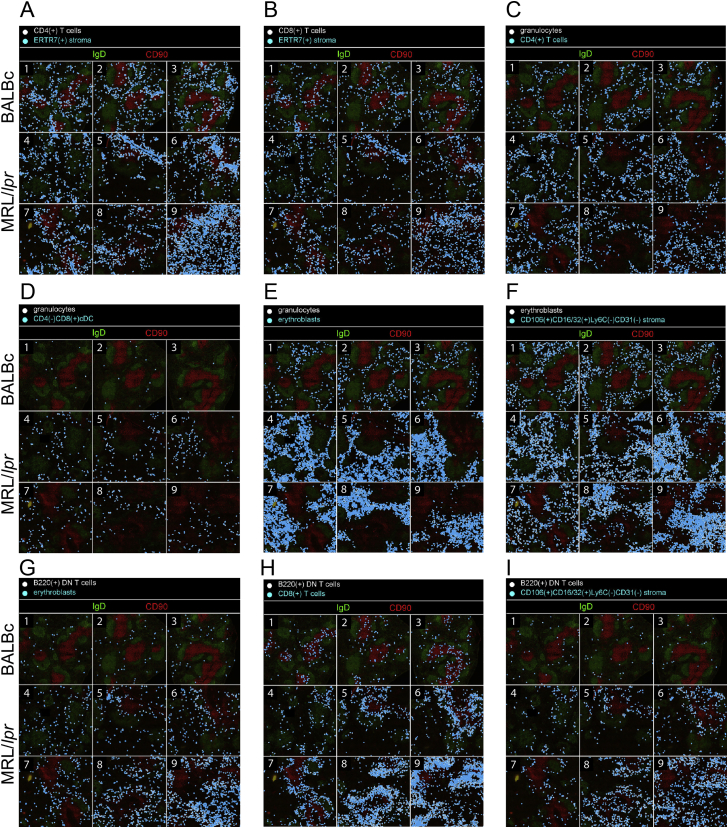
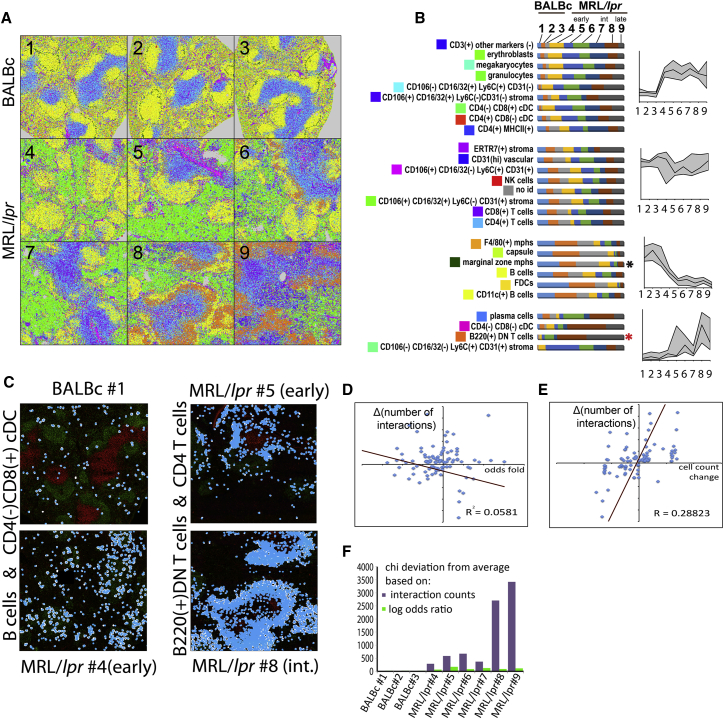
A highly multiplexed cytometric imaging approach, termed co-detection by indexing (CODEX), is used here to create multiplexed datasets of normal and lupus (MRL/lpr) murine spleens. CODEX iteratively visualizes antibody binding events using DNA barcodes, fluorescent dNTP analogs, and an in situ polymerization-based indexing procedure. An algorithmic pipeline for single-cell antigen quantification in tightly packed tissues was developed and used to overlay well-known morphological features with de novo characterization of lymphoid tissue architecture at a single-cell and cellular neighborhood levels. We observed an unexpected, profound impact of the cellular neighborhood on the expression of protein receptors on immune cells. By comparing normal murine spleen to spleens from animals with systemic autoimmune disease (MRL/lpr), extensive and previously uncharacterized splenic cell-interaction dynamics in the healthy versus diseased state was observed. The fidelity of multiplexed spatial cytometry demonstrated here allows for quantitative systemic characterization of tissue architecture in normal and clinically aberrant samples.
Overview
The claims and statistics of this paper haven’t been checked yet.
Run the check — free, no account needed. It reads the open-access text and checks the sources it cites.
Integrity signals
Registry
Cites
Statistics
Figures
Verification
Claims the paper makes
The claims and statistics of this paper haven’t been checked yet.
Run the check — free, no account needed. It reads the open-access text and checks the sources it cites.
Claims other papers make about this one
Each is checked against this paper’s own text: does it say what the citing paper says it does?
In the citing paper
“For example, multiplexed antibody-based imaging (mABI) technologies such as imaging mass cytometry (IMC) [31] and codetection by indexing (CODEX) [32] can detect 20–50 selected genes simultaneously in each cell at the protein level, which is a useful complement to transcript-based detection – especially given the potential for poor correlation of transcriptomic and proteomic data sets implicated”
From The heterogeneity of cellular senescence: insights at the single-cell level (2023) · cites this paper as [32]
Self-check
Percentages, sums and reported differences re-computed from the paper’s own numbers.
The self-check needs the paper’s full text.
Citations
Cites
Globally optimal stitching of tiled 3D microscopic image acquisitions
Preibisch, S., Saalfeld, S., & Tomancak, P. (2009) · Bioinformatics · doi:10.1093/bioinformatics/btp184 · Cited by 2,452
Bendall, S. C., Simonds, E. F., Qiu, P., Amir, E.-A. D., Krutzik, P. O., Finck, R., Bruggner, R. V., Melamed, R., Trejo, A., Ornatsky, O. I., et al. (2011) · Science · doi:10.1126/science.1198704 · Cited by 2,279
Self-citationSystemic Immunity Is Required for Effective Cancer Immunotherapy
Spitzer, M. H., Carmi, Y., Reticker-Flynn, N. E., Kwek, S. S., Madhireddy, D., Martins, M. M., Gherardini, P. F., Prestwood, T. R., Chabon, J., Bendall, S. C., et al. (2017) · Cell · doi:10.1016/j.cell.2016.12.022 · Cited by 963
A New Statistical Approach to Geographic Variation Analysis
Gabriel, K. R., & Sokal, R. R. (1969) · Systematic Zoology · doi:10.2307/2412323 · Cited by 854 · cited 1×
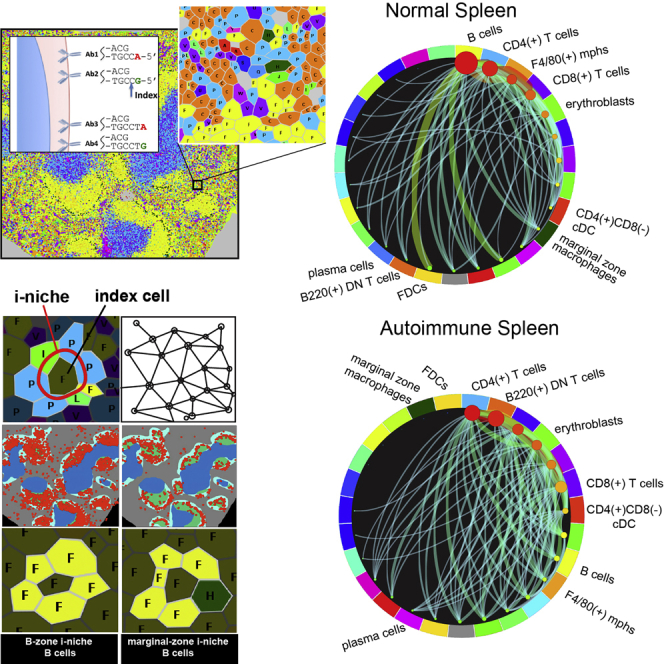
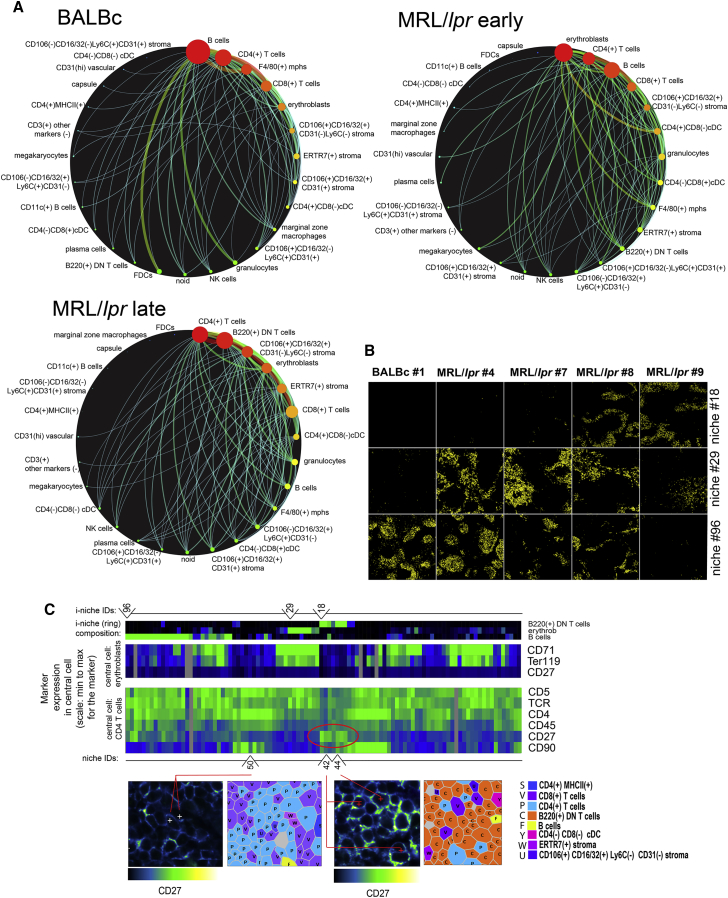
“Pairwise and Combinatorial (i-niches) Statistics of Cellto-Cell Contacts in Mouse Spleen To provide a high-level view of the cell-type interaction landscape, the total counts of contacts between every pair of cell types in the Delaunay neighborhood graph (Gabriel and Sokal, 1969) (Figure 4A and associated Mendeley dat…”
Rubtsov, A. V., Rubtsova, K., Fischer, A., Meehan, R. T., Gillis, J. Z., Kappler, J. W., & Marrack, P. (2011) · Blood · doi:10.1182/blood-2011-01-331462 · Cited by 808
Highly multiplexed single-cell analysis of formalin-fixed, paraffin-embedded cancer tissue
Gerdes, M. J., Sevinsky, C. J., Sood, A., Adak, S., Bello, M. O., Bordwell, A., Can, A. B., Corwin, A. D., Dinn, S. R., Filkins, R. J., et al. (2013) · Proceedings of the National Academy of Sciences · doi:10.1073/pnas.1300136110 · Cited by 716
Robinette, M. L., Fuchs, A. G., Cortez, V. S., Lee, J. S., Wang, Y., Durum, S. K., Gilfillan, S., & Colonna, M. (2015) · Nature Immunology · doi:10.1038/ni.3094 · Cited by 662
Erythroblastic islands: niches for erythropoiesis
Chasis, J. A., & Mohandas, N. (2008) · Blood · doi:10.1182/blood-2008-03-077883 · Cited by 506
Analyzing proteome topology and function by automated multidimensional fluorescence microscopy
SCHUBERT, W. J., Bonnekoh, B., Pommer, A. J., Philipsen, L., Böckelmann, R., Malykh, Y. N., Gollnick, H. P. M., Friedenberger, M., Bode, M., & Dress, A. (2006) · Nature Biotechnology · doi:10.1038/nbt1250 · Cited by 476 · cited 1×
“Approaches have been developed to overcome such limitations (Schubert et al., 2006; Gerdes et al., 2013), but these protocols have required multiple stain/ strip/wash cycles of the antibodies that can be time consuming or lead to sample degradation over the iterations.”
Gerner, M. Y., Kastenmüller, W., Ifrim, I., Kabát, J., & Germain, R. N. (2012) · Immunity · doi:10.1016/j.immuni.2012.07.011 · Cited by 446
Cited by
Sorted by citations
Items 1,001–1,002 of 1,002
From cells to niches: Rewiring cardiovascular disease through spatial immunity
Xie, C., Shu, X., Wu, Y., & Tian, Y. (2026) · International Immunopharmacology · doi:10.1016/j.intimp.2026.116731 · Cited by 3
Bolognesi, M. M., Dall’Olio, L., Mandelli, G. E., Lorenzi, L., Bosisio, F. M., Haberman, A. M., Bhagat, G., Borghesi, S., Faretta, M., Castellani, G., et al. (2026) · PLOS One · doi:10.1371/journal.pone.0346693 · Cited by 2
Metadata
- Authors
- Goltsev, Y., Samusik, N., Kennedy-Darling, J., Bhate, S., Hale, M., Vazquez, G., Black, S., & Nolan, G. P.
- Affiliations
- Stanford Medicine (US)
- Corresponding author
- Nolan, Garry P.
- Venue
- Cell
- Publisher
- Elsevier BV
- Published
- 2018-08
- Volume
- 174
- Issue
- 4
- Pages
- 968-981.e15
- ISSN
- 0092-8674 (ISSN-L)
- PMC
- PMC6086938
- OpenAlex
- W2949238013
- Cited by
- 1,501
- References
- 20
- Citations by year
- 2026: 231 · 2025: 244 · 2024: 232 · 2023: 198 · 2022: 194 · 2021: 194 · 2020: 125 · 2019: 72 · 2018: 9
- FWCI
- 35.39
- Type
- journal article
- Language
- en
- Open access
- hybrid
- doi.org
- Licence
- Locations
- Cell (publishedVersion, cc-by)
- bioRxiv (Cold Spring Harbor Laboratory) (acceptedVersion)
- Europe PMC (PubMed Central) (publishedVersion, cc-by)
- PubMed Central (publishedVersion, cc-by)
- PubMed (publishedVersion)
- Funders
- US NIH (U19AI057229, 1U19AI100627, R01CA184968, 1R33CA183654-01, R33CA183692, 1R01GM10983601, 1R21CA183660, 1R01NS08953301, 5UH2AR067676, 1R01CA19665701, R01HL120724, R01HL128173)
- Bill and Melinda Gates foundation (OPP1113682)
- Department of Defense (W81XWH-14-1-0180)
- Northrop-Grumman Corporation (7500108142)
- NIH (U54-CA209971)
- Rachford & Carlotta A. Harris Endowed Chair
- Topics
- Life Sciences › Biochemistry, Genetics and Molecular Biology › Molecular Biology › Single-cell and spatial transcriptomics
- Life Sciences › Biochemistry, Genetics and Molecular Biology › Biophysics › Cell Image Analysis Techniques
- Life Sciences › Biochemistry, Genetics and Molecular Biology › Biophysics › Advanced Fluorescence Microscopy Techniques
- Keywords
- codices, splenic architecture, MRL/lpr mice, systemic lupus erythematosus, cell-cell interactions, autoimmune disease
- MeSH terms
- Animals, Antibodies, Disease Models, Animal, Female, Image Processing, Computer-Assisted, Lupus Erythematosus, Systemic, Male, Mass Spectrometry, Spleen, Oligonucleotide Probes, Mice, Inbred MRL lpr, Mice
About these checks
Registry, retraction, Cites and statistics results are computed, not judged, with one exception: a printed reference that no index lists is read once by a model before it counts as a citation error. Claims are extracted by a model and kept only when their quote appears verbatim in the text; each cited source is then checked, with a model’s help, for whether it says what the claim relies on. Those verdicts can be wrong — read the claim’s quote and the cited source before relying on one.
Statistics and arithmetic are recomputed, not judged.
Confidence bands are shown only for fields calibrated on our annotated test set. None is calibrated yet, so no band is shown.
What counts as a claim ›How we measure confidence ›How we check this ›
Are you an author, or do you see a problem with this page? Request a review
