

The DOI matches its Crossref record; 56 of the 60 references it cites were found in a registry or an index, and 2 are not checked yet; 1 of the 10 sources its claims cite were checked for support.
Reduced neutralization of SARS-CoV-2 B.1.1.7 variant by convalescent and vaccine sera
Open accessAbstract
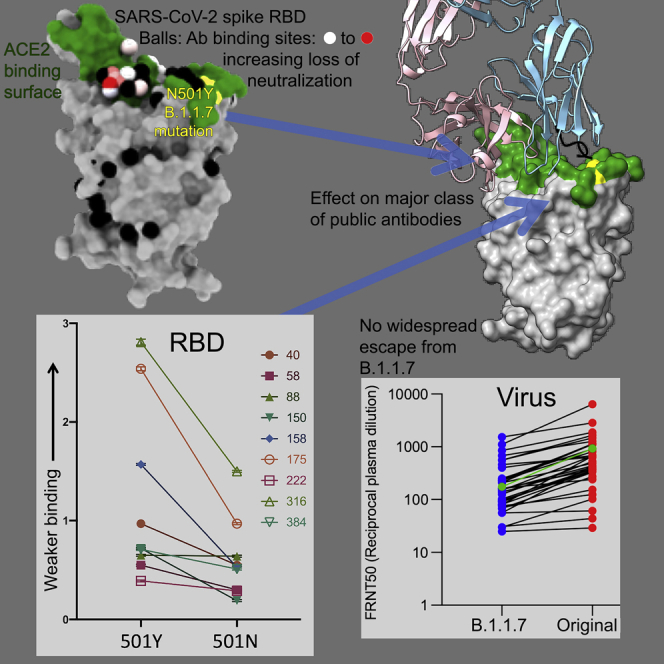
SARS-CoV-2 has caused over 2 million deaths in little over a year. Vaccines are being deployed at scale, aiming to generate responses against the virus spike. The scale of the pandemic and error-prone virus replication is leading to the appearance of mutant viruses and potentially escape from antibody responses. Variant B.1.1.7, now dominant in the UK, with increased transmission, harbors 9 amino acid changes in the spike, including N501Y in the ACE2 interacting surface. We examine the ability of B.1.1.7 to evade antibody responses elicited by natural SARS-CoV-2 infection or vaccination. We map the impact of N501Y by structure/function analysis of a large panel of well-characterized monoclonal antibodies. B.1.1.7 is harder to neutralize than parental virus, compromising neutralization by some members of a major class of public antibodies through light-chain contacts with residue 501. However, widespread escape from monoclonal antibodies or antibody responses generated by natural infection or vaccination was not observed.
Verified 2026-10-06 · 2 references not checked yet
Overview
AI snapshot
Written from the paper’s full text.
TL;DR
The SARS-CoV-2 B.1.1.7 variant is harder to neutralize than the early Victoria strain by convalescent and vaccine sera, with reduced potency partly attributable to the N501Y spike mutation. However, the paper finds no widespread escape from monoclonal antibodies or from natural infection- or vaccine-induced antibody responses.
Key findings
- B.1.1.7 required higher serum concentrations for neutralization: convalescent plasma FRNT50 titers were 2.9-fold lower against B.1.1.7 than Victoria (geometric mean, n = 34, p < 0.0001); AstraZeneca AZD1222 vaccine sera showed 2.5-fold (n = 15, p < 0.0001) and 2.1-fold (n = 10, p < 0.002) reductions at 14 and 28 days after the second dose; Pfizer-BioNTech BNT162b2 sera showed a 3.3-fold reduction (n = 25, p < 0.0001).
- N501Y increased RBD binding affinity for ACE2 approximately 7-fold by biolayer interferometry: WT RBD(501N)-ACE2 KD 75.1 nM versus RBD(501Y)-ACE2 KD 10.7 nM, due to a slower off rate.
- Some public IGHV3-53 antibodies were affected: mAbs 150, 158, and 175 showed roughly 3-fold reduced affinity, mAb 269 was hypersensitive with a 30-fold affinity effect and almost complete loss of neutralization, and mAb 278 failed to reach 100% neutralization with a maximum of 78%. Regeneron and AstraZeneca antibodies showed only modest or no reduction.
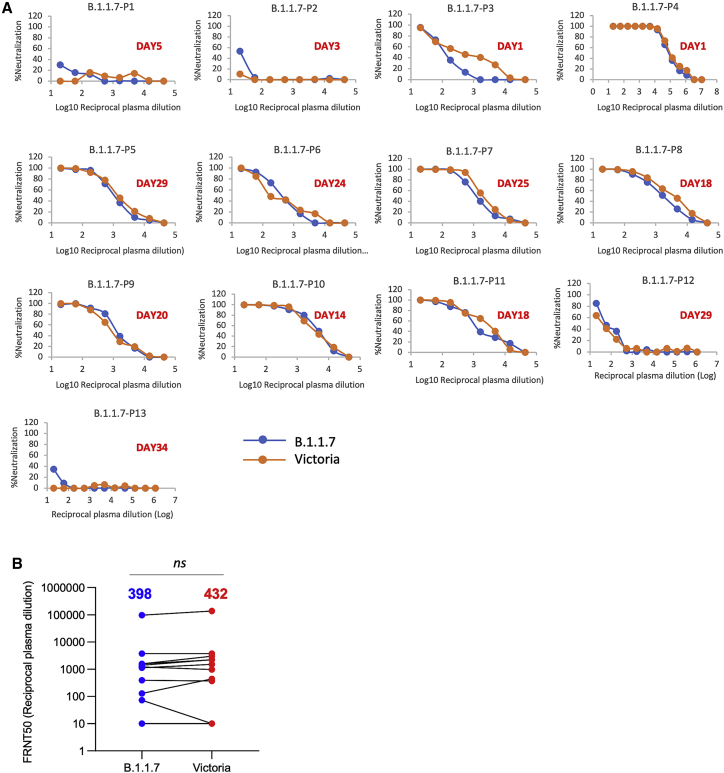
- Plasma from 13 patients infected with B.1.1.7 showed no significant difference in neutralization titers between B.1.1.7 and Victoria strains.
Methods
- The study analyzed 377 spike-targeting mAbs from first-wave SARS-CoV-2 cases, focusing on 20 potent neutralizing antibodies (19 anti-RBD, 1 anti-NTD), using BLI binding assays, crystallography of Fab 269 with WT and N501Y RBD, and focus reduction neutralization tests (FRNT) against Victoria and B.1.1.7.
- Neutralization was tested with 34 convalescent plasma samples, AstraZeneca AZD1222 vaccine sera at 14 days (n = 15) and 28 days (n = 10) after the second dose, Pfizer-BioNTech BNT162b2 vaccine sera (n = 25) 7–17 days after the second dose, and plasma from 13 B.1.1.7-infected patients.
- COG-UK sequence analysis examined 180,000 sequences; statistical comparisons used the Wilcoxon matched-pairs signed-rank test with two-tailed p values and geometric means.
Limitations
- Stated: correlates of protection from SARS-CoV-2 are not established; in vitro neutralization assays do not capture contributions from T cells, Fcγ receptor interactions, or complement activation; convalescent plasma and vaccine serum were taken relatively soon after infection or vaccination, so titers may drop over time.
- Stated: further work is needed to understand antibody responses to B.1.1.7, including adaptation to N501Y and NTD deletions, and to test neutralization of other variants such as B.1.351 and P.1.
- Evident from the text: some groups were small (e.g., n = 10, n = 13, n = 15, n = 25), and the study reports in vitro neutralization only, without in vivo protection or durability data.
Model-written summary. Check it against the paper before relying on it.
Integrity signals
Registry
Cites
Statistics
Figures
Verification
Claims the paper makes
27 Own result · 17 Own interpretation · 13 Own method · 8 Not checked yet · 1 Partly supported · 1 No basis given · accuracy not yet measured
A result the paper reports from its own data — it cites no other source for it, so there is none to check. The quote shows it is in the paper.
In the paper
“As expected, there is little effect on many potent antibodies, for instance, the IGVH1-58 antibodies: 55, 165, 253, and 318.”
§ Reduced neutralization of SARS-CoV-2 B.1.1.7 variant by convalescent and vaccine sera > Results > Effect on mAb affinity
plain- Asserted: passes — The authors put it forward as true.
- Checkable: passes — It can be checked against evidence.
- Load-bearing: unclear — It is unclear whether the paper’s conclusions depend on it.
- Based: passes — The paper gives a reason why it holds.
A result the paper reports from its own data — it cites no other source for it, so there is none to check. The quote shows it is in the paper.
In the paper
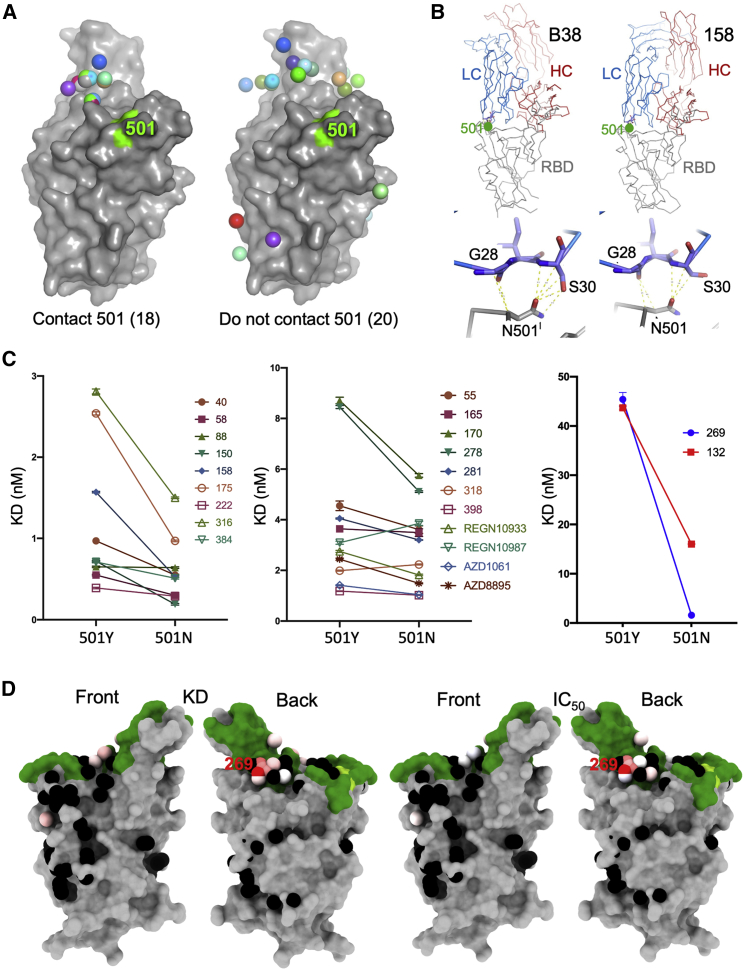
“the common IGLV1-9 antibodies (mAbs 150 and 158) show a consistent reduction in affinity of roughly 3-fold (Figure 3A).”
§ Reduced neutralization of SARS-CoV-2 B.1.1.7 variant by convalescent and vaccine sera > Results > Effect on mAb affinity
plaindirect- Asserted: passes — The authors put it forward as true.
- Checkable: passes — It can be checked against evidence.
- Load-bearing: unclear — It is unclear whether the paper’s conclusions depend on it.
- Based: passes — The paper gives a reason why it holds.
A result the paper reports from its own data — it cites no other source for it, so there is none to check. The quote shows it is in the paper.
In the paper
“In contrast, mAb 222, which pairs IGHV3-53 with IGLV3-20, shows no reduction.”
§ Reduced neutralization of SARS-CoV-2 B.1.1.7 variant by convalescent and vaccine sera > Results > Effect on mAb affinity
plain- Asserted: passes — The authors put it forward as true.
- Checkable: passes — It can be checked against evidence.
- Load-bearing: unclear — It is unclear whether the paper’s conclusions depend on it.
- Based: passes — The paper gives a reason why it holds.
A result the paper reports from its own data — it cites no other source for it, so there is none to check. The quote shows it is in the paper.
In the paper
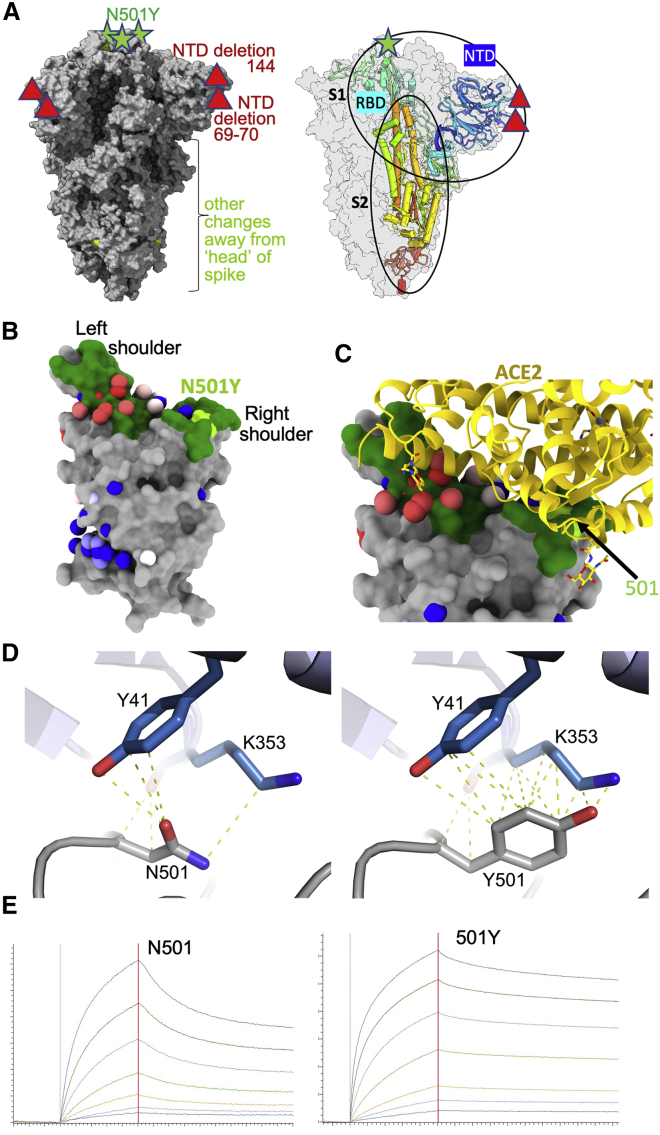
“Potent mAbs mapped to positions either overlapping or closely adjacent to the ACE2 binding surface at the apex of the RBD (Figures 1B and 1C) and tended to have rather few somatic mutations (on average 5.33 and 4.33 amino acids in the heavy and light chains [HC, LC], respectively).”
§ Reduced neutralization of SARS-CoV-2 B.1.1.7 variant by convalescent and vaccine sera > Results > Effect on mAb affinity
plaincorrelational- Asserted: passes — The authors put it forward as true.
- Checkable: passes — It can be checked against evidence.
- Load-bearing: unclear — It is unclear whether the paper’s conclusions depend on it.
- Based: passes — The paper gives a reason why it holds.
A result the paper reports from its own data — it cites no other source for it, so there is none to check. The quote shows it is in the paper.
In the paper
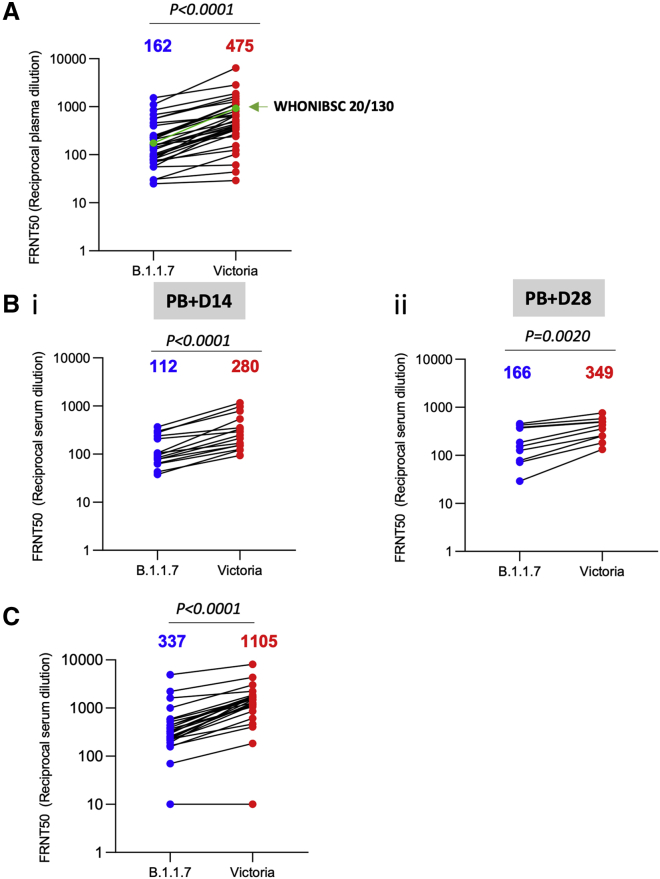
“For the Pfizer-BioNTech vaccine BNT162b2, the reduction was 3.3-fold (geometric mean, n = 25 p < 0.0001) (Figure 5C).”
§ Reduced neutralization of SARS-CoV-2 B.1.1.7 variant by convalescent and vaccine sera > Results > Neutralization activity of convalescent plasma and vaccine sera
plaindirectn = 25 ·- Asserted: passes — The authors put it forward as true.
- Checkable: passes — It can be checked against evidence.
- Load-bearing: passes — The paper’s conclusions depend on it.
- Based: passes — The paper gives a reason why it holds.
A result the paper reports from its own data — it cites no other source for it, so there is none to check. The quote shows it is in the paper.
In the paper
“Mass spectrometry and biolayer interferometry data confirmed the presence of tyrosine at 501.”
§ Reduced neutralization of SARS-CoV-2 B.1.1.7 variant by convalescent and vaccine sera > STAR★Methods > Method details
boosteddirect- Asserted: passes — The authors put it forward as true.
- Checkable: passes — It can be checked against evidence.
- Load-bearing: unclear — It is unclear whether the paper’s conclusions depend on it.
- Based: passes — The paper gives a reason why it holds.
A result the paper reports from its own data — it cites no other source for it, so there is none to check. The quote shows it is in the paper.
In the paper
“There is a marked ∼3-fold effect for mAb 40 (IGHV3-66) and for most of the important IGHV3-53 antibodies (150, 158, and 175).”
§ Reduced neutralization of SARS-CoV-2 B.1.1.7 variant by convalescent and vaccine sera > Results > Effect on mAb affinity
plaindirect- Asserted: passes — The authors put it forward as true.
- Checkable: passes — It can be checked against evidence.
- Load-bearing: passes — The paper’s conclusions depend on it.
- Based: passes — The paper gives a reason why it holds.
A result the paper reports from its own data — it cites no other source for it, so there is none to check. The quote shows it is in the paper.
In the paper
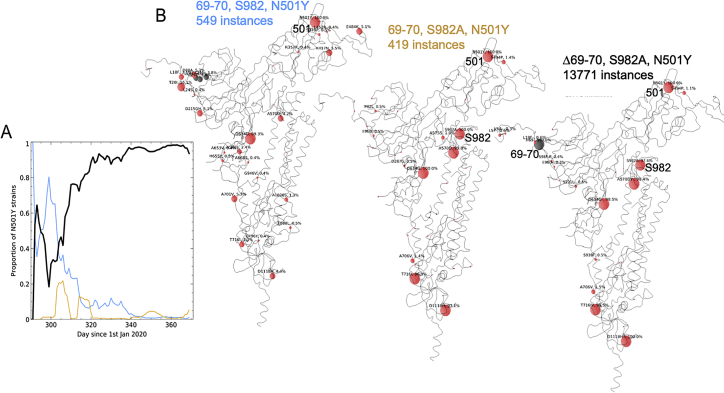
“A mixture of all three subgroups at the outset in late October resolved into the dominance of the B.1.1.7 variant over the course of about 2 months (Figure S1A)”
§ Reduced neutralization of SARS-CoV-2 B.1.1.7 variant by convalescent and vaccine sera > Results > The B.1.1.7 lineage
plaincorrelational- Asserted: passes — The authors put it forward as true.
- Checkable: passes — It can be checked against evidence.
- Load-bearing: unclear — It is unclear whether the paper’s conclusions depend on it.
- Based: passes — The paper gives a reason why it holds.
A result the paper reports from its own data — it cites no other source for it, so there is none to check. The quote shows it is in the paper.
In the paper
“Only a modest effect was observed with these antibodies (Figure 2C).”
§ Reduced neutralization of SARS-CoV-2 B.1.1.7 variant by convalescent and vaccine sera > Results > Effect on mAb affinity
plain- Asserted: passes — The authors put it forward as true.
- Checkable: passes — It can be checked against evidence.
- Load-bearing: unclear — It is unclear whether the paper’s conclusions depend on it.
- Based: passes — The paper gives a reason why it holds.
A result the paper reports from its own data — it cites no other source for it, so there is none to check. The quote shows it is in the paper.
In the paper
“Analysis of 180,000 sequences from the COG-UK database (https://www.cogconsortium.uk) showed one major and two minor subgroups (Figure S1A) of the ∼13,700 identifiable variants harboring N501Y distinguishable by cluster analysis (STAR Methods).”
§ Reduced neutralization of SARS-CoV-2 B.1.1.7 variant by convalescent and vaccine sera > Results > The B.1.1.7 lineage
plain- Asserted: passes — The authors put it forward as true.
- Checkable: passes — It can be checked against evidence.
- Load-bearing: unclear — It is unclear whether the paper’s conclusions depend on it.
- Based: passes — The paper gives a reason why it holds.
A result the paper reports from its own data — it cites no other source for it, so there is none to check. The quote shows it is in the paper.
In the paper
“mAb 269, which is also a VH3-53 mAb, paired with the IGLV1-9 light chain, however, appears hyper-sensitive to the mutation (30-fold effect).”
§ Reduced neutralization of SARS-CoV-2 B.1.1.7 variant by convalescent and vaccine sera > Results > Effect on mAb affinity
hedgeddirect- Asserted: passes — The authors put it forward as true.
- Checkable: passes — It can be checked against evidence.
- Load-bearing: unclear — It is unclear whether the paper’s conclusions depend on it.
- Based: passes — The paper gives a reason why it holds.
A result the paper reports from its own data — it cites no other source for it, so there is none to check. The quote shows it is in the paper.
In the paper
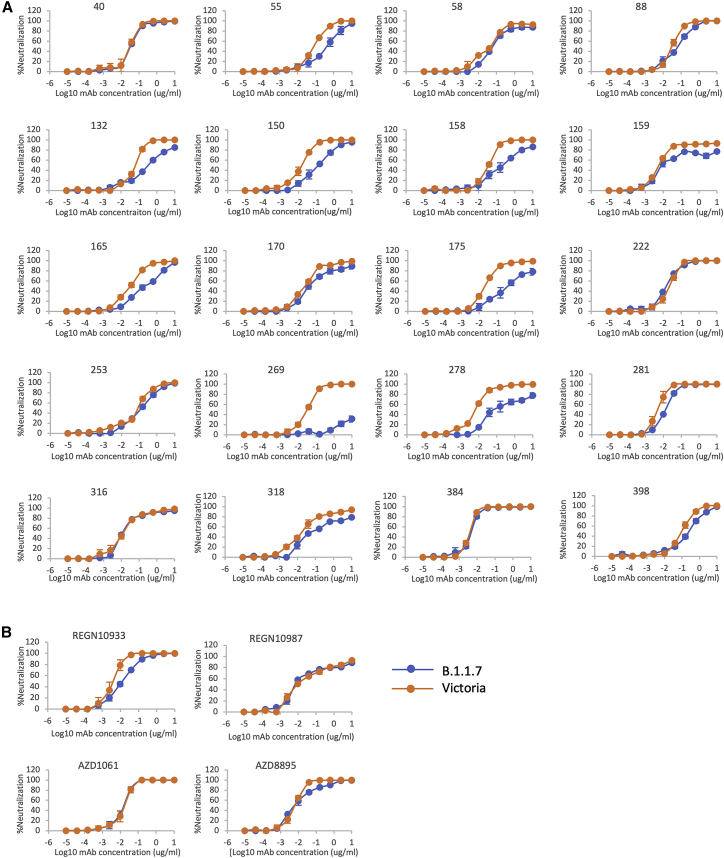
“The neutralization of the AZ antibodies AZD1061 and AZD8895 was similarly little affected.”
§ Reduced neutralization of SARS-CoV-2 B.1.1.7 variant by convalescent and vaccine sera > Results > Effect of B.1.1.7 mutations on neutralization by potent mAbs
plain- Asserted: passes — The authors put it forward as true.
- Checkable: passes — It can be checked against evidence.
- Load-bearing: unclear — It is unclear whether the paper’s conclusions depend on it.
- Based: passes — The paper gives a reason why it holds.
A result the paper reports from its own data — it cites no other source for it, so there is none to check. The quote shows it is in the paper.
In the paper
“We analyzed 34 convalescent samples including the WHONIBSC 20/130 reference serum, and, although a few sera showed near identical FRNT 50 values, the FRNT50 dilutions for the B.1.1.7 strain were 2.9-fold lower (geometric mean) than those for the Victoria strain (p < 0.0001).”
§ Reduced neutralization of SARS-CoV-2 B.1.1.7 variant by convalescent and vaccine sera > Results > Neutralization activity of convalescent plasma and vaccine sera
plaincorrelationaln = 34 ·- Asserted: passes — The authors put it forward as true.
- Checkable: passes — It can be checked against evidence.
- Load-bearing: passes — The paper’s conclusions depend on it.
- Based: passes — The paper gives a reason why it holds.
A result the paper reports from its own data — it cites no other source for it, so there is none to check. The quote shows it is in the paper.
In the paper
“Neutralization assays against B.1.1.7 and Victoria strains showed a 2.5-fold (geometric mean n = 15, p < 0.0001) and 2.1-fold (geometric mean, n = 10, p < 0.002) reduction in the neutralization titers between B.1.1.7 and Victoria strains for the AstraZeneca vaccine after 14 and 28 days following the second dose, respectively (Figure 5B).”
§ Reduced neutralization of SARS-CoV-2 B.1.1.7 variant by convalescent and vaccine sera > Results > Neutralization activity of convalescent plasma and vaccine sera
plaindirectn = 15 ·- Asserted: passes — The authors put it forward as true.
- Checkable: passes — It can be checked against evidence.
- Load-bearing: passes — The paper’s conclusions depend on it.
- Based: passes — The paper gives a reason why it holds.
A result the paper reports from its own data — it cites no other source for it, so there is none to check. The quote shows it is in the paper.
In the paper
“The structure of Fab 269 in complex with WT RBD determined at 1.8 Å resolution (STAR Methods; Table S1; Figure 3C) shows similar interactions to those observed for mAbs 150 and 158.”
§ Reduced neutralization of SARS-CoV-2 B.1.1.7 variant by convalescent and vaccine sera > Results > Effect on mAb affinity
plain- Asserted: passes — The authors put it forward as true.
- Checkable: passes — It can be checked against evidence.
- Load-bearing: unclear — It is unclear whether the paper’s conclusions depend on it.
- Based: passes — The paper gives a reason why it holds.
A result the paper reports from its own data — it cites no other source for it, so there is none to check. The quote shows it is in the paper.
In the paper
“For these samples as a whole, there was no significant difference between the neutralization titers for the two viruses (Figure 6B)”
§ Reduced neutralization of SARS-CoV-2 B.1.1.7 variant by convalescent and vaccine sera > Results > Neutralization activity of convalescent plasma and vaccine sera
plainn = 13- Asserted: passes — The authors put it forward as true.
- Checkable: passes — It can be checked against evidence.
- Load-bearing: passes — The paper’s conclusions depend on it.
- Based: passes — The paper gives a reason why it holds.
A result the paper reports from its own data — it cites no other source for it, so there is none to check. The quote shows it is in the paper.
In the paper
“For some antibodies (40, 88, 222, 316, 384, 398), FRNT 50 values between B.1.1.7 and Victoria strains were minimally affected (<2-fold difference).”
§ Reduced neutralization of SARS-CoV-2 B.1.1.7 variant by convalescent and vaccine sera > Results > Effect of B.1.1.7 mutations on neutralization by potent mAbs
plain- Asserted: passes — The authors put it forward as true.
- Checkable: passes — It can be checked against evidence.
- Load-bearing: unclear — It is unclear whether the paper’s conclusions depend on it.
- Based: passes — The paper gives a reason why it holds.
In the paper
“B.1.1.7 contains a total of 9 changes in the spike protein relative to Wuhan: N501Y, A570D, D614G, P681H, T716I, S982A, D1119H, and deletions of residues 69–70 and 144.”
§ Reduced neutralization of SARS-CoV-2 B.1.1.7 variant by convalescent and vaccine sera > Introduction
What the sources say
- Not checked yetcites Rambaut et al., 2020
plain- Asserted: passes — The authors put it forward as true.
- Checkable: passes — It can be checked against evidence.
- Load-bearing: unclear — It is unclear whether the paper’s conclusions depend on it.
- Based: passes — The paper gives a reason why it holds.
In the paper
“In that study, neutralization titers established that all 20 potent neutralizing antibodies (FRNT50 <0.1 μg/mL for the Victoria virus) bound the RBD, with the single exception of mAb 159, which bound the NTD.”
§ Reduced neutralization of SARS-CoV-2 B.1.1.7 variant by convalescent and vaccine sera > Results > Effect on mAb affinity
What the sources say
- Not checked yetcites Dejnirattisai et al., 2021 source
plain- Asserted: passes — The authors put it forward as true.
- Checkable: passes — It can be checked against evidence.
- Load-bearing: unclear — It is unclear whether the paper’s conclusions depend on it.
- Based: passes — The paper gives a reason why it holds.
A conclusion the paper draws from its own results — it cites no other source for it, so there is none to check. The quote shows it is in the paper.
In the paper
“In summary, we describe here a modest reduction in the neutralization titers against B.1.1.7 by convalescent and vaccine sera generated to early strains of SARS-CoV-2 and give a structural/biophysical description of how this may be driven.”
§ Reduced neutralization of SARS-CoV-2 B.1.1.7 variant by convalescent and vaccine sera > Discussion
plaindirect- Asserted: passes — The authors put it forward as true.
- Checkable: passes — It can be checked against evidence.
- Load-bearing: passes — The paper’s conclusions depend on it.
- Based: passes — The paper gives a reason why it holds.
A conclusion the paper draws from its own results — it cites no other source for it, so there is none to check. The quote shows it is in the paper.
In the paper
“meaning that infection with B.1.1.7 will afford protection from infection with earlier variants.”
§ Reduced neutralization of SARS-CoV-2 B.1.1.7 variant by convalescent and vaccine sera > Results > Neutralization activity of convalescent plasma and vaccine sera
plaindirectn = 13- Asserted: passes — The authors put it forward as true.
- Checkable: passes — It can be checked against evidence.
- Load-bearing: passes — The paper’s conclusions depend on it.
- Based: passes — The paper gives a reason why it holds.
A conclusion the paper draws from its own results — it cites no other source for it, so there is none to check. The quote shows it is in the paper.
In the paper
“In the context of a multivalent interaction at the cell surface, this effect would be amplified.”
§ Reduced neutralization of SARS-CoV-2 B.1.1.7 variant by convalescent and vaccine sera > Results > Effect on ACE2 affinity
hedgeddirect- Asserted: passes — The authors put it forward as true.
- Checkable: passes — It can be checked against evidence.
- Load-bearing: passes — The paper’s conclusions depend on it.
- Based: passes — The paper gives a reason why it holds.
A conclusion the paper draws from its own results — it cites no other source for it, so there is none to check. The quote shows it is in the paper.
In the paper
“suggesting the Δ69-70 mutation may be driving the evolutionary advantage over these two other forms.”
§ Reduced neutralization of SARS-CoV-2 B.1.1.7 variant by convalescent and vaccine sera > Results > The B.1.1.7 lineage
hedgedconditional- Asserted: passes — The authors put it forward as true.
- Checkable: passes — It can be checked against evidence.
- Load-bearing: unclear — It is unclear whether the paper’s conclusions depend on it.
- Based: passes — The paper gives a reason why it holds.
A conclusion the paper draws from its own results — it cites no other source for it, so there is none to check. The quote shows it is in the paper.
In the paper
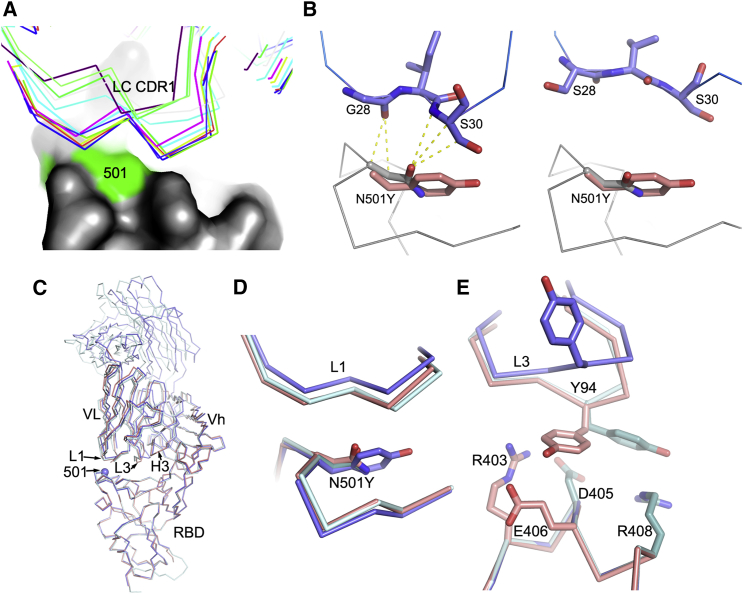
“We would expect the majority of these antibodies to be affected by the mutation, since, for them, unlike ACE2, the interaction with the asparagine is strongly favorable (Figure 2B).”
§ Reduced neutralization of SARS-CoV-2 B.1.1.7 variant by convalescent and vaccine sera > Results > Effect on mAb affinity
hedgedconditional- Asserted: passes — The authors put it forward as true.
- Checkable: passes — It can be checked against evidence.
- Load-bearing: passes — The paper’s conclusions depend on it.
- Based: passes — The paper gives a reason why it holds.
A conclusion the paper draws from its own results — it cites no other source for it, so there is none to check. The quote shows it is in the paper.
In the paper
“Analysis of the position of the N501Y change with respect to the binding of all structurally characterized potent mAbs suggests that the binding of over half of the antibodies would be unaffected by the change (Figure 2A).”
§ Reduced neutralization of SARS-CoV-2 B.1.1.7 variant by convalescent and vaccine sera > Results > Effect on mAb affinity
hedged- Asserted: passes — The authors put it forward as true.
- Checkable: passes — It can be checked against evidence.
- Load-bearing: unclear — It is unclear whether the paper’s conclusions depend on it.
- Based: passes — The paper gives a reason why it holds.
A conclusion the paper draws from its own results — it cites no other source for it, so there is none to check. The quote shows it is in the paper.
In the paper
“This is in-line with enhanced interactions of the tyrosine side chain with the side chains of residues Y41 and K353 of ACE2 (Figure 1D).”
§ Reduced neutralization of SARS-CoV-2 B.1.1.7 variant by convalescent and vaccine sera > Results > Effect on ACE2 affinity
plaincorrelational- Asserted: passes — The authors put it forward as true.
- Checkable: passes — It can be checked against evidence.
- Load-bearing: unclear — It is unclear whether the paper’s conclusions depend on it.
- Based: passes — The paper gives a reason why it holds.
A conclusion the paper draws from its own results — it cites no other source for it, so there is none to check. The quote shows it is in the paper.
In the paper
“Here, we show that this increase in transmission is compounded by the reduction in neutralization potency of antibodies generated by prior infection.”
§ Reduced neutralization of SARS-CoV-2 B.1.1.7 variant by convalescent and vaccine sera > Discussion
boosteddirect- Asserted: passes — The authors put it forward as true.
- Checkable: passes — It can be checked against evidence.
- Load-bearing: passes — The paper’s conclusions depend on it.
- Based: passes — The paper gives a reason why it holds.
A conclusion the paper draws from its own results — it cites no other source for it, so there is none to check. The quote shows it is in the paper.
In the paper
“For these and the IGHV3-66 antibodies, the mode of binding is dictated by the HC CDR1 and CDR2, which orientates the antibody such that the light-chain CDR1 region lies atop residue 501.”
§ Reduced neutralization of SARS-CoV-2 B.1.1.7 variant by convalescent and vaccine sera > Results > Effect on mAb affinity
plaindirect- Asserted: passes — The authors put it forward as true.
- Checkable: passes — It can be checked against evidence.
- Load-bearing: passes — The paper’s conclusions depend on it.
- Based: passes — The paper gives a reason why it holds.
A conclusion the paper draws from its own results — it cites no other source for it, so there is none to check. The quote shows it is in the paper.
In the paper
“However, B.1.1.7 contains additional mutations that may have a bearing on neutralization, in particular, the deletions at 69–70 and 144 in the NTD.”
§ Reduced neutralization of SARS-CoV-2 B.1.1.7 variant by convalescent and vaccine sera > Discussion
hedgedconditional- Asserted: passes — The authors put it forward as true.
- Checkable: passes — It can be checked against evidence.
- Load-bearing: unclear — It is unclear whether the paper’s conclusions depend on it.
- Based: passes — The paper gives a reason why it holds.
- Probably not a substantial claim. 24
- It may state two separate claims as one. 24
The cited sources support only part of this claim — read each source’s verdict below.
In the paper
“indeed partial or non-neutralizing antibodies may confer protection (Henry Dunand et al., 2016).”
§ Reduced neutralization of SARS-CoV-2 B.1.1.7 variant by convalescent and vaccine sera > Discussion
What the sources say
- Partly supportedcites Henry Dunand et al., 2016 sourceExperimental — accuracy not yet measured
The Discussion states that non-neutralizing antibodies may contribute to protection in vivo, and the Results describe protection by a non-neutralizing antibody in mice. The passages do not establish the separate claim about partially neutralizing antibodies. (LLM, conf=0.82)
hedgedconditional- Asserted: passes — The authors put it forward as true.
- Checkable: passes — It can be checked against evidence.
- Load-bearing: fails — The paper’s conclusions may not depend on it.
- Based: passes — The paper gives a reason why it holds.
Probably not a substantial claim. The paper’s conclusions may not depend on it.
- Partly supported
A result the paper reports from its own data — it cites no other source for it, so there is none to check. The quote shows it is in the paper.
In the paper
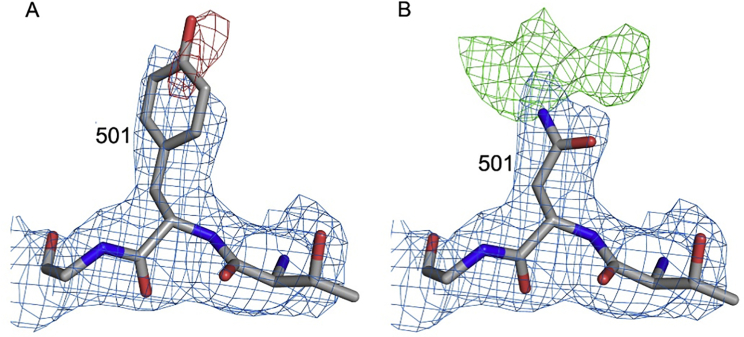
“Electron density for the side chain of Y501 is weak.”
§ Reduced neutralization of SARS-CoV-2 B.1.1.7 variant by convalescent and vaccine sera > STAR★Methods > Method details
plain- Asserted: passes — The authors put it forward as true.
- Checkable: passes — It can be checked against evidence.
- Load-bearing: fails — The paper’s conclusions may not depend on it.
- Based: passes — The paper gives a reason why it holds.
Probably not a substantial claim. The paper’s conclusions may not depend on it.
A result the paper reports from its own data — it cites no other source for it, so there is none to check. The quote shows it is in the paper.
In the paper
“For the Regeneron antibodies, the neutralization of REGN10987 was unaffected by B.1.1.7, while REGN10933 showed a slight reduction but still retained potent activity (Figure 4B; Table S2).”
§ Reduced neutralization of SARS-CoV-2 B.1.1.7 variant by convalescent and vaccine sera > Results > Effect of B.1.1.7 mutations on neutralization by potent mAbs
plain- Asserted: passes — The authors put it forward as true.
- Checkable: passes — It can be checked against evidence.
- Load-bearing: unclear — It is unclear whether the paper’s conclusions depend on it.
- Based: passes — The paper gives a reason why it holds.
It may state two separate claims as one.
A result the paper reports from its own data — it cites no other source for it, so there is none to check. The quote shows it is in the paper.
In the paper
“resulted in the current structures with Rwork/ Rfree = 0.197/ 0.222 and Rwork/ Rfree = 0.185/0.200 for all data to 2.19 Å and 1.77 Å resolution for N501Y RBD/269 Fab and RBD/269 Fab complexes, respectively.”
§ Reduced neutralization of SARS-CoV-2 B.1.1.7 variant by convalescent and vaccine sera > STAR★Methods > Method details
plain- Asserted: passes — The authors put it forward as true.
- Checkable: passes — It can be checked against evidence.
- Load-bearing: fails — The paper’s conclusions may not depend on it.
- Based: passes — The paper gives a reason why it holds.
Probably not a substantial claim. The paper’s conclusions may not depend on it. It may state two separate claims as one.
A result the paper reports from its own data — it cites no other source for it, so there is none to check. The quote shows it is in the paper.
In the paper
“However, for others there was a fall in the neutralization titers for B.1.1.7, particularly pronounced for mAb 269, where neutralization was almost completely lost and mAb 278, which failed to reach 100% neutralization showing a maximum of only 78%.”
§ Reduced neutralization of SARS-CoV-2 B.1.1.7 variant by convalescent and vaccine sera > Results > Effect of B.1.1.7 mutations on neutralization by potent mAbs
plaindirect- Asserted: passes — The authors put it forward as true.
- Checkable: passes — It can be checked against evidence.
- Load-bearing: passes — The paper’s conclusions depend on it.
- Based: passes — The paper gives a reason why it holds.
It may state two separate claims as one.
A result the paper reports from its own data — it cites no other source for it, so there is none to check. The quote shows it is in the paper.
In the paper
“The results indicate a marked (7-fold) increase in binding affinity due to a slower off rate: WT RBD(501N)-ACE2: KD 75.1 nM (Kon 3.88E4 /Ms, Koff 2.92E-3 /s), RBD(501Y)-ACE2: KD 10.7 nM (Kon 6.38E4 /Ms, Koff 6.85E-4/s).”
§ Reduced neutralization of SARS-CoV-2 B.1.1.7 variant by convalescent and vaccine sera > Results > Effect on ACE2 affinity
hedgeddirect- Asserted: passes — The authors put it forward as true.
- Checkable: passes — It can be checked against evidence.
- Load-bearing: passes — The paper’s conclusions depend on it.
- Based: passes — The paper gives a reason why it holds.
It may state two separate claims as one.
A result the paper reports from its own data — it cites no other source for it, so there is none to check. The quote shows it is in the paper.
In the paper
“However, when the structure was refined with an asparagine at 501, there was strong, dispersed positive density around the side chain, consistent with the presence of a flexible tyrosine residue (Figure S2).”
§ Reduced neutralization of SARS-CoV-2 B.1.1.7 variant by convalescent and vaccine sera > STAR★Methods > Method details
boostedcorrelational- Asserted: passes — The authors put it forward as true.
- Checkable: passes — It can be checked against evidence.
- Load-bearing: fails — The paper’s conclusions may not depend on it.
- Based: passes — The paper gives a reason why it holds.
Probably not a substantial claim. The paper’s conclusions may not depend on it.
A result the paper reports from its own data — it cites no other source for it, so there is none to check. The quote shows it is in the paper.
In the paper
“The major strain was the Δ69-70 B.1.1.7 strain, whereas the two minor groups lack this deletion and either had wild-type or the S982A mutation (Figure S1B).”
§ Reduced neutralization of SARS-CoV-2 B.1.1.7 variant by convalescent and vaccine sera > Results > The B.1.1.7 lineage
plain- Asserted: passes — The authors put it forward as true.
- Checkable: passes — It can be checked against evidence.
- Load-bearing: unclear — It is unclear whether the paper’s conclusions depend on it.
- Based: passes — The paper gives a reason why it holds.
It may state two separate claims as one.
A result the paper reports from its own data — it cites no other source for it, so there is none to check. The quote shows it is in the paper.
In the paper
“A number of public antibody responses including IGHV3-53 (5 potent mAbs), IGHV1-58 (4 potent mAbs), and IGHV3-66 (2 potent mAbs) were present in the collection of RBD-specific mAbs”
§ Reduced neutralization of SARS-CoV-2 B.1.1.7 variant by convalescent and vaccine sera > Results > Effect on mAb affinity
plain- Asserted: passes — The authors put it forward as true.
- Checkable: passes — It can be checked against evidence.
- Load-bearing: fails — The paper’s conclusions may not depend on it.
- Based: passes — The paper gives a reason why it holds.
Probably not a substantial claim. The paper’s conclusions may not depend on it. It may state two separate claims as one.
A result the paper reports from its own data — it cites no other source for it, so there is none to check. The quote shows it is in the paper.
In the paper
“The mutation introduces a rather small displacement of the L1 loop (Figure 3D), but there is a concomitant effect of the neighboring L3 loop (Figure 3E), with a significant switch in the position of Y94, abrogating contacts with residues R403 and E406 of the RBD.”
§ Reduced neutralization of SARS-CoV-2 B.1.1.7 variant by convalescent and vaccine sera > Results > Effect on mAb affinity
plaindirect- Asserted: passes — The authors put it forward as true.
- Checkable: passes — It can be checked against evidence.
- Load-bearing: passes — The paper’s conclusions depend on it.
- Based: passes — The paper gives a reason why it holds.
It may state two separate claims as one.
A result the paper reports from its own data — it cites no other source for it, so there is none to check. The quote shows it is in the paper.
In the paper
“During the week of December 24, 2020, the N501Y variant represented 53% of the sequenced isolates in Great Britain.”
§ Reduced neutralization of SARS-CoV-2 B.1.1.7 variant by convalescent and vaccine sera > Results > The B.1.1.7 lineage
plain- Asserted: passes — The authors put it forward as true.
- Checkable: passes — It can be checked against evidence.
- Load-bearing: fails — The paper’s conclusions may not depend on it.
- Based: passes — The paper gives a reason why it holds.
Probably not a substantial claim. The paper’s conclusions may not depend on it.
The paper states this without a source or data behind it here, so there is nothing to check it against. The quote shows it is in the paper.
In the paper
“All of these contain mutations in the ACE2 receptor binding footprint of the receptor binding domain (RBD), one in B.1.1.7, three in 501Y.V2, and three in P.1, with the N501Y mutation being common to all.”
§ Reduced neutralization of SARS-CoV-2 B.1.1.7 variant by convalescent and vaccine sera > Introduction
plain- Asserted: passes — The authors put it forward as true.
- Checkable: passes — It can be checked against evidence.
- Load-bearing: passes — The paper’s conclusions depend on it.
- Based: passes — The paper gives a reason why it holds.
It may state two separate claims as one.
In the paper
“The B.1.1.7 variant is estimated to be 30%–60% more infectious than strains encountered in the first wave (Walker et al., 2021)”
§ Reduced neutralization of SARS-CoV-2 B.1.1.7 variant by convalescent and vaccine sera > Introduction
What the sources say
- Not checked yetcites Walker et al., 2021
hedgeddirect- Asserted: passes — The authors put it forward as true.
- Checkable: passes — It can be checked against evidence.
- Load-bearing: fails — The paper’s conclusions may not depend on it.
- Based: passes — The paper gives a reason why it holds.
Probably not a substantial claim. The paper’s conclusions may not depend on it.
What the paper did — it cites no source for this, so there is none to check. The quote shows it is in the paper.
In the paper
“Both Victoria passage 5 and B.1.1.7 stocks passage 2, were sequence verified to contain the expected spike protein sequence and no changes to the furin cleavage sites.”
§ Reduced neutralization of SARS-CoV-2 B.1.1.7 variant by convalescent and vaccine sera > STAR★Methods > Experimental model and subject details
plain- Asserted: passes — The authors put it forward as true.
- Checkable: passes — It can be checked against evidence.
- Load-bearing: passes — The paper’s conclusions depend on it.
- Based: passes — The paper gives a reason why it holds.
Probably not a substantial claim. It may state two separate claims as one.
What the paper did — it cites no source for this, so there is none to check. The quote shows it is in the paper.
In the paper
“The study was conducted according to the principles of the Declaration of Helsinki (2008) and the International Conference on Harmonization (ICH) Good Clinical Practice (GCP) guidelines.”
§ Reduced neutralization of SARS-CoV-2 B.1.1.7 variant by convalescent and vaccine sera > STAR★Methods > Experimental model and subject details
plain- Asserted: passes — The authors put it forward as true.
- Checkable: passes — It can be checked against evidence.
- Load-bearing: fails — The paper’s conclusions may not depend on it.
- Based: passes — The paper gives a reason why it holds.
Probably not a substantial claim. The paper’s conclusions may not depend on it. It may state two separate claims as one.
A conclusion the paper draws from its own results — it cites no other source for it, so there is none to check. The quote shows it is in the paper.
In the paper
“In conclusion, the neutralization assays on convalescent and vaccine serum revealed that the B.1.1.7 virus required higher concentrations of serum to achieve neutralization, although there was no evidence that the B.1.1.7 virus could evade neutralization by serum raised to early SARS-CoV-2 strains or vaccines.”
§ Reduced neutralization of SARS-CoV-2 B.1.1.7 variant by convalescent and vaccine sera > Results > Neutralization activity of convalescent plasma and vaccine sera
plaindirect- Asserted: passes — The authors put it forward as true.
- Checkable: passes — It can be checked against evidence.
- Load-bearing: passes — The paper’s conclusions depend on it.
- Based: passes — The paper gives a reason why it holds.
It may state two separate claims as one.
A conclusion the paper draws from its own results — it cites no other source for it, so there is none to check. The quote shows it is in the paper.
In the paper
“However, antibodies that neutralize by ACE2 competition, even if not directly affected by the mutation, will have to compete with ACE2 for binding to the RBD, and mutations of RBD that increase the affinity of ACE2 will tip the equilibrium away from mAb/RBD interaction toward RBD/ACE2 making the virus more difficult to neutralize.”
§ Reduced neutralization of SARS-CoV-2 B.1.1.7 variant by convalescent and vaccine sera > Discussion
plaindirect- Asserted: passes — The authors put it forward as true.
- Checkable: passes — It can be checked against evidence.
- Load-bearing: passes — The paper’s conclusions depend on it.
- Based: passes — The paper gives a reason why it holds.
It may state two separate claims as one.
A conclusion the paper draws from its own results — it cites no other source for it, so there is none to check. The quote shows it is in the paper.
In the paper
“The reduced binding and neutralization were particularly marked for some, but not all, members of the public IGHV3-53 class of mAb, since the IGHV3-53-defined CDR1 and CDR2 cause the antibody to orient the light chain in close proximity to Y501.”
§ Reduced neutralization of SARS-CoV-2 B.1.1.7 variant by convalescent and vaccine sera > Discussion
plaindirect- Asserted: passes — The authors put it forward as true.
- Checkable: passes — It can be checked against evidence.
- Load-bearing: passes — The paper’s conclusions depend on it.
- Based: passes — The paper gives a reason why it holds.
It may state two separate claims as one.
In the paper
“A mutation at 484 of the spike likely has a similar dual effect, and Zahradník et al. (2021) report that further affinity increase in ACE2 binding is possible.”
§ Reduced neutralization of SARS-CoV-2 B.1.1.7 variant by convalescent and vaccine sera > Discussion
What the sources say
- Not checked yetcites Zahradník et al., 2021
hedgedconditional- Asserted: passes — The authors put it forward as true.
- Checkable: passes — It can be checked against evidence.
- Load-bearing: unclear — It is unclear whether the paper’s conclusions depend on it.
- Based: passes — The paper gives a reason why it holds.
It may state two separate claims as one.
What the paper did — it cites no source for this, so there is none to check. The quote shows it is in the paper.
In the paper
“This construct encodes exactly the same protein as native RBD except the N501Y mutation, as confirmed by sequencing.”
§ Reduced neutralization of SARS-CoV-2 B.1.1.7 variant by convalescent and vaccine sera > STAR★Methods > Method details
plain- Asserted: passes — The authors put it forward as true.
- Checkable: passes — It can be checked against evidence.
- Load-bearing: passes — The paper’s conclusions depend on it.
- Based: passes — The paper gives a reason why it holds.
Probably not a substantial claim.
A conclusion the paper draws from its own results — it cites no other source for it, so there is none to check. The quote shows it is in the paper.
In the paper
“However, although neutralization titers against B.1.1.7 are reduced, they remain robust, and there is no evidence of vaccine escape, which bodes well for protection against B.1.1.7 by the vaccines currently being deployed at massive scale against SARS-CoV-2.”
§ Reduced neutralization of SARS-CoV-2 B.1.1.7 variant by convalescent and vaccine sera > Discussion
plain- Asserted: passes — The authors put it forward as true.
- Checkable: passes — It can be checked against evidence.
- Load-bearing: passes — The paper’s conclusions depend on it.
- Based: passes — The paper gives a reason why it holds.
It may state two separate claims as one.
In the paper
“As expected, there was a correlation between ACE2 blocking and neutralization titers”
§ Reduced neutralization of SARS-CoV-2 B.1.1.7 variant by convalescent and vaccine sera > Results > Effect on mAb affinity
What the sources say
- Not checked yetcites Dejnirattisai et al., 2021 source
plaincorrelational- Asserted: passes — The authors put it forward as true.
- Checkable: passes — It can be checked against evidence.
- Load-bearing: fails — The paper’s conclusions may not depend on it.
- Based: passes — The paper gives a reason why it holds.
Probably not a substantial claim. The paper’s conclusions may not depend on it.
What the paper did — it cites no source for this, so there is none to check. The quote shows it is in the paper.
In the paper
“An independent DSMB reviewed all interim safety reports.”
§ Reduced neutralization of SARS-CoV-2 B.1.1.7 variant by convalescent and vaccine sera > STAR★Methods > Experimental model and subject details
plain- Asserted: passes — The authors put it forward as true.
- Checkable: passes — It can be checked against evidence.
- Load-bearing: fails — The paper’s conclusions may not depend on it.
- Based: passes — The paper gives a reason why it holds.
Probably not a substantial claim. The paper’s conclusions may not depend on it.
A conclusion the paper draws from its own results — it cites no other source for it, so there is none to check. The quote shows it is in the paper.
In the paper
“Mutation N501Y perhaps gives the greatest concern as it has the potential to increase RBD/ACE2 affinity while also disrupting the binding of potent neutralizing antibodies (Figure 1A).”
§ Reduced neutralization of SARS-CoV-2 B.1.1.7 variant by convalescent and vaccine sera > Introduction
hedgedconditional- Asserted: passes — The authors put it forward as true.
- Checkable: passes — It can be checked against evidence.
- Load-bearing: passes — The paper’s conclusions depend on it.
- Based: fails — The paper may give no reason why it holds.
Probably not a substantial claim. The paper may give no reason why it holds. It may state two separate claims as one.
None of the sources cited for this claim have been checked yet.
In the paper
“In addition, natural exposure and vaccination may confer protective immunity against symptomatic and severe COVID-19 via memory T cell responses (Sariol and Perlman, 2020; Altmann and Boyton, 2020).”
§ Reduced neutralization of SARS-CoV-2 B.1.1.7 variant by convalescent and vaccine sera > Discussion
What the sources say
- Not checked yetcites Sariol and Perlman, 2020
- Not checked yetcites Altmann and Boyton, 2020
hedgedconditional- Asserted: passes — The authors put it forward as true.
- Checkable: passes — It can be checked against evidence.
- Load-bearing: fails — The paper’s conclusions may not depend on it.
- Based: passes — The paper gives a reason why it holds.
Probably not a substantial claim. The paper’s conclusions may not depend on it.
What the paper did — it cites no source for this, so there is none to check. The quote shows it is in the paper.
In the paper
“Written informed consent was obtained for all patients enrolled in the study.”
§ Reduced neutralization of SARS-CoV-2 B.1.1.7 variant by convalescent and vaccine sera > STAR★Methods > Experimental model and subject details
plain- Asserted: passes — The authors put it forward as true.
- Checkable: passes — It can be checked against evidence.
- Load-bearing: fails — The paper’s conclusions may not depend on it.
- Based: passes — The paper gives a reason why it holds.
Probably not a substantial claim. The paper’s conclusions may not depend on it.
A conclusion the paper draws from its own results — it cites no other source for it, so there is none to check. The quote shows it is in the paper.
In the paper
“This alone might account for the selection of the N501Y mutation and an increase in transmission.”
§ Reduced neutralization of SARS-CoV-2 B.1.1.7 variant by convalescent and vaccine sera > Results > Effect on ACE2 affinity
hedgedconditional- Asserted: passes — The authors put it forward as true.
- Checkable: passes — It can be checked against evidence.
- Load-bearing: passes — The paper’s conclusions depend on it.
- Based: passes — The paper gives a reason why it holds.
It may state two separate claims as one.
- The authors state this as an assumption: A further increase in ACE2 affinity will increase the likelihood that stochastic virus attachment events lead to localization for sufficient time to trigger internalization.
What the paper did — it cites no source for this, so there is none to check. The quote shows it is in the paper.
In the paper
“The studies were sponsored by the University of Oxford (Oxford, UK) and approval obtained from a national ethics committee (South Central Berkshire Research Ethics Committee, reference 20/SC/0145 and 20/SC/0179) and a regulatory agency in the United Kingdom (the Medicines and Healthcare Products Regulatory Agency).”
§ Reduced neutralization of SARS-CoV-2 B.1.1.7 variant by convalescent and vaccine sera > STAR★Methods > Experimental model and subject details
plain- Asserted: passes — The authors put it forward as true.
- Checkable: passes — It can be checked against evidence.
- Load-bearing: fails — The paper’s conclusions may not depend on it.
- Based: passes — The paper gives a reason why it holds.
Probably not a substantial claim. The paper’s conclusions may not depend on it. It may state two separate claims as one.
What the paper did — it cites no source for this, so there is none to check. The quote shows it is in the paper.
In the paper
“These studies were registered at ISRCTN (15281137 and 89951424) and ClinicalTrials.gov (NCT04324606 and NCT04400838).”
§ Reduced neutralization of SARS-CoV-2 B.1.1.7 variant by convalescent and vaccine sera > STAR★Methods > Experimental model and subject details
plain- Asserted: passes — The authors put it forward as true.
- Checkable: passes — It can be checked against evidence.
- Load-bearing: fails — The paper’s conclusions may not depend on it.
- Based: passes — The paper gives a reason why it holds.
Probably not a substantial claim. The paper’s conclusions may not depend on it.
A conclusion the paper draws from its own results — it cites no other source for it, so there is none to check. The quote shows it is in the paper.
In the paper
“We have shown here that neutralizing responses against the Victoria virus are less effective against B.1.1.7 and that part of this effect is due to the N501Y mutation as demonstrated by the weaker binding of a number of antibodies to the RBD, where N501Y is the only difference.”
§ Reduced neutralization of SARS-CoV-2 B.1.1.7 variant by convalescent and vaccine sera > Discussion
boosteddirect- Asserted: passes — The authors put it forward as true.
- Checkable: passes — It can be checked against evidence.
- Load-bearing: passes — The paper’s conclusions depend on it.
- Based: passes — The paper gives a reason why it holds.
It may state two separate claims as one.
What the paper did — it cites no source for this, so there is none to check. The quote shows it is in the paper.
In the paper
“Convalescent plasma and vaccine serum were taken relatively soon after acute illness or following vaccination; it is possible that titers will drop over time to a point where they are no longer high enough to provide protection.”
§ Reduced neutralization of SARS-CoV-2 B.1.1.7 variant by convalescent and vaccine sera > Discussion > Limitations of the study
hedgedconditional- Asserted: passes — The authors put it forward as true.
- Checkable: passes — It can be checked against evidence.
- Load-bearing: fails — The paper’s conclusions may not depend on it.
- Based: fails — The paper may give no reason why it holds.
Probably not a substantial claim. The paper’s conclusions may not depend on it. The paper may give no reason why it holds. It may state two separate claims as one.
In the paper
“It is believed that these mutations in the ACE2 receptor binding domain increase the affinity for ACE2 (Zahradník et al., 2021).”
§ Reduced neutralization of SARS-CoV-2 B.1.1.7 variant by convalescent and vaccine sera > Introduction
What the sources say
- Not checked yetcites Zahradník et al., 2021
hedgeddirect- Asserted: passes — The authors put it forward as true.
- Checkable: passes — It can be checked against evidence.
- Load-bearing: fails — The paper’s conclusions may not depend on it.
- Based: passes — The paper gives a reason why it holds.
Probably not a substantial claim. The paper’s conclusions may not depend on it.
What the paper did — it cites no source for this, so there is none to check. The quote shows it is in the paper.
In the paper
“Error bars are derived from curve fitting and may underestimate experimental error.”
§ Reduced neutralization of SARS-CoV-2 B.1.1.7 variant by convalescent and vaccine sera > Results > Effect on mAb affinity
hedgedconditional- Asserted: passes — The authors put it forward as true.
- Checkable: passes — It can be checked against evidence.
- Load-bearing: fails — The paper’s conclusions may not depend on it.
- Based: passes — The paper gives a reason why it holds.
Probably not a substantial claim. The paper’s conclusions may not depend on it. It may state two separate claims as one.
What the paper did — it cites no source for this, so there is none to check. The quote shows it is in the paper.
In the paper
“The study was approved by the Oxford Translational Gastrointestinal Unit GI Biobank Study 16/YH/0247 [research ethics committee (REC) at Yorkshire & The Humber – Sheffield].”
§ Reduced neutralization of SARS-CoV-2 B.1.1.7 variant by convalescent and vaccine sera > STAR★Methods > Experimental model and subject details
plain- Asserted: passes — The authors put it forward as true.
- Checkable: passes — It can be checked against evidence.
- Load-bearing: fails — The paper’s conclusions may not depend on it.
- Based: passes — The paper gives a reason why it holds.
Probably not a substantial claim. The paper’s conclusions may not depend on it.
What the paper did — it cites no source for this, so there is none to check. The quote shows it is in the paper.
In the paper
“The correlates of protection from SARS-CoV-2 infection are yet to be established.”
§ Reduced neutralization of SARS-CoV-2 B.1.1.7 variant by convalescent and vaccine sera > Discussion > Limitations of the study
plain- Asserted: passes — The authors put it forward as true.
- Checkable: passes — It can be checked against evidence.
- Load-bearing: fails — The paper’s conclusions may not depend on it.
- Based: fails — The paper may give no reason why it holds.
Probably not a substantial claim. The paper’s conclusions may not depend on it. The paper may give no reason why it holds.
What the paper did — it cites no source for this, so there is none to check. The quote shows it is in the paper.
In the paper
“Written informed consent was obtained from all participants, and the trial is being done in accordance with the principles of the Declaration of Helsinki and Good Clinical Practice.”
§ Reduced neutralization of SARS-CoV-2 B.1.1.7 variant by convalescent and vaccine sera > STAR★Methods > Experimental model and subject details
plain- Asserted: passes — The authors put it forward as true.
- Checkable: passes — It can be checked against evidence.
- Load-bearing: fails — The paper’s conclusions may not depend on it.
- Based: passes — The paper gives a reason why it holds.
Probably not a substantial claim. The paper’s conclusions may not depend on it. It may state two separate claims as one.
What the paper did — it cites no source for this, so there is none to check. The quote shows it is in the paper.
In the paper
“The in vitro neutralization assays reported here do not convey the contributions to in vivo protection provided by T cells nor the contributions of Fcγ receptor interactions and complement activation.”
§ Reduced neutralization of SARS-CoV-2 B.1.1.7 variant by convalescent and vaccine sera > Discussion > Limitations of the study
plain- Asserted: passes — The authors put it forward as true.
- Checkable: passes — It can be checked against evidence.
- Load-bearing: fails — The paper’s conclusions may not depend on it.
- Based: passes — The paper gives a reason why it holds.
Probably not a substantial claim. The paper’s conclusions may not depend on it. It may state two separate claims as one.
In the paper
“In this study, B.1.1.7 showed only a 5.7-fold reduction in the FRNT50 for mAb 159 (FRNT50 Victoria 11 ng/mL B.1.1.7 61 ng/mL) suggesting that despite the residue 144 deletion being on the edge of the footprint for this antibody (Dejnirattisai et al., 2021) the binding site has not been completely disrupted.”
§ Reduced neutralization of SARS-CoV-2 B.1.1.7 variant by convalescent and vaccine sera > Discussion
What the sources say
- Not checked yetcites Dejnirattisai et al., 2021 source
hedgeddirect- Asserted: passes — The authors put it forward as true.
- Checkable: passes — It can be checked against evidence.
- Load-bearing: unclear — It is unclear whether the paper’s conclusions depend on it.
- Based: passes — The paper gives a reason why it holds.
It may state two separate claims as one.
The authors state this as an assumption.
A further increase in ACE2 affinity will increase the likelihood that stochastic virus attachment events lead to localization for sufficient time to trigger internalization.
“It is reasonable to assume that a further increase in affinity will increase the likelihood of the stochastic events of virus attachment resulting in localization for sufficient time to trigger, perhaps by the recruitment of additional receptors, internalization of the virus.”
The paper relies on this without support.
The higher affinity of SARS-CoV-2 for ACE2 underlies its greater transmission.
“the higher affinity for ACE2 of SARS-CoV-2 has been imputed to underlie its greater transmission.”
The paper relies on this without support.
The Pfizer vaccinees had no prior SARS-CoV-2 infection at entry.
“participants were to the best of their knowledge seronegative at entry”
“Vaccinees were Health Care Workers, based at Oxford University Hospitals NHS Foundation Trust, not known to have prior infection with SARS-C0V-2.”
Claims other papers make about this one
Each is checked against this paper’s own text: does it say what the citing paper says it does?
The source backs part of the claim, not all of it — or backs it for a different population, condition or comparison.
In the citing paper
“However, in three other studies, the median reduction in neutralizing activity was between onefold and threefold 102,214,215 .”
From The biological and clinical significance of emerging SARS-CoV-2 variants (2021) · cites this paper as [102]
Experimental — accuracy not yet measuredIn the citing paper
“In general, the impact of B.1.1.7 mutations on neutralizing antibody titers is moderate.15, 16, 17, 18,20,24”
From Impact of SARS-CoV-2 variants on the total CD4+ and CD8+ T cell reactivity in infected or vaccinated individuals (2021) · cites this paper as [18]
In the citing paper
“The neutralizing titers of convalescent and vaccine sera are reduced to the variants with B.1.351 of most concern, leading to a 13-fold reduction in neutralizing titers of convalescent serum, with a number of neutralizing monoclonal antibodies losing activity completely (Zhou et al., 2021; Supasa et al., 2021; Dejnirattisai et al., 2021b; Shinde et al., 2021; Madhi et al., 2021; Food and Drug Adm”
From Reduced neutralization of SARS-CoV-2 B.1.617 by vaccine and convalescent serum (2021) · cites this paper as Supasa et al., 2021
In the citing paper
“Conversely, vaccine efficacy against B.1.1.7 is maintained (Wang et al., 2021; Emary et al., 2021; Supasa et al., 2021).”
From Reduced neutralization of SARS-CoV-2 B.1.617 by vaccine and convalescent serum (2021) · cites this paper as Supasa et al., 2021
In the citing paper
“For B.1.617.2, reductions were comparable with those seen with B.1.1.7 and P.1 (Supasa et al., 2021; Dejnirattisai et al., 2021b)”
From Reduced neutralization of SARS-CoV-2 B.1.617 by vaccine and convalescent serum (2021) · cites this paper as Supasa et al., 2021
In the citing paper
“However, a further live coronavirus neutralisation assay showed that sera from BNT162b2 and ChAdOx1 nCoV-19 vaccinees had a 2·0–3·3 times reduction in neutralisation activity against B.1.1.7 compared with the Victoria lineage,44 in keeping with our findings.”
In the citing paper
“The Alpha variant is susceptible to neutralization by most neutralizing mAbs as well as by most plasma samples from previously infected persons 97,102,121,149,159,[203][204][205][206] (fIg.5).”
From The biological and clinical significance of emerging SARS-CoV-2 variants (2021) · cites this paper as [102]
In the citing paper
“The Alpha variant has displayed 3-fold to 10-fold reduced susceptibility to approximately 15% of plasma samples from recipients of an authorized mRNA vaccine 97,102,121,148,149,152,159,204,208,209 .”
From The biological and clinical significance of emerging SARS-CoV-2 variants (2021) · cites this paper as [102]
In the citing paper
“it is clear that the NTD mutations in P.1 (L18F, T20N, P26S, D138Y, and R190S) disrupt the epitope for mAb159”
From Antibody evasion by the P.1 strain of SARS-CoV-2 (2021) · cites this paper as Supasa et al., 2021
In the citing paper
“This is in contrast to the situation with most other VH3-53 antibodies, where direct contacts confer susceptibility to escape by mutation to a tyrosine (Figures 2I, 3J, and 3A; Supasa et al., 2021; Zhou et al., 2021).”
From Antibody evasion by the P.1 strain of SARS-CoV-2 (2021) · cites this paper as Supasa et al., 2021
In the citing paper
“N501Y increased affinity 7-fold, and the combination of 417, 484, and 501 mutations further increased affinity (19-fold compared to Wuhan).”
From Antibody evasion by the P.1 strain of SARS-CoV-2 (2021) · cites this paper as Supasa et al., 2021
In the citing paper
“It seems conceivable that this increase in receptor affinity may drive increased virus transmissibility, allowing the three variants to become dominant strains in the regions where they emerged (Zhou et al., 2021; Supasa et al., 2021).”
From Antibody evasion by the P.1 strain of SARS-CoV-2 (2021) · cites this paper as Supasa et al., 2021
In the citing paper
“Using convalescent serum, B.1.351 showed 13-fold reduction in neutralization compared to Victoria, while P.1 was only reduced 3.1-fold, comparable to the reduction seen with B.1.1.7, which only harbors the single N501Y change in the RBD (Zhou et al., 2021; Supasa et al., 2021).”
From Antibody evasion by the P.1 strain of SARS-CoV-2 (2021) · cites this paper as Supasa et al., 2021
In the citing paper
“The constructs of EY6A Fab, 222 Fab, ACE2, WT RBD, B.1.1.7 and B.1.351 mutant RBD are the same as previously described (Dejnirattisai et al., 2021; Zhou et al., 2021; Supasa et al., 2021).”
From Antibody evasion by the P.1 strain of SARS-CoV-2 (2021) · cites this paper as Supasa et al., 2021
Self-check
Percentages, sums and reported differences re-computed from the paper’s own numbers.
Each contradiction between two passages listed here was confirmed by an independent check.
Rated minor: it would not touch a result — a value no result rests on, a p-value that stays on the same side of the significance level, or a conflict that is clerical, resolved elsewhere in the paper, or outside its own findings.
In the paper
§ Reduced neutralization of SARS-CoV-2 B.1.1.7 variant by convalescent and vaccine sera > STAR★Methods > Method details
“Crystals of N501 RBD/269 Fab were mounted in loops and dipped in solution containing 25% glycerol and 75% mother liquor for a second before being frozen in liquid nitrogen prior to data collection.”
§ Reduced neutralization of SARS-CoV-2 B.1.1.7 variant by convalescent and vaccine sera > STAR★Methods > Method details
“No cryo-protectant was used for RBD/269 crystals.”
Rated minor: it would not touch a result — a value no result rests on, a p-value that stays on the same side of the significance level, or a conflict that is clerical, resolved elsewhere in the paper, or outside its own findings.
In the paper
§ Reduced neutralization of SARS-CoV-2 B.1.1.7 variant by convalescent and vaccine sera > STAR★Methods > Method details
“All COG-UK sequences were downloaded on 24th January 2020”
§ Reduced neutralization of SARS-CoV-2 B.1.1.7 variant by convalescent and vaccine sera > Results > The B.1.1.7 lineage
“During the week of December 24, 2020, the N501Y variant represented 53% of the sequenced isolates in Great Britain.”
Citations
Cites
Coot : model-building tools for molecular graphics
Emsley, P., & Cowtan, K. (2004) · Acta Crystallographica Section D Biological Crystallography · doi:10.1107/s0907444904019158 · Cited by 30,571
Phaser crystallographic software
McCoy, A. J., Grosse-Kunstleve, R. W., Adams, P. D., Winn, M. D., Storoni, L. C., & Read, R. J. (2007) · Journal of Applied Crystallography · doi:10.1107/s0021889807021206 · Cited by 20,612
Hoffmann, M., Kleine-Weber, H., Schroeder, S., Krüger, N., Herrler, T., Erichsen, S., Schiergens, T. S., Herrler, G., Wu, N.-H., Nitsche, A., et al. (2020) · Cell · doi:10.1016/j.cell.2020.02.052 · Cited by 20,286
Safety and Efficacy of the BNT162b2 mRNA Covid-19 Vaccine
Polack, F. P., Thomas, S. J., Kitchin, N., Absalon, J., Gurtman, A., Lockhart, S., Perez, J. L., Pérez Marc, G., Moreira, E. D., Zerbini, C., et al. (2020) · New England Journal of Medicine · doi:10.1056/nejmoa2034577 · Cited by 14,592
Efficacy and Safety of the mRNA-1273 SARS-CoV-2 Vaccine
Baden, L. R., El Sahly, H. M., Essink, B., Kotloff, K., Frey, S., Novak, R., Diemert, D., Spector, S. A., Rouphael, N., Creech, C. B., et al. (2021) · New England Journal of Medicine · doi:10.1056/nejmoa2035389 · Cited by 10,119
Inference of Macromolecular Assemblies from Crystalline State
Krissinel, E., & Henrick, K. (2007) · Journal of Molecular Biology · doi:10.1016/j.jmb.2007.05.022 · Cited by 10,007
Liebschner, D., Afonine, P. V., Baker, M. L., Bunkóczi, G., Chen, V. B., Croll, T. I., Hintze, B., Hung, L.-W., Jain, S., McCoy, A. J., et al. (2019) · Acta Crystallographica Section D Structural Biology · doi:10.1107/s2059798319011471 · Cited by 7,953
Structure of the SARS-CoV-2 spike receptor-binding domain bound to the ACE2 receptor
Lan, J., Ge, J., Yu, J., Shan, S., Zhou, H., Fan, S., Zhang, Q., Shi, X., Wang, Q., Zhang, L., et al. (2020) · Nature · doi:10.1038/s41586-020-2180-5 · Cited by 5,983
Voysey, M., Clemens, S. A. C., Madhi, S. A., Weckx, L. Y., Folegatti, P. M., Aley, P. K., Angus, B., Baillie, V. L., Barnabas, S. L., Bhorat, Q. E., et al. (2021) · The Lancet · doi:10.1016/s0140-6736(20)32661-1 · Cited by 4,616
Self-citationOu, X., Liu, Y., Lei, X., Li, P., Mi, D., Ren, L., Guo, L., Guo, R., Chen, T., Hu, J., et al. (2020) · Nature Communications · doi:10.1038/s41467-020-15562-9 · Cited by 3,097
Research works printed but not linked: 2
- Nelson, 2021, bioRxiv
- Zhu, 2021, Cryo-EM Structure of the N501Y SARS-CoV-2 Spike Protein in Complex with a Potent Neutralizing Antibody, bioRxiv
Cited by
Sorted by citations
The biological and clinical significance of emerging SARS-CoV-2 variants
Tao, K., Tzou, P. L., Nouhin, J., Gupta, R. K., de Oliveira, T., Kosakovsky Pond, S. L., Fera, D., & Shafer, R. W. (2021) · Nature Reviews Genetics · doi:10.1038/s41576-021-00408-x · Cited by 1,009
SARS-CoV-2 Omicron-B.1.1.529 leads to widespread escape from neutralizing antibody responses
Dejnirattisai, W., Huo, J., Zhou, D., Zahradník, J., Supasa, P., Liu, C., Duyvesteyn, H. M. E., Ginn, H. M., Mentzer, A. J., Tuekprakhon, A., et al. (2022) · Cell · doi:10.1016/j.cell.2021.12.046 · Cited by 930
Self-citationFiolet, T., Kherabi, Y., MacDonald, C.-J., Ghosn, J., & Peiffer-Smadja, N. (2022) · Clinical Microbiology and Infection · doi:10.1016/j.cmi.2021.10.005 · Cited by 911
Effect of 2 Inactivated SARS-CoV-2 Vaccines on Symptomatic COVID-19 Infection in Adults
Kaabi, N. A., Zhang, Y., Xia, S., Yang, Y., AlQahtani, M., Abdulrazzaq, N. M., Nusair, M. A., Hassany, M., Jawad, J. S., Abdalla, J., et al. (2021) · JAMA · doi:10.1001/jama.2021.8565 · Cited by 766
Self-citationAntibody escape of SARS-CoV-2 Omicron BA.4 and BA.5 from vaccine and BA.1 serum
Tuekprakhon, A., Nutalai, R., Dijokaite-Guraliuc, A., Zhou, D., Ginn, H. M., Selvaraj, M., Liu, C., Mentzer, A. J., Supasa, P., Duyvesteyn, H. M. E., et al. (2022) · Cell · doi:10.1016/j.cell.2022.06.005 · Cited by 687
Self-citation
Metadata
- Authors
- Supasa, P., Zhou, D., Dejnirattisai, W., Liu, C., Mentzer, A. J., Ginn, H. M., Zhao, Y., Duyvesteyn, H. M. E., Nutalai, R., Tuekprakhon, A., Wang, B., Paesen, G. C., Slon-Campos, J., López-Camacho, C., Hallis, B., Coombes, N., Bewley, K. R., Charlton, S., Walter, T. S., Barnes, E., Dunachie, S. J., Skelly, D., Lumley, S. F., Baker, N., Shaik, I., Humphries, H. E., Godwin, K., Gent, N., Sienkiewicz, A., Dold, C., Levin, R., Dong, T., Pollard, A. J., Knight, J. C., Klenerman, P., Crook, D., Lambe, T., Clutterbuck, E., Bibi, S., Flaxman, A., Bittaye, M., Belij-Rammerstorfer, S., Gilbert, S., Hall, D. R., Williams, M. A., Paterson, N. G., James, W., Carroll, M. W., Fry, E. E., Mongkolsapaya, J., Ren, J., Stuart, D. I., & Screaton, G. R.
- Affiliations
- Centre for Human Genetics (GB)
- Diamond Light Source (GB)
- Public Health England (GB)
- University of Oxford (GB)
- Worthing Hospital (GB)
- Siriraj Hospital (TH)
- Corresponding author
- Mongkolsapaya, Juthathip
- Ren, Jingshan
- Stuart, David I.
- Screaton, Gavin R.
- ORCID
- Supasa, Piyada
- Zhou, Daming
- Liu, Chang
- Mentzer, Alexander J.
- Ginn, Helen M.
- Zhao, Yuguang
- Duyvesteyn, Helen M.E.
- Nutalai, Rungtiwa
- Tuekprakhon, Aekkachai
- Wang, Beibei
- Paesen, Guido C.
- Slon-Campos, Jose
- López-Camacho, César
- Hallis, Bassam
- Coombes, Naomi
- Bewley, Kevin R.
- Charlton, Sue
- Walter, Thomas S.
- Barnes, Eleanor
- Dunachie, Susanna J.
- Skelly, Donal
- Lumley, Sheila F.
- Baker, Natalie
- Shaik, Imam
- Humphries, Holly E.
- Gent, Nick
- Dold, Christina
- Dong, Tao
- Pollard, Andrew J.
- Knight, Julian C.
- Klenerman, Paul
- Crook, Derrick
- Lambe, Teresa
- Clutterbuck, Elizabeth
- Bibi, Sagida
- Flaxman, Amy
- Bittaye, Mustapha
- Gilbert, Sarah
- Hall, David R.
- Williams, Mark A.
- Paterson, Neil G.
- James, William
- Carroll, Miles W.
- Fry, Elizabeth E.
- Mongkolsapaya, Juthathip
- Ren, Jingshan
- Stuart, David I.
- Screaton, Gavin R.
- Venue
- Cell
- Publisher
- Elsevier BV
- Published
- 2021-04
- Volume
- 184
- Issue
- 8
- Pages
- 2201-2211.e7
- ISSN
- 0092-8674 (ISSN-L)
- PMC
- PMC7891044
- OpenAlex
- W3129558828
- Cited by
- 460
- References
- 60
- Citations by year
- 2025: 15 · 2024: 24 · 2023: 60 · 2022: 171 · 2021: 188
- FWCI
- 35.16
- Type
- journal article
- Language
- en
- Open access
- hybrid
- doi.org
- Licence
- Locations
- Cell (publishedVersion, cc-by)
- PubMed Central (publishedVersion, cc-by)
- PubMed (publishedVersion)
- Greater South Information System
- Funders
- UK Research and Innovation
- MRC (MR/N00065X/1)
- China Academy of Chinese Medical Sciences (2018-I2M-2-002)
- National Institute for Health Research (203141/Z/16/Z, 095541/A/11/Z, 090532/Z/09/Z)
- Coalition for Epidemic Preparedness Innovations
- Department of Health and Social Care
- NIHR Oxford Biomedical Research Centre
- National Institutes of Health (U19 I082360, WT204969/Z/16/Z)
- Wellcome Trust (101122/Z/13/Z)
- Cancer Research UK (C375/A17721)
- Chinese Academy of Medical Sciences
- Public Health England
- Topics
- Health Sciences › Medicine › Infectious Diseases › SARS-CoV-2 and COVID-19 Research
- Life Sciences › Biochemistry, Genetics and Molecular Biology › Molecular Biology › vaccines and immunoinformatics approaches
- Life Sciences › Agricultural and Biological Sciences › Animal Science and Zoology › Animal Virus Infections Studies
- Keywords
- SARS-CoV-2, B.1.1.7 variant, N501Y mutation, spike protein, antibody neutralization, antibody escape, monoclonal antibodies, convalescent sera, ACE2 binding
- MeSH terms
- COVID-19, SARS-CoV-2, Animals, Antibodies, Monoclonal, Antibodies, Viral, Chlorocebus aethiops, Cricetulus, Humans, Protein Binding, Structure-Activity Relationship, Vero Cells, CHO Cells, Antibodies, Neutralizing, HEK293 Cells, Pandemics, Spike Glycoprotein, Coronavirus
About these checks
Registry, retraction, Cites and statistics results are computed, not judged, with one exception: a printed reference that no index lists is read once by a model before it counts as a citation error. Claims are extracted by a model and kept only when their quote appears verbatim in the text; each cited source is then checked, with a model’s help, for whether it says what the claim relies on. Those verdicts can be wrong — read the claim’s quote and the cited source before relying on one.
A language model drew the claims from the paper on 2026-10-06, under version 3 of the claim definition (model deepseek-v4.1-flash, prompt extract-v3).
A second model labelled each claim on 2026-10-06 (model jev-1.13-20260917, definition revision gold-guideline-v0.2).
Cited sources are checked with a language model’s help (gpt-6-sol).
Statistics and arithmetic are recomputed, not judged.
Confidence bands are shown only for fields calibrated on our annotated test set. None is calibrated yet, so no band is shown.
What counts as a claim ›How we measure confidence ›How we check this ›
Are you an author, or do you see a problem with this page? Request a review
